Download as PDF, PPTX


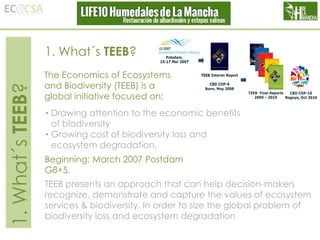
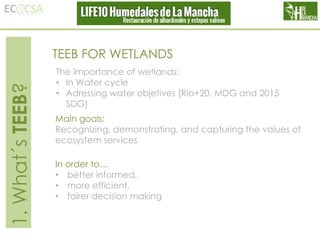
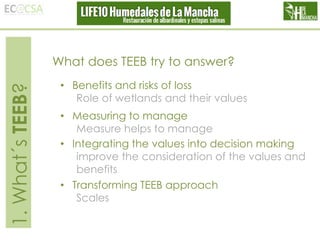
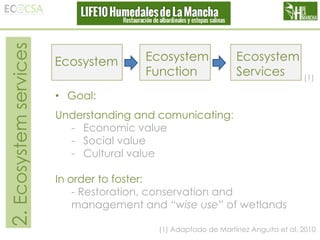
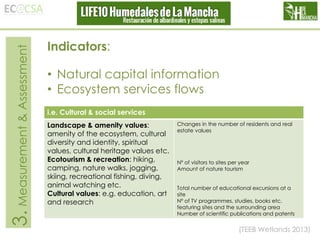


The Economics of Ecosystems and Biodiversity (TEEB) initiative aims to highlight the economic values of biodiversity and the increasing costs associated with its loss. TEEB focuses on ecosystem services, especially wetlands, advocating for informed decision-making that recognizes their economic, social, and cultural worth. It emphasizes the need for effective measurement, assessment, and communication strategies to manage wetland ecosystems sustainably.


