This PowerPoint presentation provides a thorough grasp of standard curve preparation. Through detailed explanations and illustrative visuals, viewers will gain a comprehensive understanding of the process, enabling them to confidently apply this essential technique in their scientific endeavors.
1. Md Shahjahan Kabir
B.Sc. In Food and Process Engineering
MS in Food Processing and Preservation (1st semester)
Hajee Mohammad Danesh Science and Technology university, Dinajpur
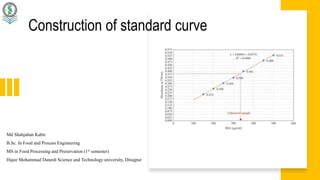
Construction of standard curve
2. Standard Curve
The standard curve is a graphical representation of the relationship between the concentration of
the analyte and the corresponding signal response generated by the analytical instrument.
Standard curve preparation is a fundamental technique in analytical chemistry used to relate the
concentration of an analyte (substance being analyzed) to a measurable signal, such as
absorbance, fluorescence intensity, or electrical current.
3. Standard Curve
The standard curve is typically prepared by measuring the signal response (e.g.,
absorbance) of a series of standard solutions with known concentrations of the
analyte. These standard solutions are prepared by diluting a stock solution of
the analyte to create a range of concentrations. The signal responses obtained
from these standard solutions are then plotted against their respective
concentrations to generate the standard curve
4. Importance of standard curve
preparation
Quantification: Standard curve preparation allows for the quantification of unknown
concentrations of the analyte in samples by comparing their signal responses to those obtained
from the standard solutions.
Calibration: Standard curves serve as a calibration tool for the analytical instrument. They
ensure that the instrument is operating accurately and reliably within the linear range of
measurement.
5. Importance of standard curve preparation
Quality control: Standard curves provide a means for assessing the precision
and accuracy of analytical methods. Deviations from the standard curve may
indicate problems with the instrument or the analysis technique.
Validation: Standard curves are essential for validating analytical methods,
particularly in research and regulatory settings. They demonstrate the linearity,
sensitivity, and range of the analytical method.
6. Importance of standard curve preparation
Comparison: Standard curves allow for the comparison of results obtained from
different instruments, laboratories, or studies. They provide a common reference point
for interpreting analytical data.
standard curve preparation is a critical step in analytical chemistry, providing a
foundation for accurate and reliable quantification of analytes in various samples.
7. Primary steps in preparation specific standard curve
Identify Analytes: Determine which compounds or substances you want to analyze.
These could be specific chemicals, biomolecules, drugs, or any other substances of
interest.
Select Standards: Obtain pure samples of the analytes you've identified. These will
serve as your standard solutions.
Range Determination: Decide on the concentration range you want to cover in your
standard curve. This range should ideally encompass the expected concentrations of
your analytes in your samples.
8. Primary steps in preparation specific standard curve
Instrument Compatibility: Ensure that the analytical technique or instrument you're
using is compatible with the compounds you've selected. Different compounds may
require different analytical methods (e.g., UV-Vis spectroscopy, HPLC, GC-MS, etc.).
Validation: Validate your standard curve by analyzing the standard solutions using
your chosen analytical method. Ensure that the responses obtained are linear over the
concentration range and that they accurately reflect the concentration of the analyte in
each solution.
9. Preparation of stock solution
1.Determine the volume of stock solution needed
2.Calculate the mass of compound needed
3.Weigh the compound
4.Dissolve the compound
5.Mix thoroughly
6.Transfer to a volumetric flask
7.Label the flask
8.Verify concentration (optional)
10. Preparation of stock solution (Example: Total Phenol Content )
Standard (Gallic Acid)
Gallic Acid = 1250 µM
= 1250X10-6M
We know that,
C= (1000xW)/ (MxV)
Now,
W= (CxMxV)/1000
= (1250x10-6 X170.12x10)/1000
= 0.00213g/mL
=2.13mg/mL
Here,
C= 1250x10-6 M
M= 170.12g
V=10mL
W=?
11. Preparation of stock solution (Example: Total
Phenol Content )
0.0021g Gallic Acid
Pour in 10mL Methanol
Mixing thoroughly by magnetic stirrer
Preparation of Stock solution (Gallic acid + Methanol)
13. Standard Curve For TPC
0.5 ml Sample (from table)
0.5 mL FCR
Vortex 5sec
1mL Na2CO3
8mL Distil Water
Vortex 10 sec
Stand for 35 min in Dark Place
Centrifuge at 4000r[pm for 10min
Read absorbance in 96wellplate at 765nm