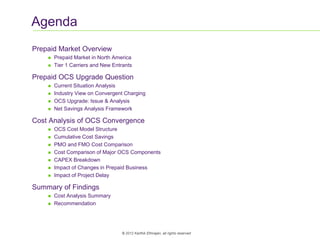
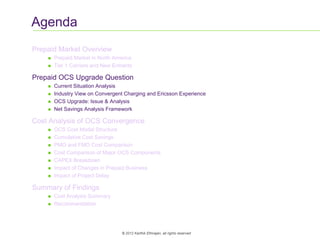
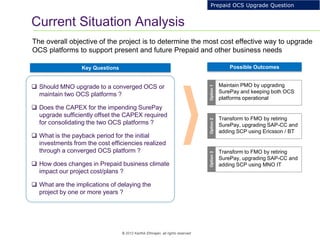
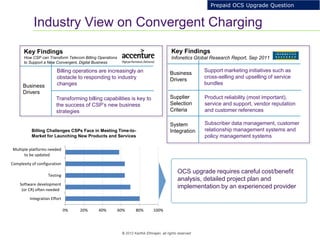
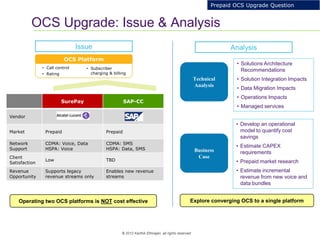
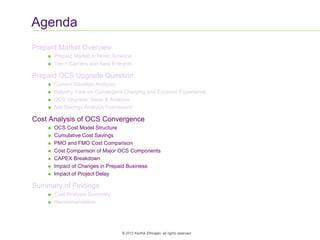
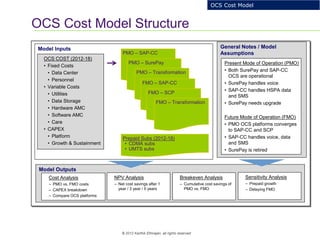
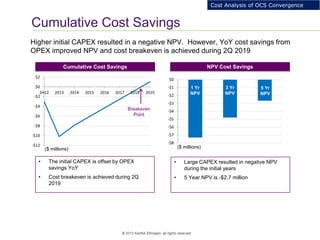
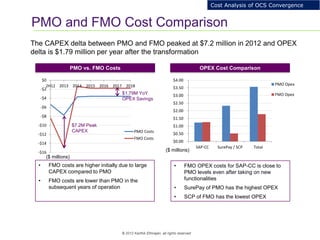
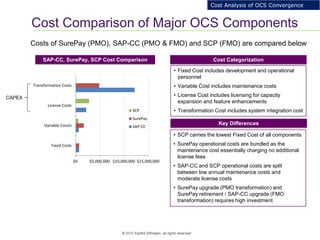
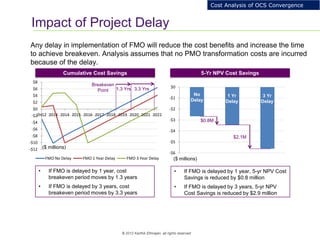
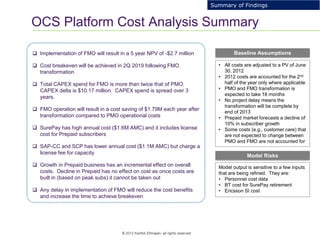
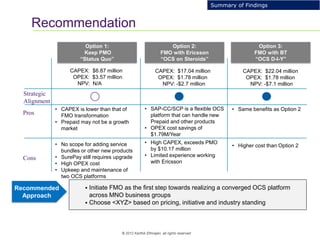
© 2012 Karthik Ethirajan, all rights reserved
Business Case for Prepaid OCS
Convergence
Karthik Ethirajan
March 2012
2
© 2012 Karthik Ethirajan, all rights reserved
Agenda
Prepaid Market Overview
 Prepaid Market in North America
 Tier 1 Carriers and New Entrants
Prepaid OCS Upgrade Question
 Current Situation Analysis
 Industry View on Convergent Charging
 OCS Upgrade: Issue & Analysis
 Net Savings Analysis Framework
Cost Analysis of OCS Convergence
 OCS Cost Model Structure
 Cumulative Cost Savings
 PMO and FMO Cost Comparison
 Cost Comparison of Major OCS Components
 CAPEX Breakdown
 Impact of Changes in Prepaid Business
 Impact of Project Delay
Summary of Findings
 Cost Analysis Summary
 Recommendation
3
© 2012 Karthik Ethirajan, all rights reserved
Prepaid Market in North America
Mobile prepaid market growth has been stagnant in Canada, while US shows some
progression
 Mobile prepaid market has shown zero growth in Canada, while postpaid market
experiences small increase to population penetration
 In 2013, Canada can expect a 1% increase in prepaid subscriptions
Implications
Source: Pyramid, 2011
Stagnant CDN
Growth
Expected US
Growth
Prepaid Market Overview
4
© 2012 Karthik Ethirajan, all rights reserved
Tier 1 Carriers and New Entrants
Tier 1 carriers have had a steady hold on the prepaid market share
1Q09 2Q09 3Q09 4Q09 1Q10 2Q10 3Q10 4Q10 1Q11 2Q11 3Q11
BCE 26.8% 26.3% 26.0% 26.2% 25.6% 25.2% 24.4% 23.5% 22.4% 21.5% 20.7%
Rogers 18.2% 17.8% 17.9% 17.8% 17.4% 17.4% 17.9% 18.4% 18.2% 18.3% 18.9%
TELUS 19.5% 19.3% 19.1% 18.7% 18.8% 18.2% 18.0% 18.0% 18.1% 17.6% 17.3%
Prepaid Share of Subscriptions- Tier 1 Carriers
Stagnant/
Declining
Incumbents face
decreasing market share
and ARPU with prepaid,
primarily due to stiff
competition from new
entrants who are
aggressively targeting this
segment
Heightened
Competition
Source: Strategy Analytics , BMI 2011
 In order to stay competitive, MNO may need to upgrade its OSS/BSS to reduce
cost and to offer new products bundles and service plansImplications
Prepaid Market Overview
Competitors Monthly Prepaid vs. Postpaid ARPU
CAD
5
© 2012 Karthik Ethirajan, all rights reserved
Agenda
Prepaid Market Overview
 Prepaid Market in North America
 Tier 1 Carriers and New Entrants
Prepaid OCS Upgrade Question
 Current Situation Analysis
 Industry View on Convergent Charging and Ericsson Experience
 OCS Upgrade: Issue & Analysis
 Net Savings Analysis Framework
Cost Analysis of OCS Convergence
 OCS Cost Model Structure
 Cumulative Cost Savings
 PMO and FMO Cost Comparison
 Cost Comparison of Major OCS Components
 CAPEX Breakdown
 Impact of Changes in Prepaid Business
 Impact of Project Delay
Summary of Findings
 Cost Analysis Summary
 Recommendation
6
© 2012 Karthik Ethirajan, all rights reserved
Current Situation Analysis
Key Questions
The overall objective of the project is to determine the most cost effective way to upgrade
OCS platforms to support present and future Prepaid and other business needs
 Should MNO upgrade to a converged OCS or
maintain two OCS platforms ?
 Does the CAPEX for the impending SurePay
upgrade sufficiently offset the CAPEX required
for consolidating the two OCS platforms ?
 What is the payback period for the initial
investments from the cost efficiencies realized
through a converged OCS platform ?
 How does changes in Prepaid business climate
impact our project cost/plans ?
 What are the implications of delaying the
project by one or more years ?
Possible Outcomes
Maintain PMO by upgrading
SurePay and keeping both OCS
platforms operational
Option1
Transform to FMO by retiring
SurePay, upgrading SAP-CC and
adding SCP using Ericsson / BT
Option2
Transform to FMO by retiring
SurePay, upgrading SAP-CC and
adding SCP using MNO IT
Option3
Prepaid OCS Upgrade Question
7
© 2012 Karthik Ethirajan, all rights reserved
Industry View on Convergent Charging
Support marketing initiatives such as
cross-selling and upselling of service
bundles
Key Findings
Infonetics Global Research Report, Sep 2011
Business
Drivers
Supplier
Selection
Criteria
System
Integration
Product reliability (most important),
service and support, vendor reputation
and customer references
Subscriber data management, customer
relationship management systems and
policy management systems
Prepaid OCS Upgrade Question
0% 20% 40% 60% 80% 100%
Integration Effort
Software development
(or CR) often needed
Testing
Complexity of configuration
Multiple platforms needed
to be updated
Billing Challenges CSPs Face in Meeting Time-to-
Market for Launching New Products and Services
Billing operations are increasingly an
obstacle to responding to industry
changes
Key Findings
How CSP can Transform Telecom Billing Operations
to Support a New Convergent, Digital Business
Business
Drivers
Transforming billing capabilities is key to
the success of CSP’s new business
strategies
OCS upgrade requires careful cost/benefit
analysis, detailed project plan and
implementation by an experienced provider
8
© 2012 Karthik Ethirajan, all rights reserved
OCS Upgrade: Issue & Analysis
• Call control
• Rating
OCS Platform
SurePay SAP-CC
Vendor
Market Prepaid Prepaid
Network
Support
CDMA: Voice, Data
HSPA: Voice
CDMA: SMS
HSPA: Data, SMS
Client
Satisfaction
Low TBD
Revenue
Opportunity
Supports legacy
revenue streams only
Enables new revenue
streams
Operating two OCS platforms is NOT cost effective
Issue Analysis
Technical
Analysis
Business
Case
• Solutions Architecture
Recommendations
• Solution Integration Impacts
• Data Migration Impacts
• Operations Impacts
• Managed services
• Develop an operational
model to quantify cost
savings
• Estimate CAPEX
requirements
• Prepaid market research
• Estimate incremental
revenue from new voice and
data bundles
• Subscriber
charging & billing
Explore converging OCS to a single platform
Prepaid OCS Upgrade Question
9
© 2012 Karthik Ethirajan, all rights reserved
Net Savings Analysis Framework
SurePay + SAP-CC
CAPEX
SAP-CC
0
OPEX
Operational
Cost Savings
Incremental
CAPEX
Net Savings
Cost savings from upgrading to SAP-CC OCS is the net of operational cost savings from
a converged OCS platform with initial incremental CAPEX requirement
• SurePay is a legacy OCS that
has a higher operating cost
• However, SurePay needs to be
upgrade in the near term
• SAP-CC is a new converged
OCS with a lower operating cost
• However, retiring SurePay
requires high CAPEX
0
Fixed
Cost
Variable
Cost
Platform
Growth &
Sustainment
Variable
Cost
Fixed
Cost
Platform
Growth &
Sustainment
PMO
FMO
Prepaid OCS Upgrade Question
10
© 2012 Karthik Ethirajan, all rights reserved
Agenda
Prepaid Market Overview
 Prepaid Market in North America
 Tier 1 Carriers and New Entrants
Prepaid OCS Upgrade Question
 Current Situation Analysis
 Industry View on Convergent Charging and Ericsson Experience
 OCS Upgrade: Issue & Analysis
 Net Savings Analysis Framework
Cost Analysis of OCS Convergence
 OCS Cost Model Structure
 Cumulative Cost Savings
 PMO and FMO Cost Comparison
 Cost Comparison of Major OCS Components
 CAPEX Breakdown
 Impact of Changes in Prepaid Business
 Impact of Project Delay
Summary of Findings
 Cost Analysis Summary
 Recommendation
11
© 2012 Karthik Ethirajan, all rights reserved
OCS Cost Model Structure
Model Inputs General Notes / Model
Assumptions
Model Outputs
Present Mode of Operation (PMO)
• Both SurePay and SAP-CC
OCS are operational
• SurePay handles voice
• SAP-CC handles HSPA data
and SMS
• SurePay needs upgrade
Future Mode of Operation (FMO)
• PMO OCS platforms converges
to SAP-CC and SCP
• SAP-CC handles voice, data
and SMS
• SurePay is retired
NPV Analysis
– Net cost savings after 1
year / 3 year / 5 years
Cost Analysis
– PMO vs. FMO costs
– CAPEX breakdown
– Compare OCS platforms
OCS COST (2012-18)
• Fixed Costs
• Data Center
• Personnel
• Variable Costs
• Utilities
• Data Storage
• Hardware AMC
• Software AMC
• Care
• CAPEX
• Platform
• Growth & Sustainment
PMO – SAP-CC
PMO – SurePay
PMO – Transformation
FMO – SAP-CC
FMO – SCP
FMO – Transformation
Prepaid Subs (2012-18)
• CDMA subs
• UMTS subs
Breakeven Analysis
– Cumulative cost savings of
PMO vs. FMO
Sensitivity Analysis
– Prepaid growth
– Delaying FMO
OCS Cost Model
12
© 2012 Karthik Ethirajan, all rights reserved
Cumulative Cost Savings
Cost Analysis of OCS Convergence
-$12
-$10
-$8
-$6
-$4
-$2
$0
$2
2H12 2013 2014 2015 2016 2017 2018 2019
Higher initial CAPEX resulted in a negative NPV. However, YoY cost savings from
OPEX improved NPV and cost breakeven is achieved during 2Q 2019
-$8
-$7
-$6
-$5
-$4
-$3
-$2
-$1
$0
NPV Cost Savings
• The initial CAPEX is offset by OPEX
savings YoY
• Cost breakeven is achieved during 2Q
2019
• Large CAPEX resulted in negative NPV
during the initial years
• 5 Year NPV is -$2.7 million
Cumulative Cost Savings
1 Yr
NPV
3 Yr
NPV
5 Yr
NPV
Breakeven
Point
($ millions)($ millions)
13
© 2012 Karthik Ethirajan, all rights reserved
PMO and FMO Cost Comparison
Cost Analysis of OCS Convergence
The CAPEX delta between PMO and FMO peaked at $7.2 million in 2012 and OPEX
delta is $1.79 million per year after the transformation
OPEX Cost Comparison
• FMO costs are higher initially due to large
CAPEX compared to PMO
• FMO costs are lower than PMO in the
subsequent years of operation
• FMO OPEX costs for SAP-CC is close to
PMO levels even after taking on new
functionalities
• SurePay of PMO has the highest OPEX
• SCP of FMO has the lowest OPEX
PMO vs. FMO Costs
1 Yr
NPV
3 Yr
NPV
5 Yr
NPV
$0.00
$0.50
$1.00
$1.50
$2.00
$2.50
$3.00
$3.50
$4.00
SAP-CC SurePay / SCP Total
PMO Opex
FMO Opex
-$16
-$14
-$12
-$10
-$8
-$6
-$4
-$2
$0
2H12 2013 2014 2015 2016 2017 2018
PMO Costs
FMO Costs
($ millions)
($ millions)
$1.79M YoY
OPEX Savings
$7.2M Peak
CAPEX
14
© 2012 Karthik Ethirajan, all rights reserved
Cost Comparison of Major OCS Components
Cost Analysis of OCS Convergence
Costs of SurePay (PMO), SAP-CC (PMO & FMO) and SCP (FMO) are compared below
Cost Categorization
• SCP carries the lowest Fixed Cost of all components
• SurePay operational costs are bundled as the
maintenance cost essentially charging no additional
license fees
• SAP-CC and SCP operational costs are split
between low annual maintenance costs and
moderate license costs
• SurePay upgrade (PMO transformation) and
SurePay retirement / SAP-CC upgrade (FMO
transformation) requires high investment
• Fixed Cost includes development and operational
personnel
• Variable Cost includes maintenance costs
• License Cost includes licensing for capacity
expansion and feature enhancements
• Transformation Cost includes system integration cost
SAP-CC, SurePay, SCP Cost Comparison
$0 $5,000,000 $10,000,000 $15,000,000
Fixed Costs
Variable Cossts
License Costs
Transformation Costs
SCP
SurePay
SAP-CC
Key Differences
CAPEX
15
© 2012 Karthik Ethirajan, all rights reserved
CAPEX Breakdown
Cost Analysis of OCS Convergence
Total CAPEX spend for FMO is more than twice that of PMO. Platform and G&S CAPEX
for FMO exceeds PMO by $5.60 million and $4.56 million respectively
FMO CAPEX
• PMO CAPEX is spread over 3 years
• Total CAPEX spend in PMO is $6.87
million
• Platform CAPEX is 21% of Total CAPEX
• G&S CAPEX is 79% of Total CAPEX
• FMO CAPEX is spread over 3 years
• Total CAPEX spend in PMO is $17.04
million
• Platform CAPEX is 41% of Total CAPEX
• G&S CAPEX is 59% of Total CAPEX
PMO CAPEX
($ millions) ($ millions)
$0
$2
$4
$6
$8
$10
$12
$14
$16
$18
2012 2013 2014 Total
Growth & Sustainment
Platform
$0
$2
$4
$6
$8
$10
$12
$14
$16
$18
2012 2013 2014 Total
16
© 2012 Karthik Ethirajan, all rights reserved
Impact of Changes in Prepaid Business
Cost Analysis of OCS Convergence
Growth in Prepaid business has an incremental effect on overall costs. Decline in
Prepaid has no effect on cost.
Key Insights
• FMO OPEX is twice as sensitive as PMO OPEX to
Prepaid growth
 PMO OPEX cost increased by 7% and 13% when
Prepaid growth was 10% and 20% respectively
 FMO OPEX cost increased by 14% and 28%
when Prepaid growth was 10% and 20%
respectively
• NPV Cost Savings (difference between PMO and
FMO costs) is much less sensitive to Prepaid growth
 PMO OPEX cost increased by 7% and 13% when
Prepaid growth was 10% and 20% respectively
• Decline in Prepaid has no effect on PMO or FMO
OPEX and NPV Cost Savings
 Costs built in based on peak subscriber demand
stays permanently
Prepaid Growth Sensitivity on Costs
($4)
($3)
($2)
($1)
$0
$1
$2
$3
$4
$5
NPV Cost Savings PMO Opex FMO Opex
20% Prepaid Growth
10% Prepaid Growth
0% Prepaid Growth
-10% Prepaid Growth
-20% Prepaid Growth
($ millions)
17
© 2012 Karthik Ethirajan, all rights reserved
Impact of Project Delay
Cost Analysis of OCS Convergence
Any delay in implementation of FMO will reduce the cost benefits and increase the time
to achieve breakeven. Analysis assumes that no PMO transformation costs are incurred
because of the delay.
5-Yr NPV Cost Savings
• If FMO is delayed by 1 year, cost
breakeven period moves by 1.3 years
• If FMO is delayed by 3 years, cost
breakeven period moves by 3.3 years
• If FMO is delayed by 1 year, 5-yr NPV Cost
Savings is reduced by $0.8 million
• If FMO is delayed by 3 years, 5-yr NPV
Cost Savings is reduced by $2.9 million
Cumulative Cost Savings
($ millions)
($ millions)
-$12
-$10
-$8
-$6
-$4
-$2
$0
$2
$4
$6
$8
2H12 2013 2014 2015 2016 2017 2018 2019 2020 2021 2022
FMO No Delay FMO 1 Year Delay FMO 3 Year Delay
-$6
-$5
-$4
-$3
-$2
-$1
$0
No
Delay
1 Yr
Delay
3 Yr
Delay
Breakeven
Point 1.3 Yrs 3.3 Yrs
$0.8M
$2.1M
18
© 2012 Karthik Ethirajan, all rights reserved
-$12
-$10
-$8
-$6
-$4
-$2
$0
Impact of Project Delay
Cost Analysis of OCS Convergence
Any delay in implementation of FMO will reduce the cost benefits and increase the time
to achieve breakeven. Analysis assumes that both FMO and PMO transformation costs
are incurred because of the delay.
5-Yr NPV Cost Savings
• If FMO is delayed by even 1 year, cost
breakeven will not be achieved for over 10
years
• If FMO is delayed by 1 year, 5-yr NPV Cost
Savings is reduced by $4.9 million
• If FMO is delayed by 3 years, 5-yr NPV
Cost Savings is reduced by $7 million
Cumulative Cost Savings
($ millions)
($ millions)
No
Delay
1 Yr
Delay
3 Yr
Delay$4.9M
$2.1M
-20
-15
-10
-5
0
5
10
2H12 2013 2014 2015 2016 2017 2018 2019 2020 2021 2022
FMO No Delay FMO 1 Year Delay FMO 3 Year Delay
Breakeven
Point
19
© 2012 Karthik Ethirajan, all rights reserved
Agenda
Prepaid Market Overview
 Prepaid Market in North America
 Tier 1 Carriers and New Entrants
Prepaid OCS Upgrade Question
 Current Situation Analysis
 Industry View on Convergent Charging and Ericsson Experience
 OCS Upgrade: Issue & Analysis
 Net Savings Analysis Framework
Cost Analysis of OCS Convergence
 OCS Cost Model Structure
 Cumulative Cost Savings
 PMO and FMO Cost Comparison
 Cost Comparison of Major OCS Components
 CAPEX Breakdown
 Impact of Changes in Prepaid Business
 Impact of Project Delay
Summary of Findings
 Cost Analysis Summary
 Recommendation
20
© 2012 Karthik Ethirajan, all rights reserved
OCS Platform Cost Analysis Summary
Summary of Findings
 Implementation of FMO will result in a 5 year NPV of -$2.7 million
 Cost breakeven will be achieved in 2Q 2019 following FMO
transformation
 Total CAPEX spend for FMO is more than twice that of PMO.
CAPEX delta is $10.17 million. CAPEX spend is spread over 3
years.
 FMO operation will result in a cost saving of $1.79M each year after
transformation compared to PMO operational costs
 SurePay has high annual cost ($1.6M AMC) and it includes license
cost for Prepaid subscribers
 SAP-CC and SCP has lower annual cost ($1.1M AMC) but charge a
license fee for capacity
 Growth in Prepaid business has an incremental effect on overall
costs. Decline in Prepaid has no effect on cost as once costs are
built in (based on peak subs) it cannot be taken out
 Any delay in implementation of FMO will reduce the cost benefits
and increase the time to achieve breakeven
Baseline Assumptions
• All costs are adjusted to a PV of June
30, 2012
• 2012 costs are accounted for the 2nd
half of the year only where applicable
• PMO and FMO transformation is
expected to take 18 months
• No project delay means the
transformation will be complete by
end of 2013
• Prepaid market forecasts a decline of
10% in subscriber growth
• Some costs (e.g., customer care) that
are not expected to change between
PMO and FMO are not accounted for
Model Risks
Model output is sensitive to a few inputs
that are being refined. They are:
• Personnel cost data
• BT cost for SurePay retirement
• Ericsson SI cost
21
© 2012 Karthik Ethirajan, all rights reserved
Recommendation
Summary of Findings
 Initiate FMO as the first step towards realizing a converged OCS platform
across MNO business groups
 Choose <XYZ> based on pricing, initiative and industry standing
Recommended
Approach
Option 1:
Keep PMO
“Status Quo”
Option 2:
FMO with Ericsson
“OCS on Steroids”
Option 3:
FMO with BT
“OCS D-I-Y”
Pros
Cons
• CAPEX is lower than that of
FMO transformation
• Prepaid may not be a growth
market
• No scope for adding service
bundles or other new products
• SurePay still requires upgrade
• High OPEX cost
• Upkeep and maintenance of
two OCS platforms
• SAP-CC/SCP is a flexible OCS
platform that can handle new
Prepaid and other products
• OPEX cost savings of
$1.79M/Year
• High CAPEX, exceeds PMO
by $10.17 million
• Limited experience working
with Ericsson
• Same benefits as Option 2
• Higher cost than Option 2
CAPEX: $17.04 million
OPEX: $1.78 million
NPV: -$2.7 million
CAPEX: $6.87 million
OPEX: $3.57 million
NPV: N/A
CAPEX: $22.04 million
OPEX: $1.78 million
NPV: -$7.1 million
Strategic
Alignment

Prepaid OCS Convergence Model

  • 1.
    © 2012 KarthikEthirajan, all rights reserved Business Case for Prepaid OCS Convergence Karthik Ethirajan March 2012
  • 2.
    2 © 2012 KarthikEthirajan, all rights reserved Agenda Prepaid Market Overview  Prepaid Market in North America  Tier 1 Carriers and New Entrants Prepaid OCS Upgrade Question  Current Situation Analysis  Industry View on Convergent Charging  OCS Upgrade: Issue & Analysis  Net Savings Analysis Framework Cost Analysis of OCS Convergence  OCS Cost Model Structure  Cumulative Cost Savings  PMO and FMO Cost Comparison  Cost Comparison of Major OCS Components  CAPEX Breakdown  Impact of Changes in Prepaid Business  Impact of Project Delay Summary of Findings  Cost Analysis Summary  Recommendation
  • 3.
    3 © 2012 KarthikEthirajan, all rights reserved Prepaid Market in North America Mobile prepaid market growth has been stagnant in Canada, while US shows some progression  Mobile prepaid market has shown zero growth in Canada, while postpaid market experiences small increase to population penetration  In 2013, Canada can expect a 1% increase in prepaid subscriptions Implications Source: Pyramid, 2011 Stagnant CDN Growth Expected US Growth Prepaid Market Overview
  • 4.
    4 © 2012 KarthikEthirajan, all rights reserved Tier 1 Carriers and New Entrants Tier 1 carriers have had a steady hold on the prepaid market share 1Q09 2Q09 3Q09 4Q09 1Q10 2Q10 3Q10 4Q10 1Q11 2Q11 3Q11 BCE 26.8% 26.3% 26.0% 26.2% 25.6% 25.2% 24.4% 23.5% 22.4% 21.5% 20.7% Rogers 18.2% 17.8% 17.9% 17.8% 17.4% 17.4% 17.9% 18.4% 18.2% 18.3% 18.9% TELUS 19.5% 19.3% 19.1% 18.7% 18.8% 18.2% 18.0% 18.0% 18.1% 17.6% 17.3% Prepaid Share of Subscriptions- Tier 1 Carriers Stagnant/ Declining Incumbents face decreasing market share and ARPU with prepaid, primarily due to stiff competition from new entrants who are aggressively targeting this segment Heightened Competition Source: Strategy Analytics , BMI 2011  In order to stay competitive, MNO may need to upgrade its OSS/BSS to reduce cost and to offer new products bundles and service plansImplications Prepaid Market Overview Competitors Monthly Prepaid vs. Postpaid ARPU CAD
  • 5.
    5 © 2012 KarthikEthirajan, all rights reserved Agenda Prepaid Market Overview  Prepaid Market in North America  Tier 1 Carriers and New Entrants Prepaid OCS Upgrade Question  Current Situation Analysis  Industry View on Convergent Charging and Ericsson Experience  OCS Upgrade: Issue & Analysis  Net Savings Analysis Framework Cost Analysis of OCS Convergence  OCS Cost Model Structure  Cumulative Cost Savings  PMO and FMO Cost Comparison  Cost Comparison of Major OCS Components  CAPEX Breakdown  Impact of Changes in Prepaid Business  Impact of Project Delay Summary of Findings  Cost Analysis Summary  Recommendation
  • 6.
    6 © 2012 KarthikEthirajan, all rights reserved Current Situation Analysis Key Questions The overall objective of the project is to determine the most cost effective way to upgrade OCS platforms to support present and future Prepaid and other business needs  Should MNO upgrade to a converged OCS or maintain two OCS platforms ?  Does the CAPEX for the impending SurePay upgrade sufficiently offset the CAPEX required for consolidating the two OCS platforms ?  What is the payback period for the initial investments from the cost efficiencies realized through a converged OCS platform ?  How does changes in Prepaid business climate impact our project cost/plans ?  What are the implications of delaying the project by one or more years ? Possible Outcomes Maintain PMO by upgrading SurePay and keeping both OCS platforms operational Option1 Transform to FMO by retiring SurePay, upgrading SAP-CC and adding SCP using Ericsson / BT Option2 Transform to FMO by retiring SurePay, upgrading SAP-CC and adding SCP using MNO IT Option3 Prepaid OCS Upgrade Question
  • 7.
    7 © 2012 KarthikEthirajan, all rights reserved Industry View on Convergent Charging Support marketing initiatives such as cross-selling and upselling of service bundles Key Findings Infonetics Global Research Report, Sep 2011 Business Drivers Supplier Selection Criteria System Integration Product reliability (most important), service and support, vendor reputation and customer references Subscriber data management, customer relationship management systems and policy management systems Prepaid OCS Upgrade Question 0% 20% 40% 60% 80% 100% Integration Effort Software development (or CR) often needed Testing Complexity of configuration Multiple platforms needed to be updated Billing Challenges CSPs Face in Meeting Time-to- Market for Launching New Products and Services Billing operations are increasingly an obstacle to responding to industry changes Key Findings How CSP can Transform Telecom Billing Operations to Support a New Convergent, Digital Business Business Drivers Transforming billing capabilities is key to the success of CSP’s new business strategies OCS upgrade requires careful cost/benefit analysis, detailed project plan and implementation by an experienced provider
  • 8.
    8 © 2012 KarthikEthirajan, all rights reserved OCS Upgrade: Issue & Analysis • Call control • Rating OCS Platform SurePay SAP-CC Vendor Market Prepaid Prepaid Network Support CDMA: Voice, Data HSPA: Voice CDMA: SMS HSPA: Data, SMS Client Satisfaction Low TBD Revenue Opportunity Supports legacy revenue streams only Enables new revenue streams Operating two OCS platforms is NOT cost effective Issue Analysis Technical Analysis Business Case • Solutions Architecture Recommendations • Solution Integration Impacts • Data Migration Impacts • Operations Impacts • Managed services • Develop an operational model to quantify cost savings • Estimate CAPEX requirements • Prepaid market research • Estimate incremental revenue from new voice and data bundles • Subscriber charging & billing Explore converging OCS to a single platform Prepaid OCS Upgrade Question
  • 9.
    9 © 2012 KarthikEthirajan, all rights reserved Net Savings Analysis Framework SurePay + SAP-CC CAPEX SAP-CC 0 OPEX Operational Cost Savings Incremental CAPEX Net Savings Cost savings from upgrading to SAP-CC OCS is the net of operational cost savings from a converged OCS platform with initial incremental CAPEX requirement • SurePay is a legacy OCS that has a higher operating cost • However, SurePay needs to be upgrade in the near term • SAP-CC is a new converged OCS with a lower operating cost • However, retiring SurePay requires high CAPEX 0 Fixed Cost Variable Cost Platform Growth & Sustainment Variable Cost Fixed Cost Platform Growth & Sustainment PMO FMO Prepaid OCS Upgrade Question
  • 10.
    10 © 2012 KarthikEthirajan, all rights reserved Agenda Prepaid Market Overview  Prepaid Market in North America  Tier 1 Carriers and New Entrants Prepaid OCS Upgrade Question  Current Situation Analysis  Industry View on Convergent Charging and Ericsson Experience  OCS Upgrade: Issue & Analysis  Net Savings Analysis Framework Cost Analysis of OCS Convergence  OCS Cost Model Structure  Cumulative Cost Savings  PMO and FMO Cost Comparison  Cost Comparison of Major OCS Components  CAPEX Breakdown  Impact of Changes in Prepaid Business  Impact of Project Delay Summary of Findings  Cost Analysis Summary  Recommendation
  • 11.
    11 © 2012 KarthikEthirajan, all rights reserved OCS Cost Model Structure Model Inputs General Notes / Model Assumptions Model Outputs Present Mode of Operation (PMO) • Both SurePay and SAP-CC OCS are operational • SurePay handles voice • SAP-CC handles HSPA data and SMS • SurePay needs upgrade Future Mode of Operation (FMO) • PMO OCS platforms converges to SAP-CC and SCP • SAP-CC handles voice, data and SMS • SurePay is retired NPV Analysis – Net cost savings after 1 year / 3 year / 5 years Cost Analysis – PMO vs. FMO costs – CAPEX breakdown – Compare OCS platforms OCS COST (2012-18) • Fixed Costs • Data Center • Personnel • Variable Costs • Utilities • Data Storage • Hardware AMC • Software AMC • Care • CAPEX • Platform • Growth & Sustainment PMO – SAP-CC PMO – SurePay PMO – Transformation FMO – SAP-CC FMO – SCP FMO – Transformation Prepaid Subs (2012-18) • CDMA subs • UMTS subs Breakeven Analysis – Cumulative cost savings of PMO vs. FMO Sensitivity Analysis – Prepaid growth – Delaying FMO OCS Cost Model
  • 12.
    12 © 2012 KarthikEthirajan, all rights reserved Cumulative Cost Savings Cost Analysis of OCS Convergence -$12 -$10 -$8 -$6 -$4 -$2 $0 $2 2H12 2013 2014 2015 2016 2017 2018 2019 Higher initial CAPEX resulted in a negative NPV. However, YoY cost savings from OPEX improved NPV and cost breakeven is achieved during 2Q 2019 -$8 -$7 -$6 -$5 -$4 -$3 -$2 -$1 $0 NPV Cost Savings • The initial CAPEX is offset by OPEX savings YoY • Cost breakeven is achieved during 2Q 2019 • Large CAPEX resulted in negative NPV during the initial years • 5 Year NPV is -$2.7 million Cumulative Cost Savings 1 Yr NPV 3 Yr NPV 5 Yr NPV Breakeven Point ($ millions)($ millions)
  • 13.
    13 © 2012 KarthikEthirajan, all rights reserved PMO and FMO Cost Comparison Cost Analysis of OCS Convergence The CAPEX delta between PMO and FMO peaked at $7.2 million in 2012 and OPEX delta is $1.79 million per year after the transformation OPEX Cost Comparison • FMO costs are higher initially due to large CAPEX compared to PMO • FMO costs are lower than PMO in the subsequent years of operation • FMO OPEX costs for SAP-CC is close to PMO levels even after taking on new functionalities • SurePay of PMO has the highest OPEX • SCP of FMO has the lowest OPEX PMO vs. FMO Costs 1 Yr NPV 3 Yr NPV 5 Yr NPV $0.00 $0.50 $1.00 $1.50 $2.00 $2.50 $3.00 $3.50 $4.00 SAP-CC SurePay / SCP Total PMO Opex FMO Opex -$16 -$14 -$12 -$10 -$8 -$6 -$4 -$2 $0 2H12 2013 2014 2015 2016 2017 2018 PMO Costs FMO Costs ($ millions) ($ millions) $1.79M YoY OPEX Savings $7.2M Peak CAPEX
  • 14.
    14 © 2012 KarthikEthirajan, all rights reserved Cost Comparison of Major OCS Components Cost Analysis of OCS Convergence Costs of SurePay (PMO), SAP-CC (PMO & FMO) and SCP (FMO) are compared below Cost Categorization • SCP carries the lowest Fixed Cost of all components • SurePay operational costs are bundled as the maintenance cost essentially charging no additional license fees • SAP-CC and SCP operational costs are split between low annual maintenance costs and moderate license costs • SurePay upgrade (PMO transformation) and SurePay retirement / SAP-CC upgrade (FMO transformation) requires high investment • Fixed Cost includes development and operational personnel • Variable Cost includes maintenance costs • License Cost includes licensing for capacity expansion and feature enhancements • Transformation Cost includes system integration cost SAP-CC, SurePay, SCP Cost Comparison $0 $5,000,000 $10,000,000 $15,000,000 Fixed Costs Variable Cossts License Costs Transformation Costs SCP SurePay SAP-CC Key Differences CAPEX
  • 15.
    15 © 2012 KarthikEthirajan, all rights reserved CAPEX Breakdown Cost Analysis of OCS Convergence Total CAPEX spend for FMO is more than twice that of PMO. Platform and G&S CAPEX for FMO exceeds PMO by $5.60 million and $4.56 million respectively FMO CAPEX • PMO CAPEX is spread over 3 years • Total CAPEX spend in PMO is $6.87 million • Platform CAPEX is 21% of Total CAPEX • G&S CAPEX is 79% of Total CAPEX • FMO CAPEX is spread over 3 years • Total CAPEX spend in PMO is $17.04 million • Platform CAPEX is 41% of Total CAPEX • G&S CAPEX is 59% of Total CAPEX PMO CAPEX ($ millions) ($ millions) $0 $2 $4 $6 $8 $10 $12 $14 $16 $18 2012 2013 2014 Total Growth & Sustainment Platform $0 $2 $4 $6 $8 $10 $12 $14 $16 $18 2012 2013 2014 Total
  • 16.
    16 © 2012 KarthikEthirajan, all rights reserved Impact of Changes in Prepaid Business Cost Analysis of OCS Convergence Growth in Prepaid business has an incremental effect on overall costs. Decline in Prepaid has no effect on cost. Key Insights • FMO OPEX is twice as sensitive as PMO OPEX to Prepaid growth  PMO OPEX cost increased by 7% and 13% when Prepaid growth was 10% and 20% respectively  FMO OPEX cost increased by 14% and 28% when Prepaid growth was 10% and 20% respectively • NPV Cost Savings (difference between PMO and FMO costs) is much less sensitive to Prepaid growth  PMO OPEX cost increased by 7% and 13% when Prepaid growth was 10% and 20% respectively • Decline in Prepaid has no effect on PMO or FMO OPEX and NPV Cost Savings  Costs built in based on peak subscriber demand stays permanently Prepaid Growth Sensitivity on Costs ($4) ($3) ($2) ($1) $0 $1 $2 $3 $4 $5 NPV Cost Savings PMO Opex FMO Opex 20% Prepaid Growth 10% Prepaid Growth 0% Prepaid Growth -10% Prepaid Growth -20% Prepaid Growth ($ millions)
  • 17.
    17 © 2012 KarthikEthirajan, all rights reserved Impact of Project Delay Cost Analysis of OCS Convergence Any delay in implementation of FMO will reduce the cost benefits and increase the time to achieve breakeven. Analysis assumes that no PMO transformation costs are incurred because of the delay. 5-Yr NPV Cost Savings • If FMO is delayed by 1 year, cost breakeven period moves by 1.3 years • If FMO is delayed by 3 years, cost breakeven period moves by 3.3 years • If FMO is delayed by 1 year, 5-yr NPV Cost Savings is reduced by $0.8 million • If FMO is delayed by 3 years, 5-yr NPV Cost Savings is reduced by $2.9 million Cumulative Cost Savings ($ millions) ($ millions) -$12 -$10 -$8 -$6 -$4 -$2 $0 $2 $4 $6 $8 2H12 2013 2014 2015 2016 2017 2018 2019 2020 2021 2022 FMO No Delay FMO 1 Year Delay FMO 3 Year Delay -$6 -$5 -$4 -$3 -$2 -$1 $0 No Delay 1 Yr Delay 3 Yr Delay Breakeven Point 1.3 Yrs 3.3 Yrs $0.8M $2.1M
  • 18.
    18 © 2012 KarthikEthirajan, all rights reserved -$12 -$10 -$8 -$6 -$4 -$2 $0 Impact of Project Delay Cost Analysis of OCS Convergence Any delay in implementation of FMO will reduce the cost benefits and increase the time to achieve breakeven. Analysis assumes that both FMO and PMO transformation costs are incurred because of the delay. 5-Yr NPV Cost Savings • If FMO is delayed by even 1 year, cost breakeven will not be achieved for over 10 years • If FMO is delayed by 1 year, 5-yr NPV Cost Savings is reduced by $4.9 million • If FMO is delayed by 3 years, 5-yr NPV Cost Savings is reduced by $7 million Cumulative Cost Savings ($ millions) ($ millions) No Delay 1 Yr Delay 3 Yr Delay$4.9M $2.1M -20 -15 -10 -5 0 5 10 2H12 2013 2014 2015 2016 2017 2018 2019 2020 2021 2022 FMO No Delay FMO 1 Year Delay FMO 3 Year Delay Breakeven Point
  • 19.
    19 © 2012 KarthikEthirajan, all rights reserved Agenda Prepaid Market Overview  Prepaid Market in North America  Tier 1 Carriers and New Entrants Prepaid OCS Upgrade Question  Current Situation Analysis  Industry View on Convergent Charging and Ericsson Experience  OCS Upgrade: Issue & Analysis  Net Savings Analysis Framework Cost Analysis of OCS Convergence  OCS Cost Model Structure  Cumulative Cost Savings  PMO and FMO Cost Comparison  Cost Comparison of Major OCS Components  CAPEX Breakdown  Impact of Changes in Prepaid Business  Impact of Project Delay Summary of Findings  Cost Analysis Summary  Recommendation
  • 20.
    20 © 2012 KarthikEthirajan, all rights reserved OCS Platform Cost Analysis Summary Summary of Findings  Implementation of FMO will result in a 5 year NPV of -$2.7 million  Cost breakeven will be achieved in 2Q 2019 following FMO transformation  Total CAPEX spend for FMO is more than twice that of PMO. CAPEX delta is $10.17 million. CAPEX spend is spread over 3 years.  FMO operation will result in a cost saving of $1.79M each year after transformation compared to PMO operational costs  SurePay has high annual cost ($1.6M AMC) and it includes license cost for Prepaid subscribers  SAP-CC and SCP has lower annual cost ($1.1M AMC) but charge a license fee for capacity  Growth in Prepaid business has an incremental effect on overall costs. Decline in Prepaid has no effect on cost as once costs are built in (based on peak subs) it cannot be taken out  Any delay in implementation of FMO will reduce the cost benefits and increase the time to achieve breakeven Baseline Assumptions • All costs are adjusted to a PV of June 30, 2012 • 2012 costs are accounted for the 2nd half of the year only where applicable • PMO and FMO transformation is expected to take 18 months • No project delay means the transformation will be complete by end of 2013 • Prepaid market forecasts a decline of 10% in subscriber growth • Some costs (e.g., customer care) that are not expected to change between PMO and FMO are not accounted for Model Risks Model output is sensitive to a few inputs that are being refined. They are: • Personnel cost data • BT cost for SurePay retirement • Ericsson SI cost
  • 21.
    21 © 2012 KarthikEthirajan, all rights reserved Recommendation Summary of Findings  Initiate FMO as the first step towards realizing a converged OCS platform across MNO business groups  Choose <XYZ> based on pricing, initiative and industry standing Recommended Approach Option 1: Keep PMO “Status Quo” Option 2: FMO with Ericsson “OCS on Steroids” Option 3: FMO with BT “OCS D-I-Y” Pros Cons • CAPEX is lower than that of FMO transformation • Prepaid may not be a growth market • No scope for adding service bundles or other new products • SurePay still requires upgrade • High OPEX cost • Upkeep and maintenance of two OCS platforms • SAP-CC/SCP is a flexible OCS platform that can handle new Prepaid and other products • OPEX cost savings of $1.79M/Year • High CAPEX, exceeds PMO by $10.17 million • Limited experience working with Ericsson • Same benefits as Option 2 • Higher cost than Option 2 CAPEX: $17.04 million OPEX: $1.78 million NPV: -$2.7 million CAPEX: $6.87 million OPEX: $3.57 million NPV: N/A CAPEX: $22.04 million OPEX: $1.78 million NPV: -$7.1 million Strategic Alignment