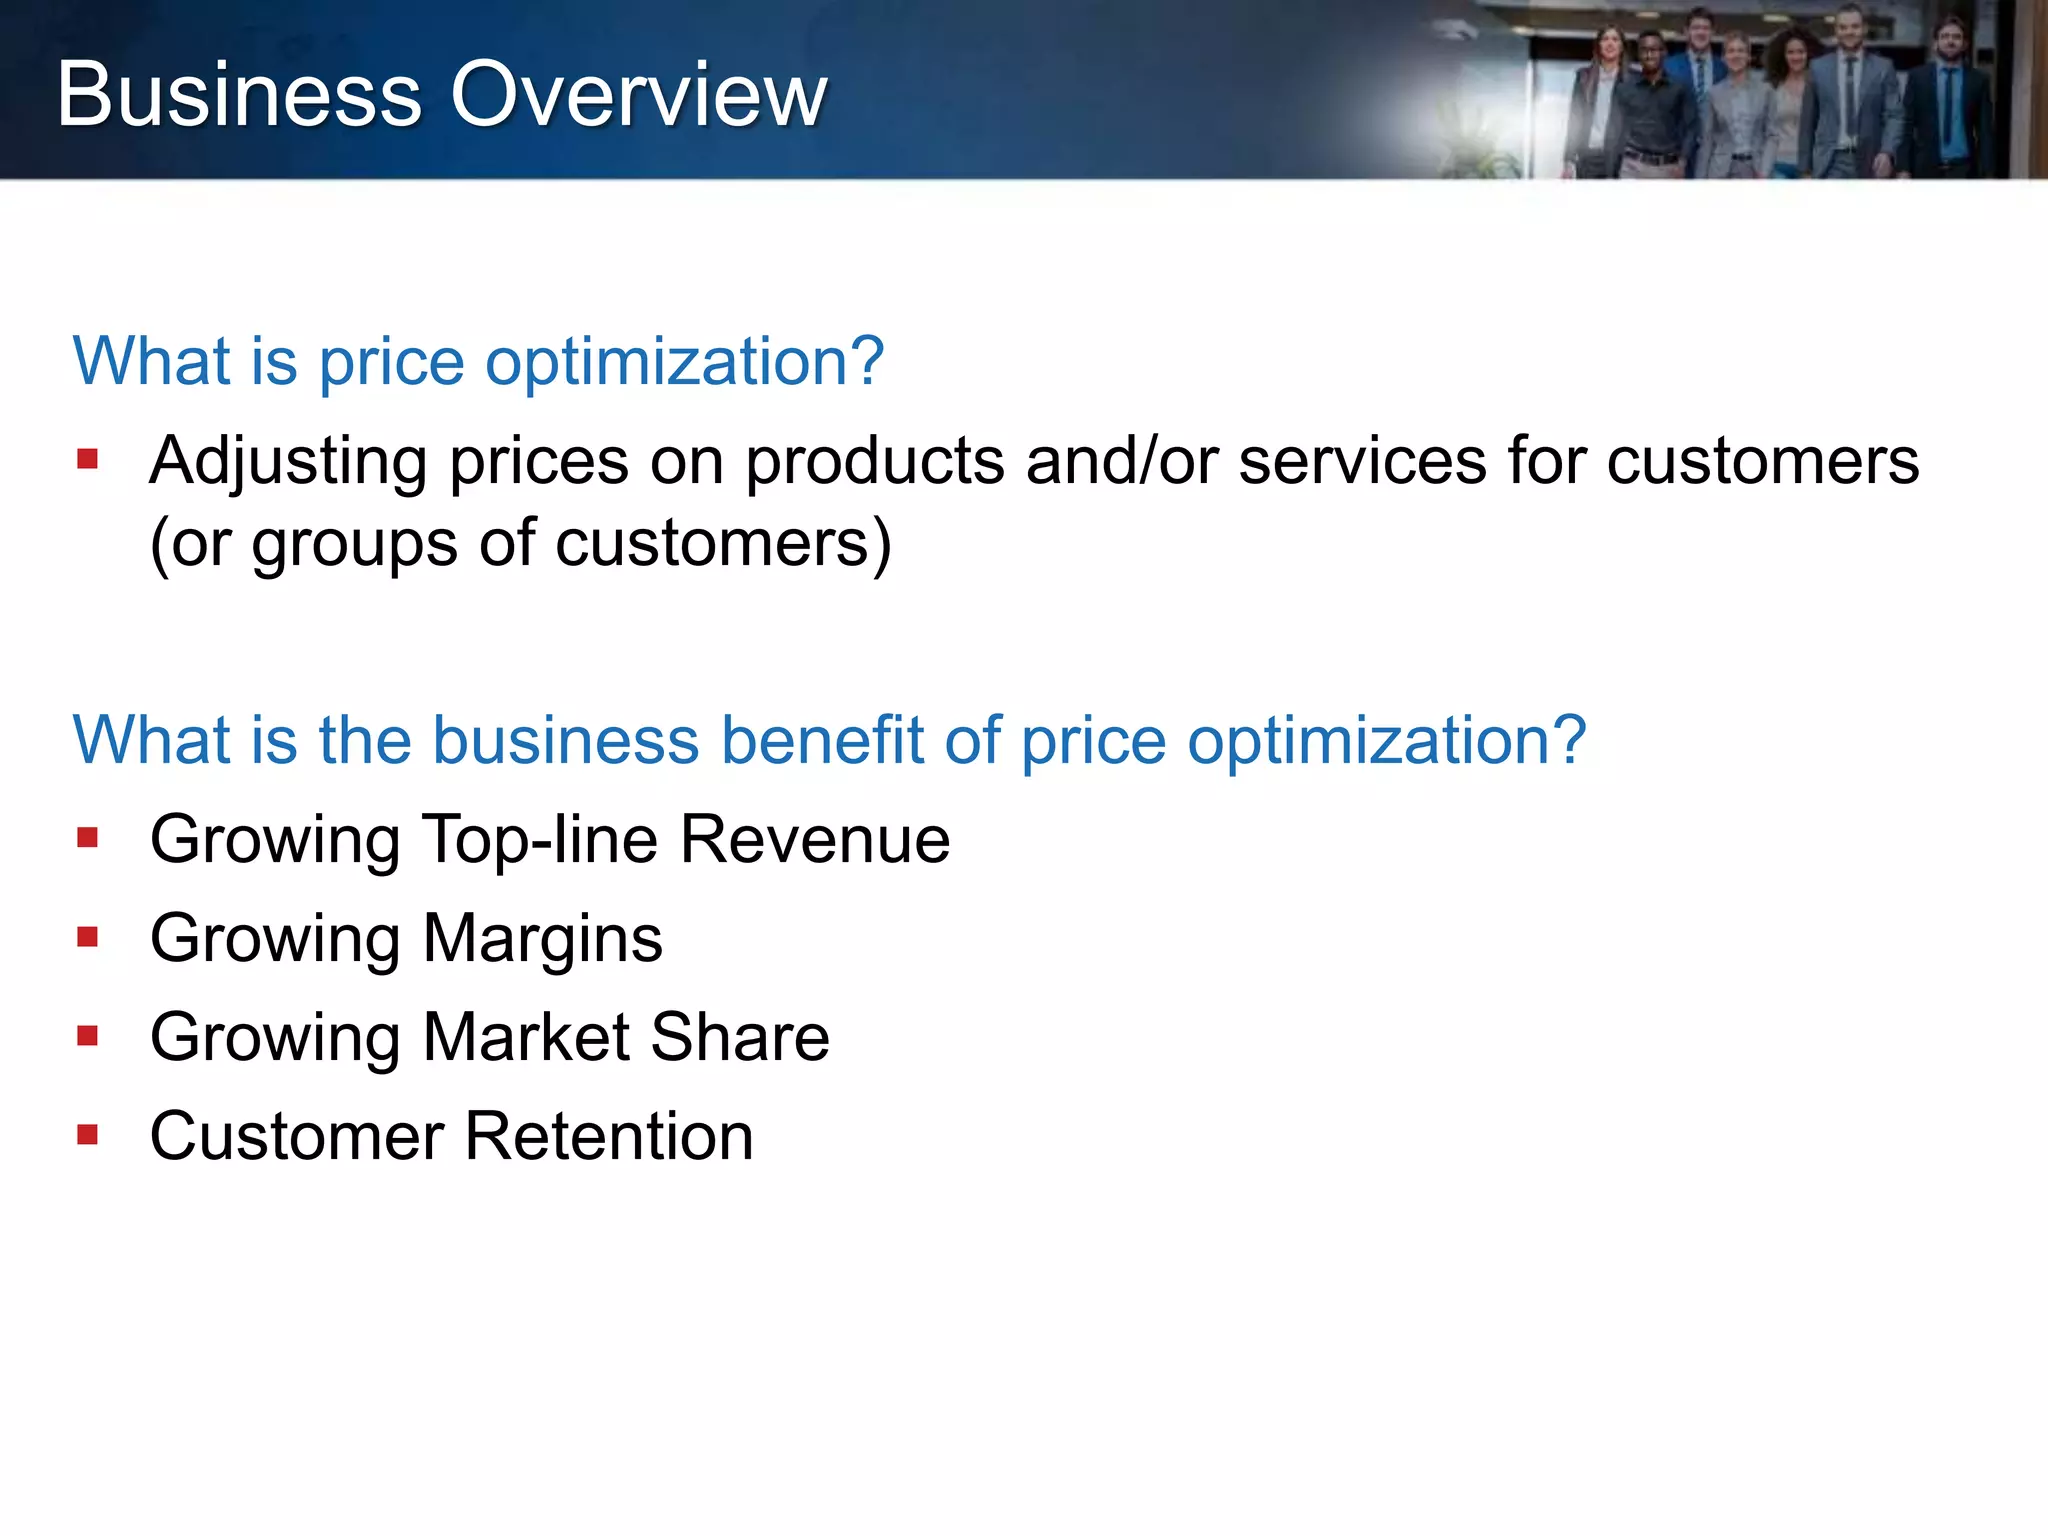
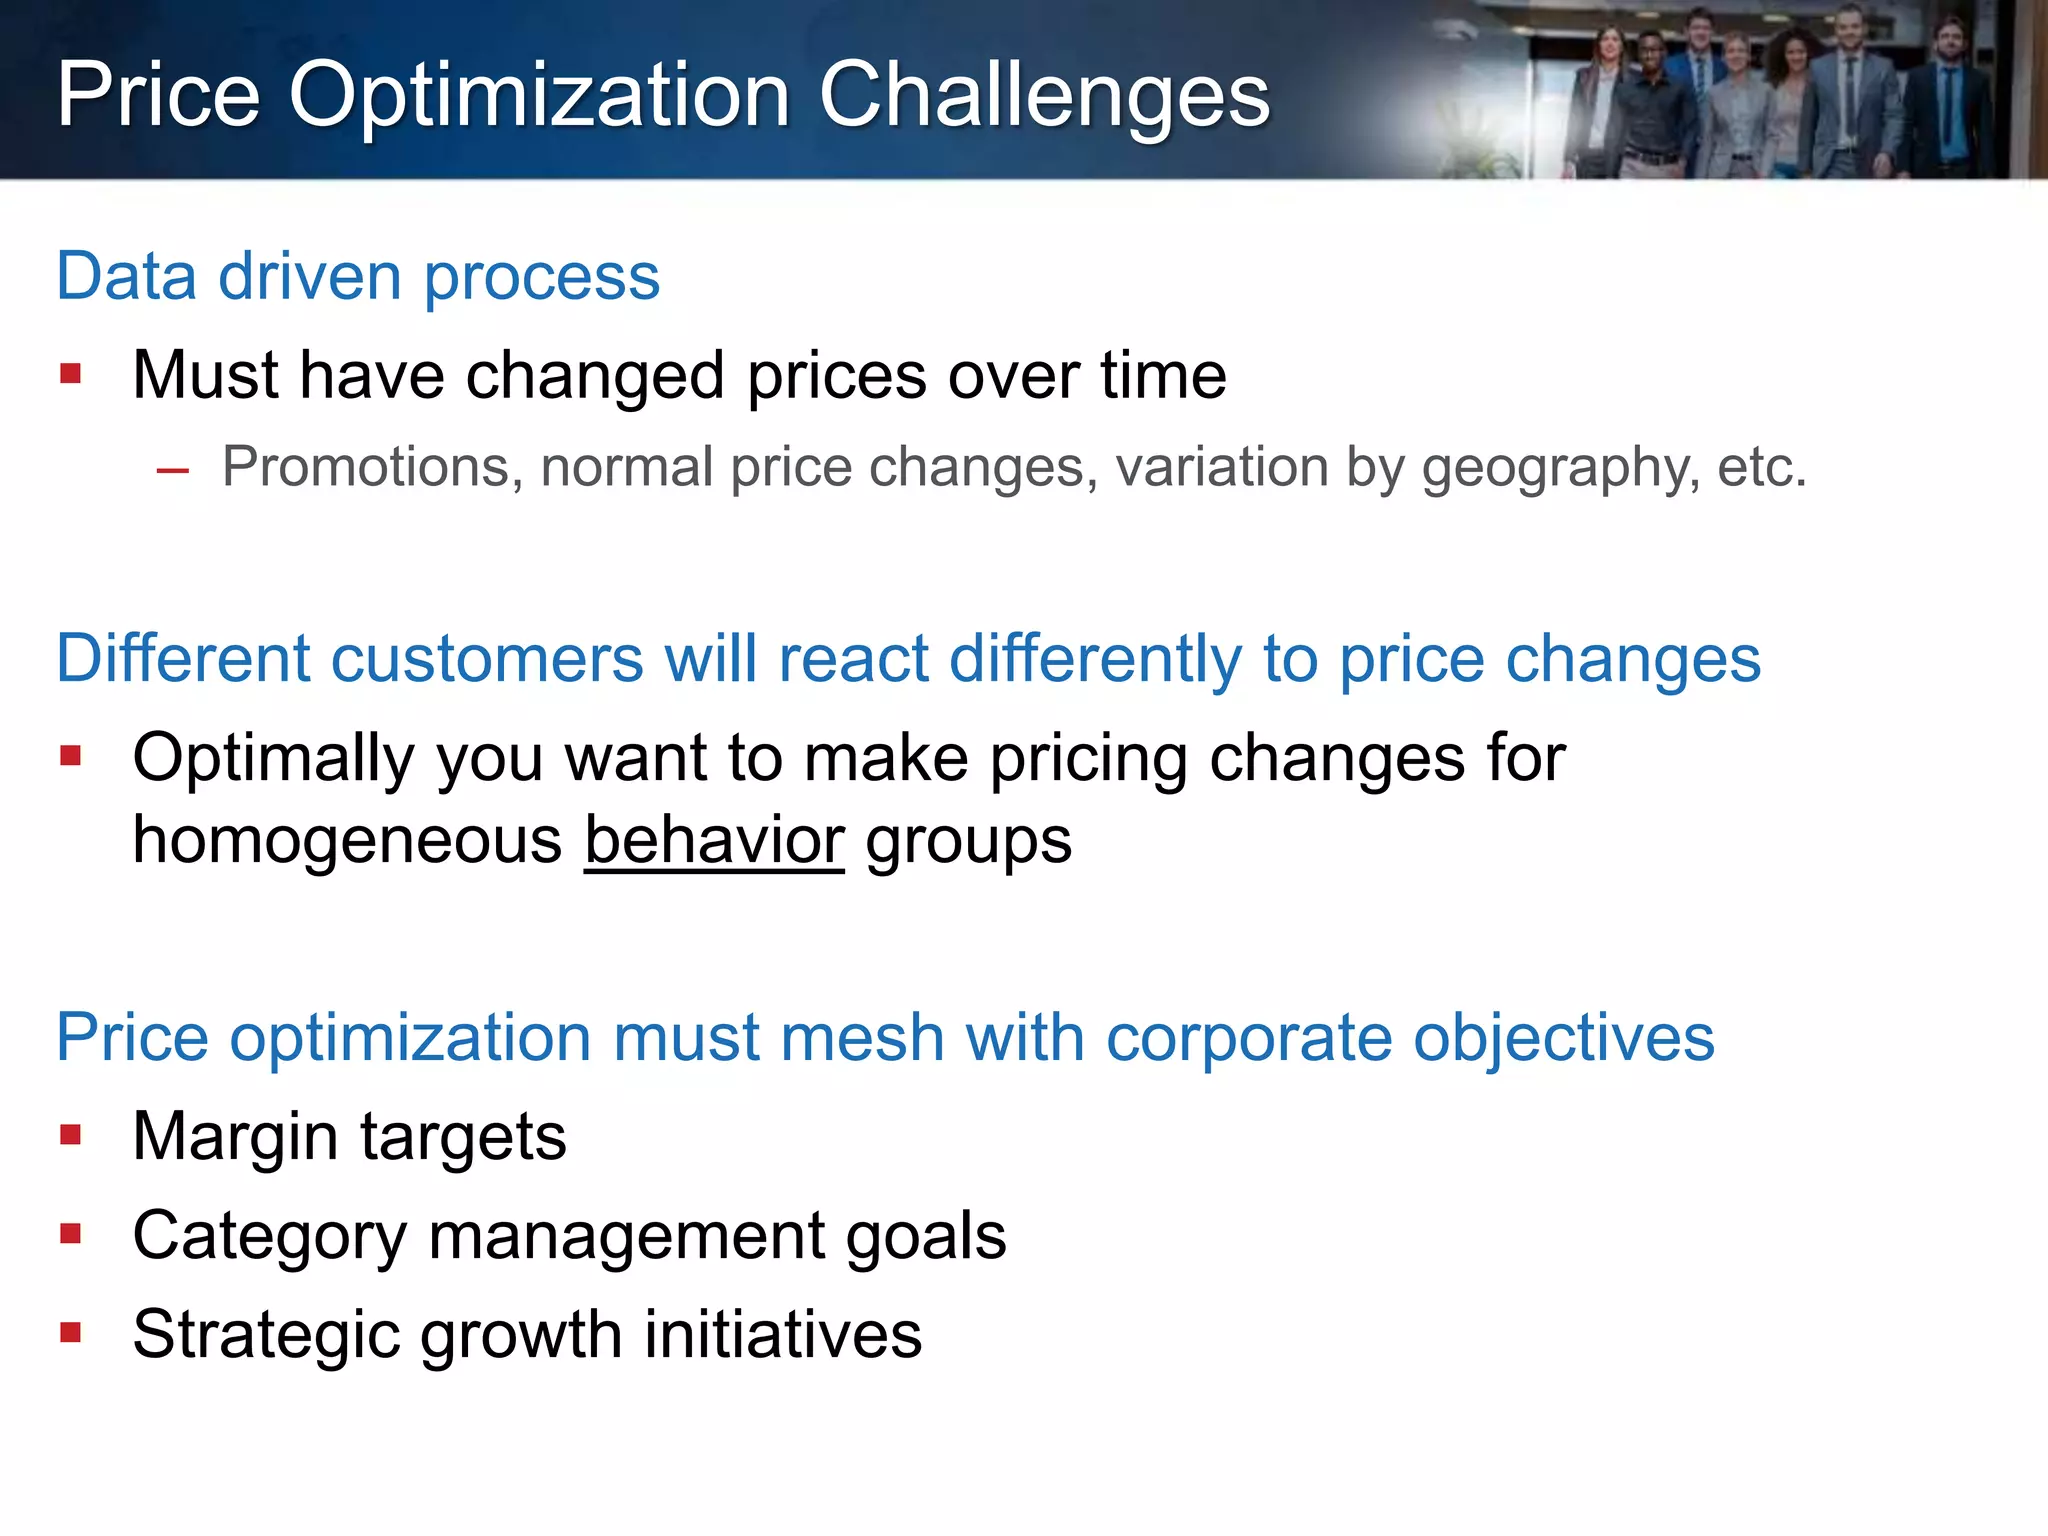
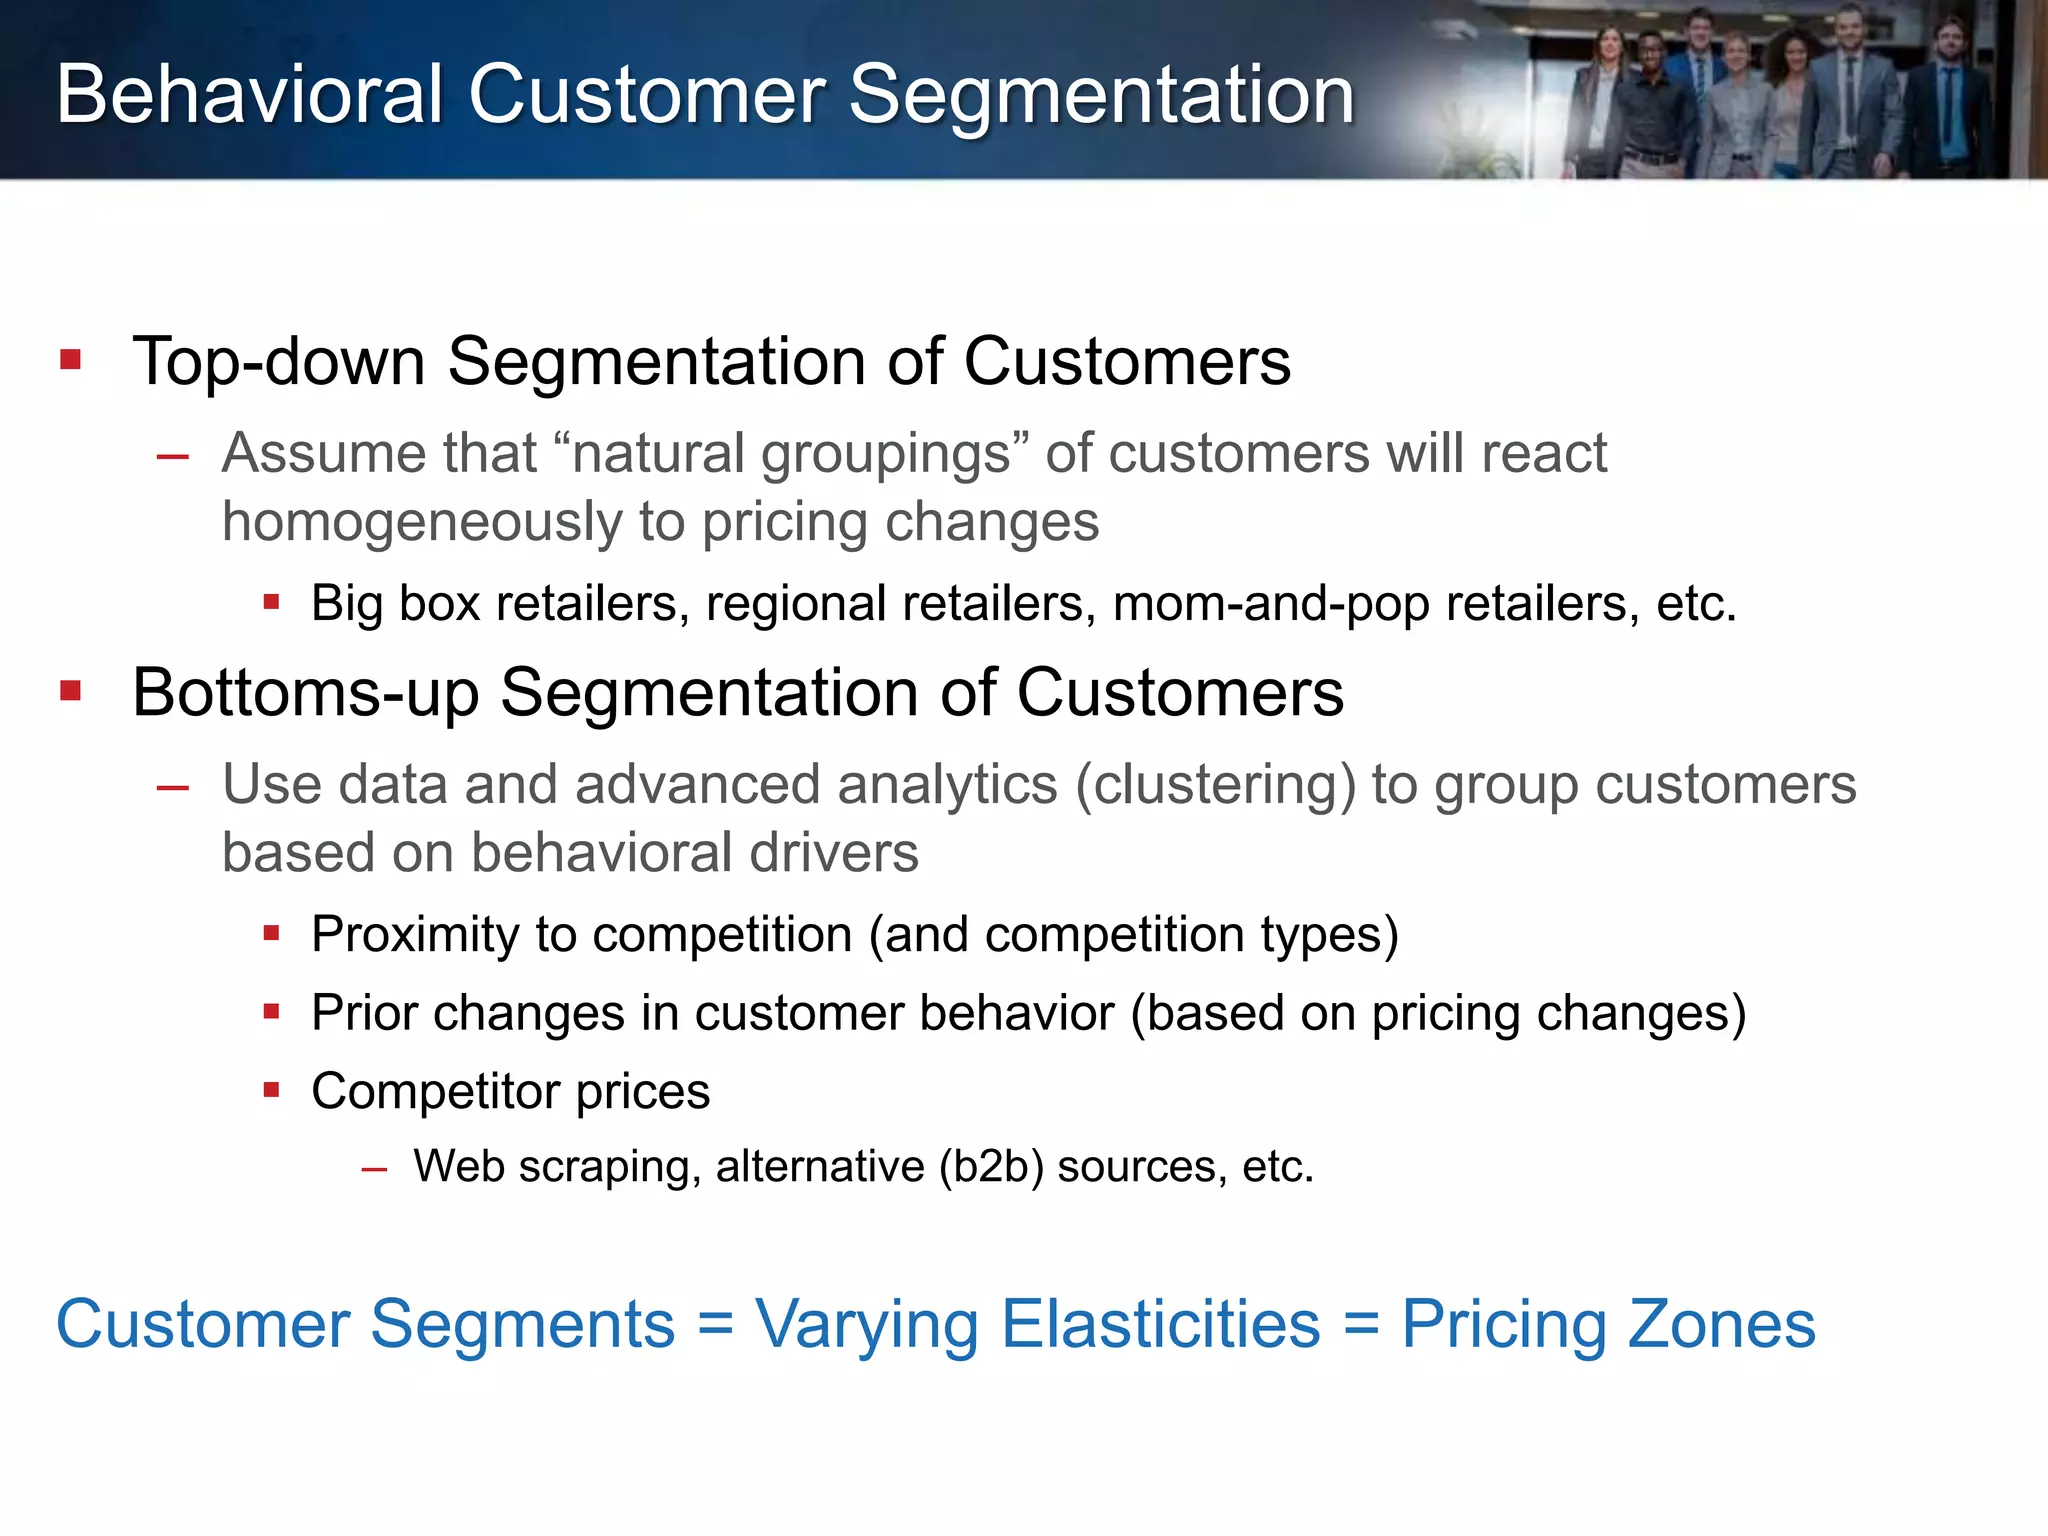
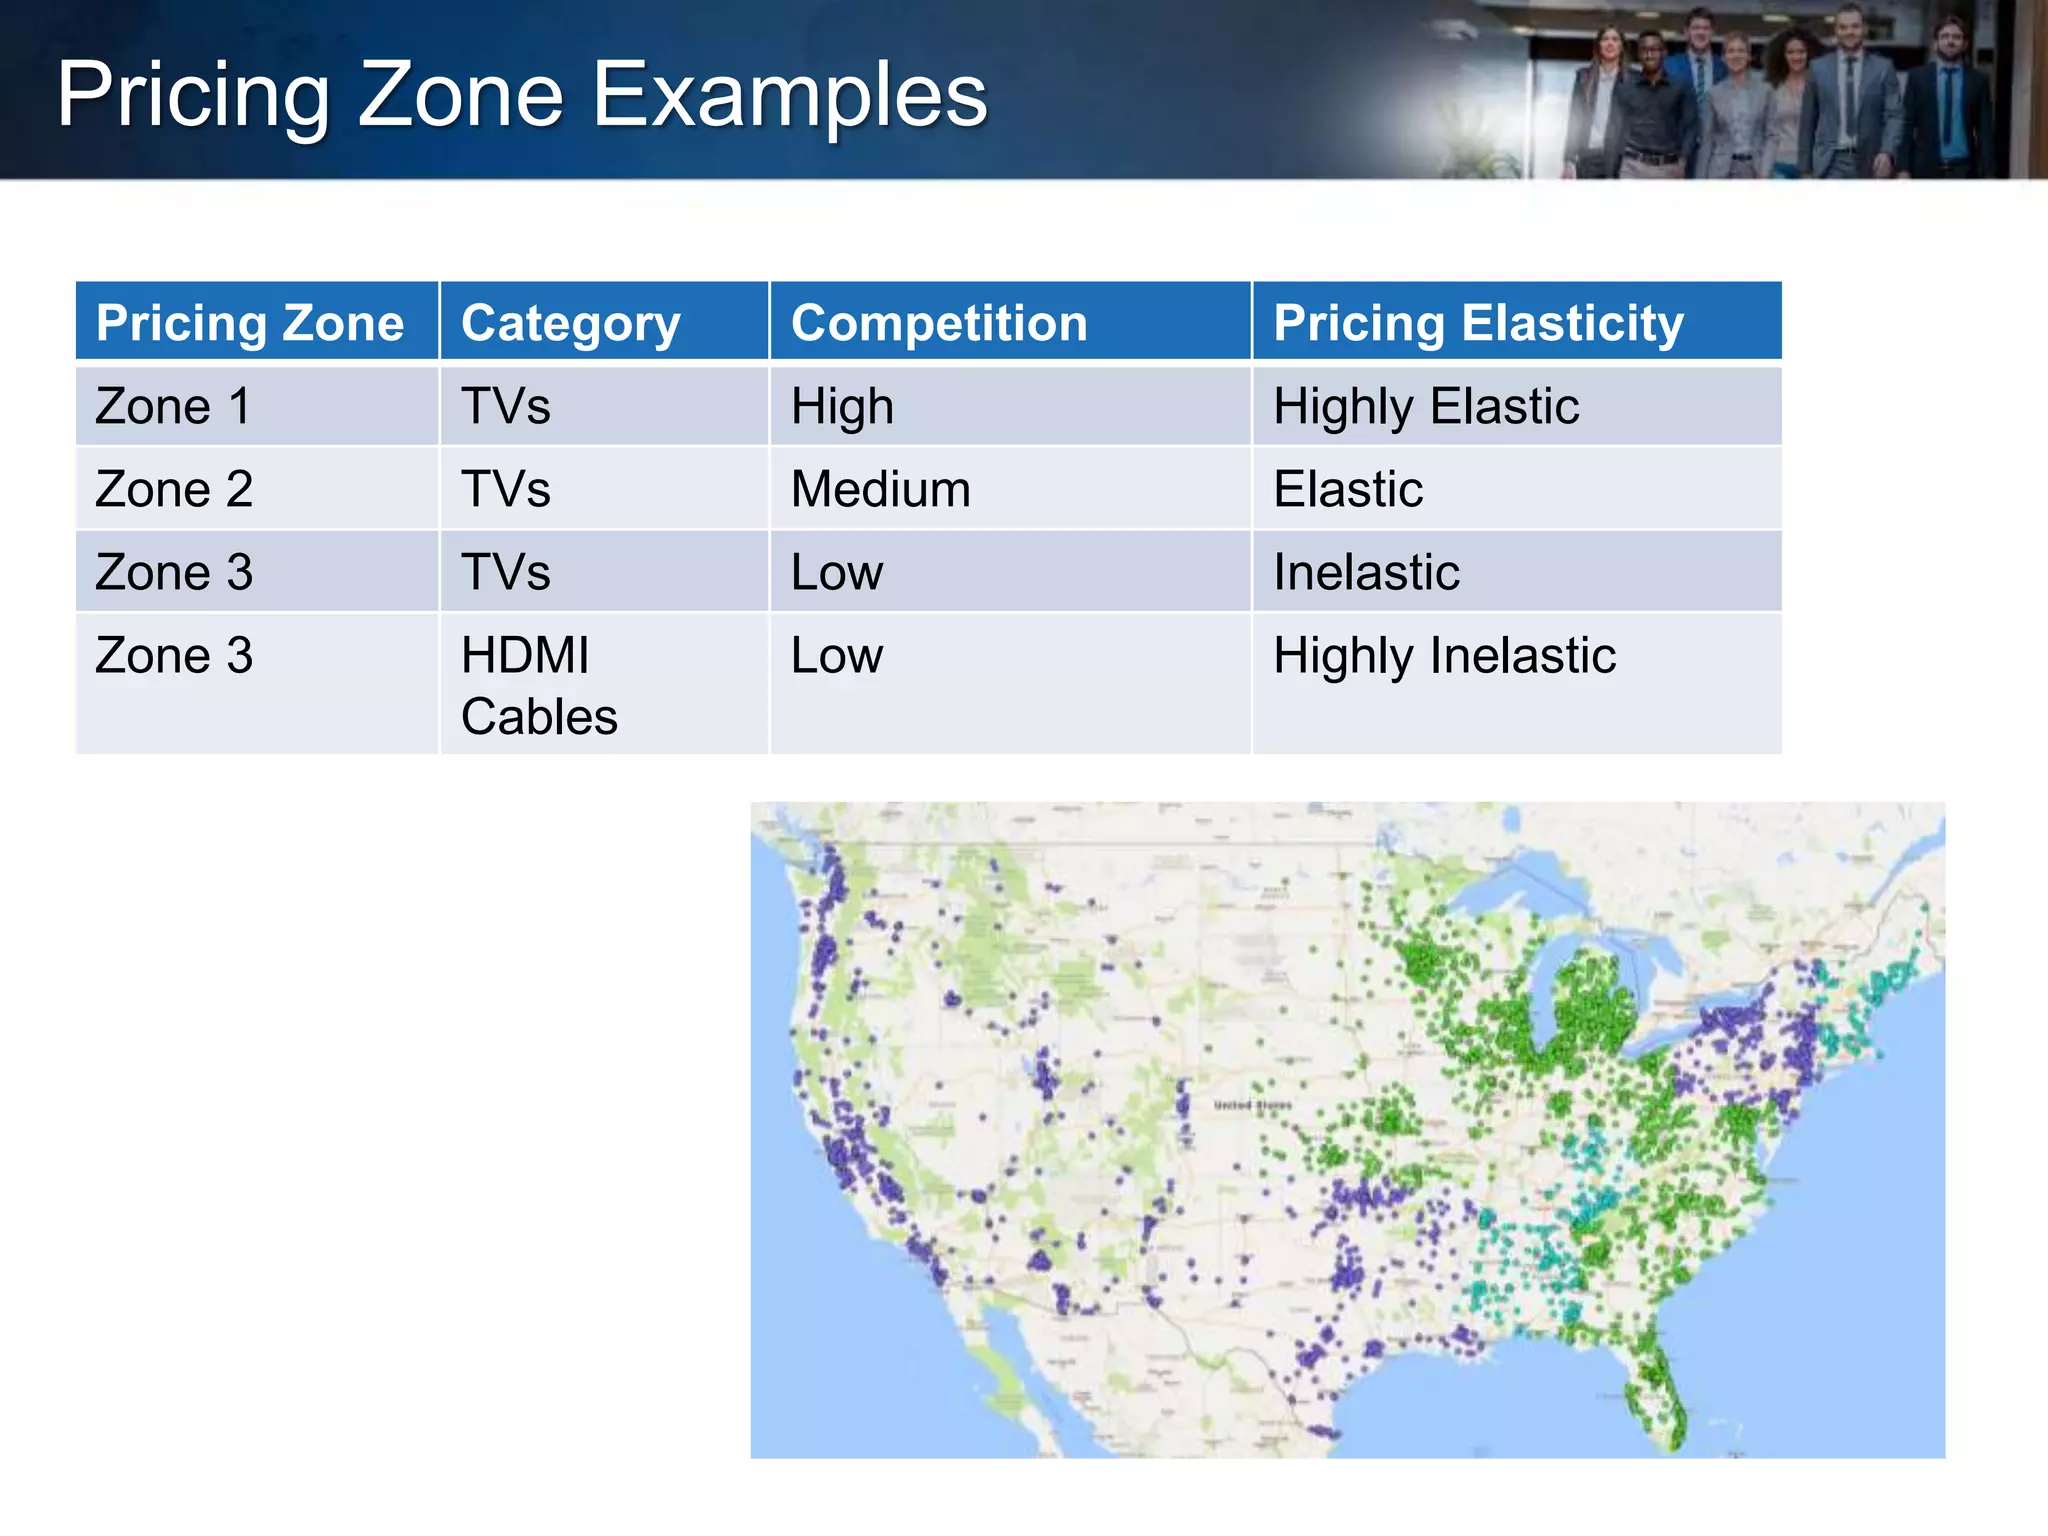
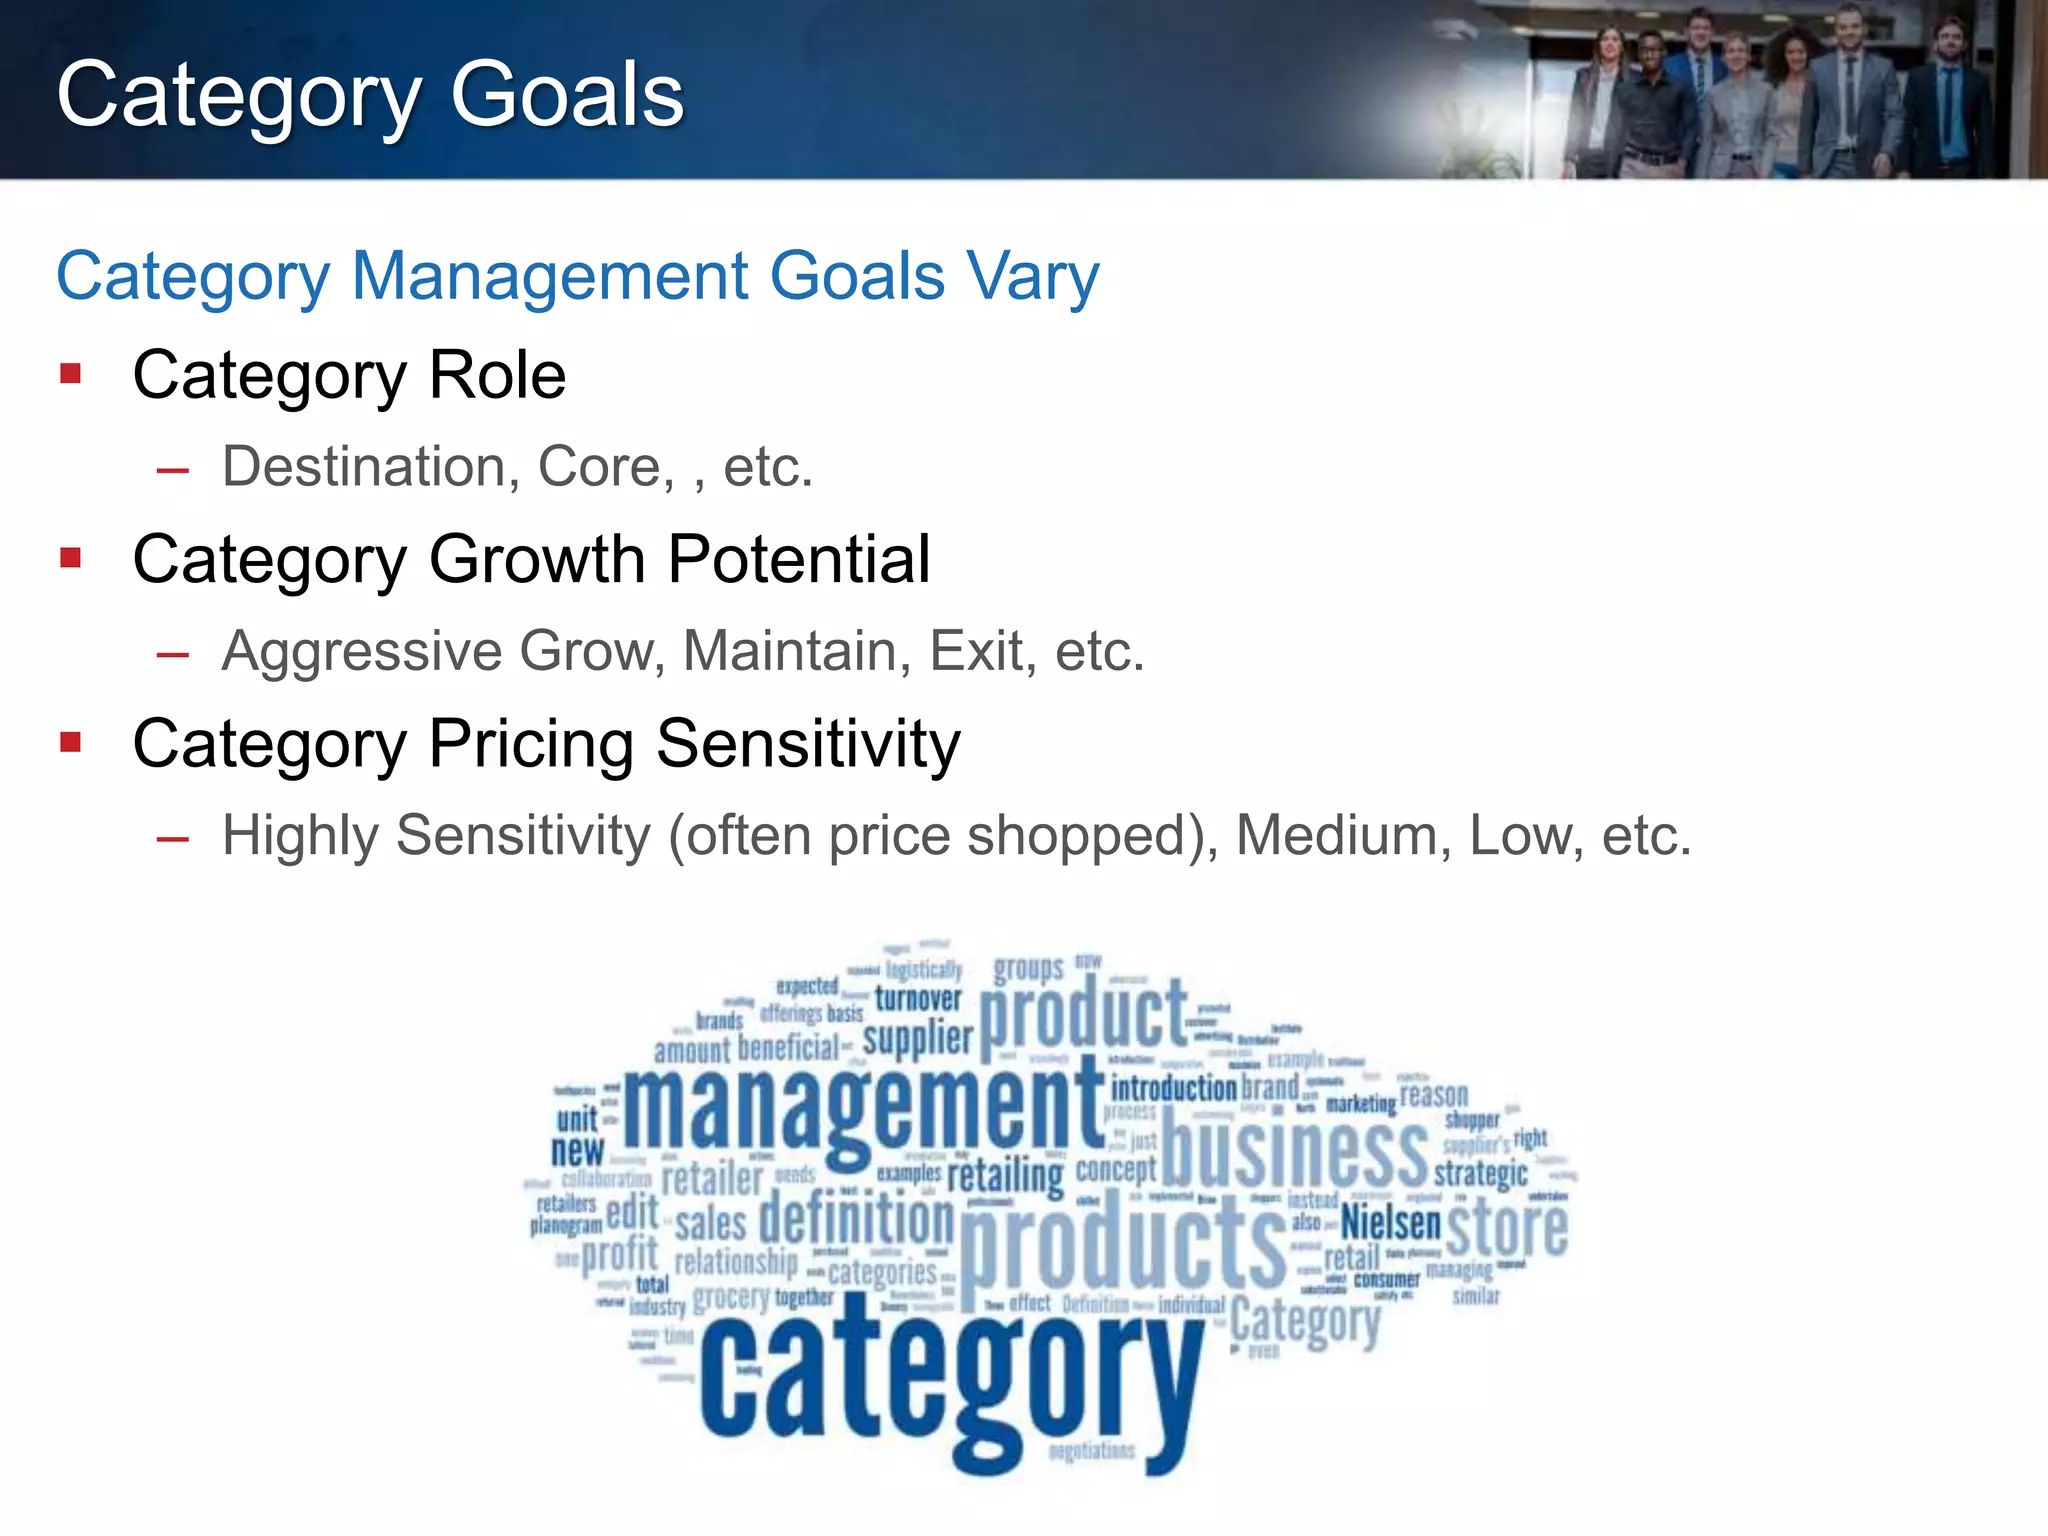
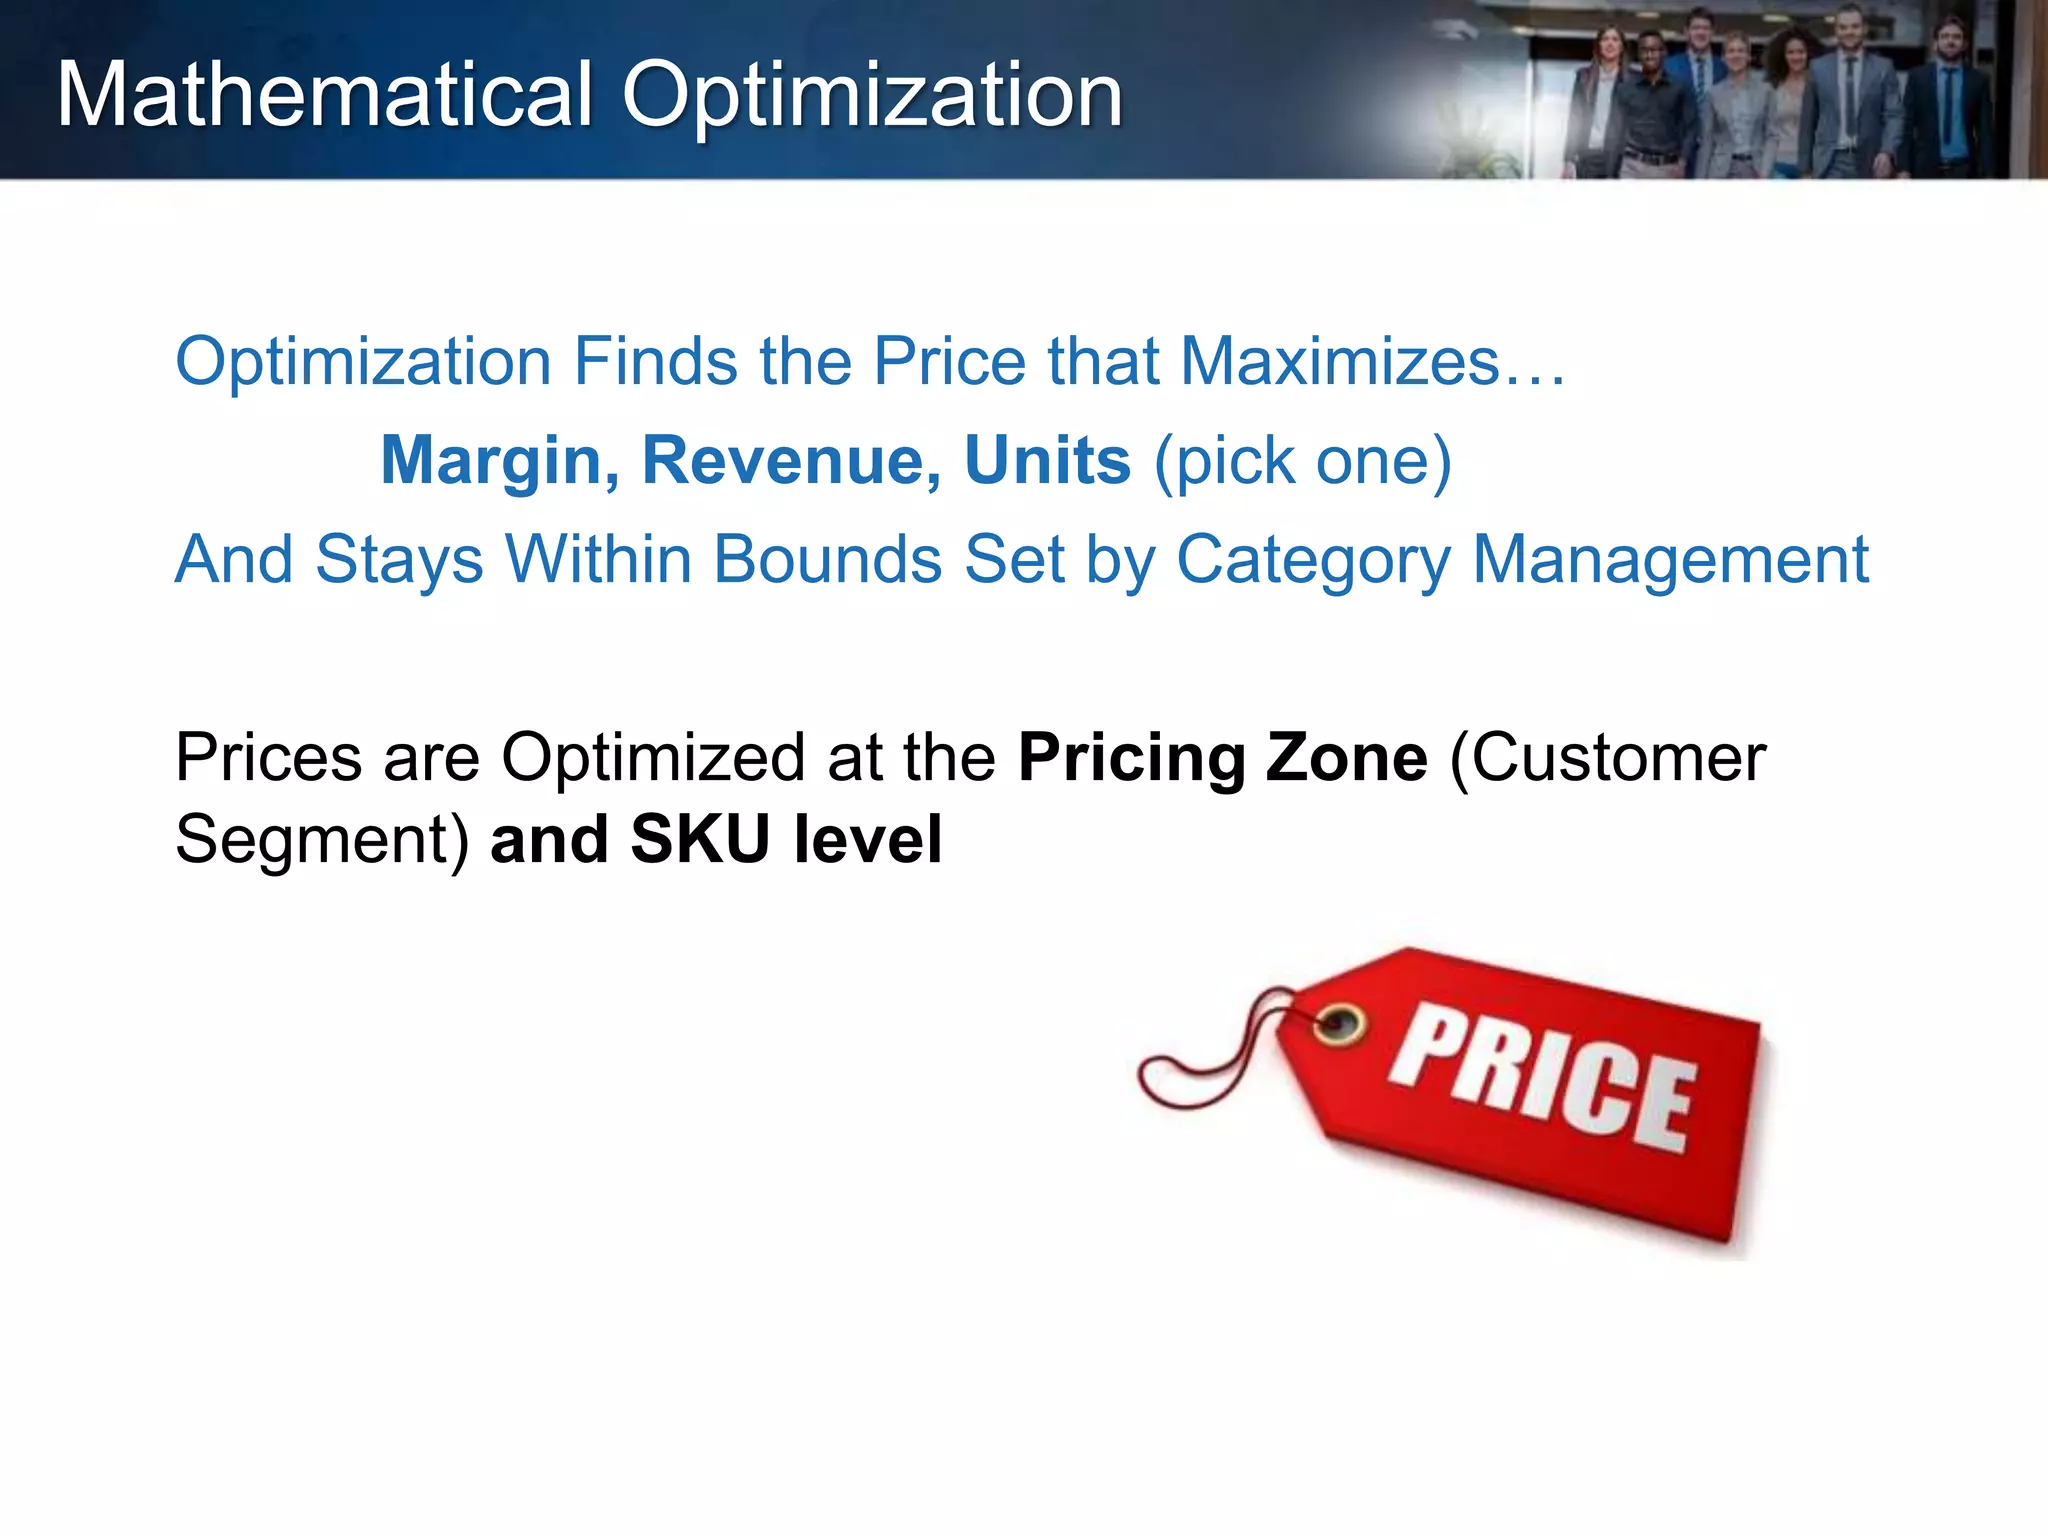
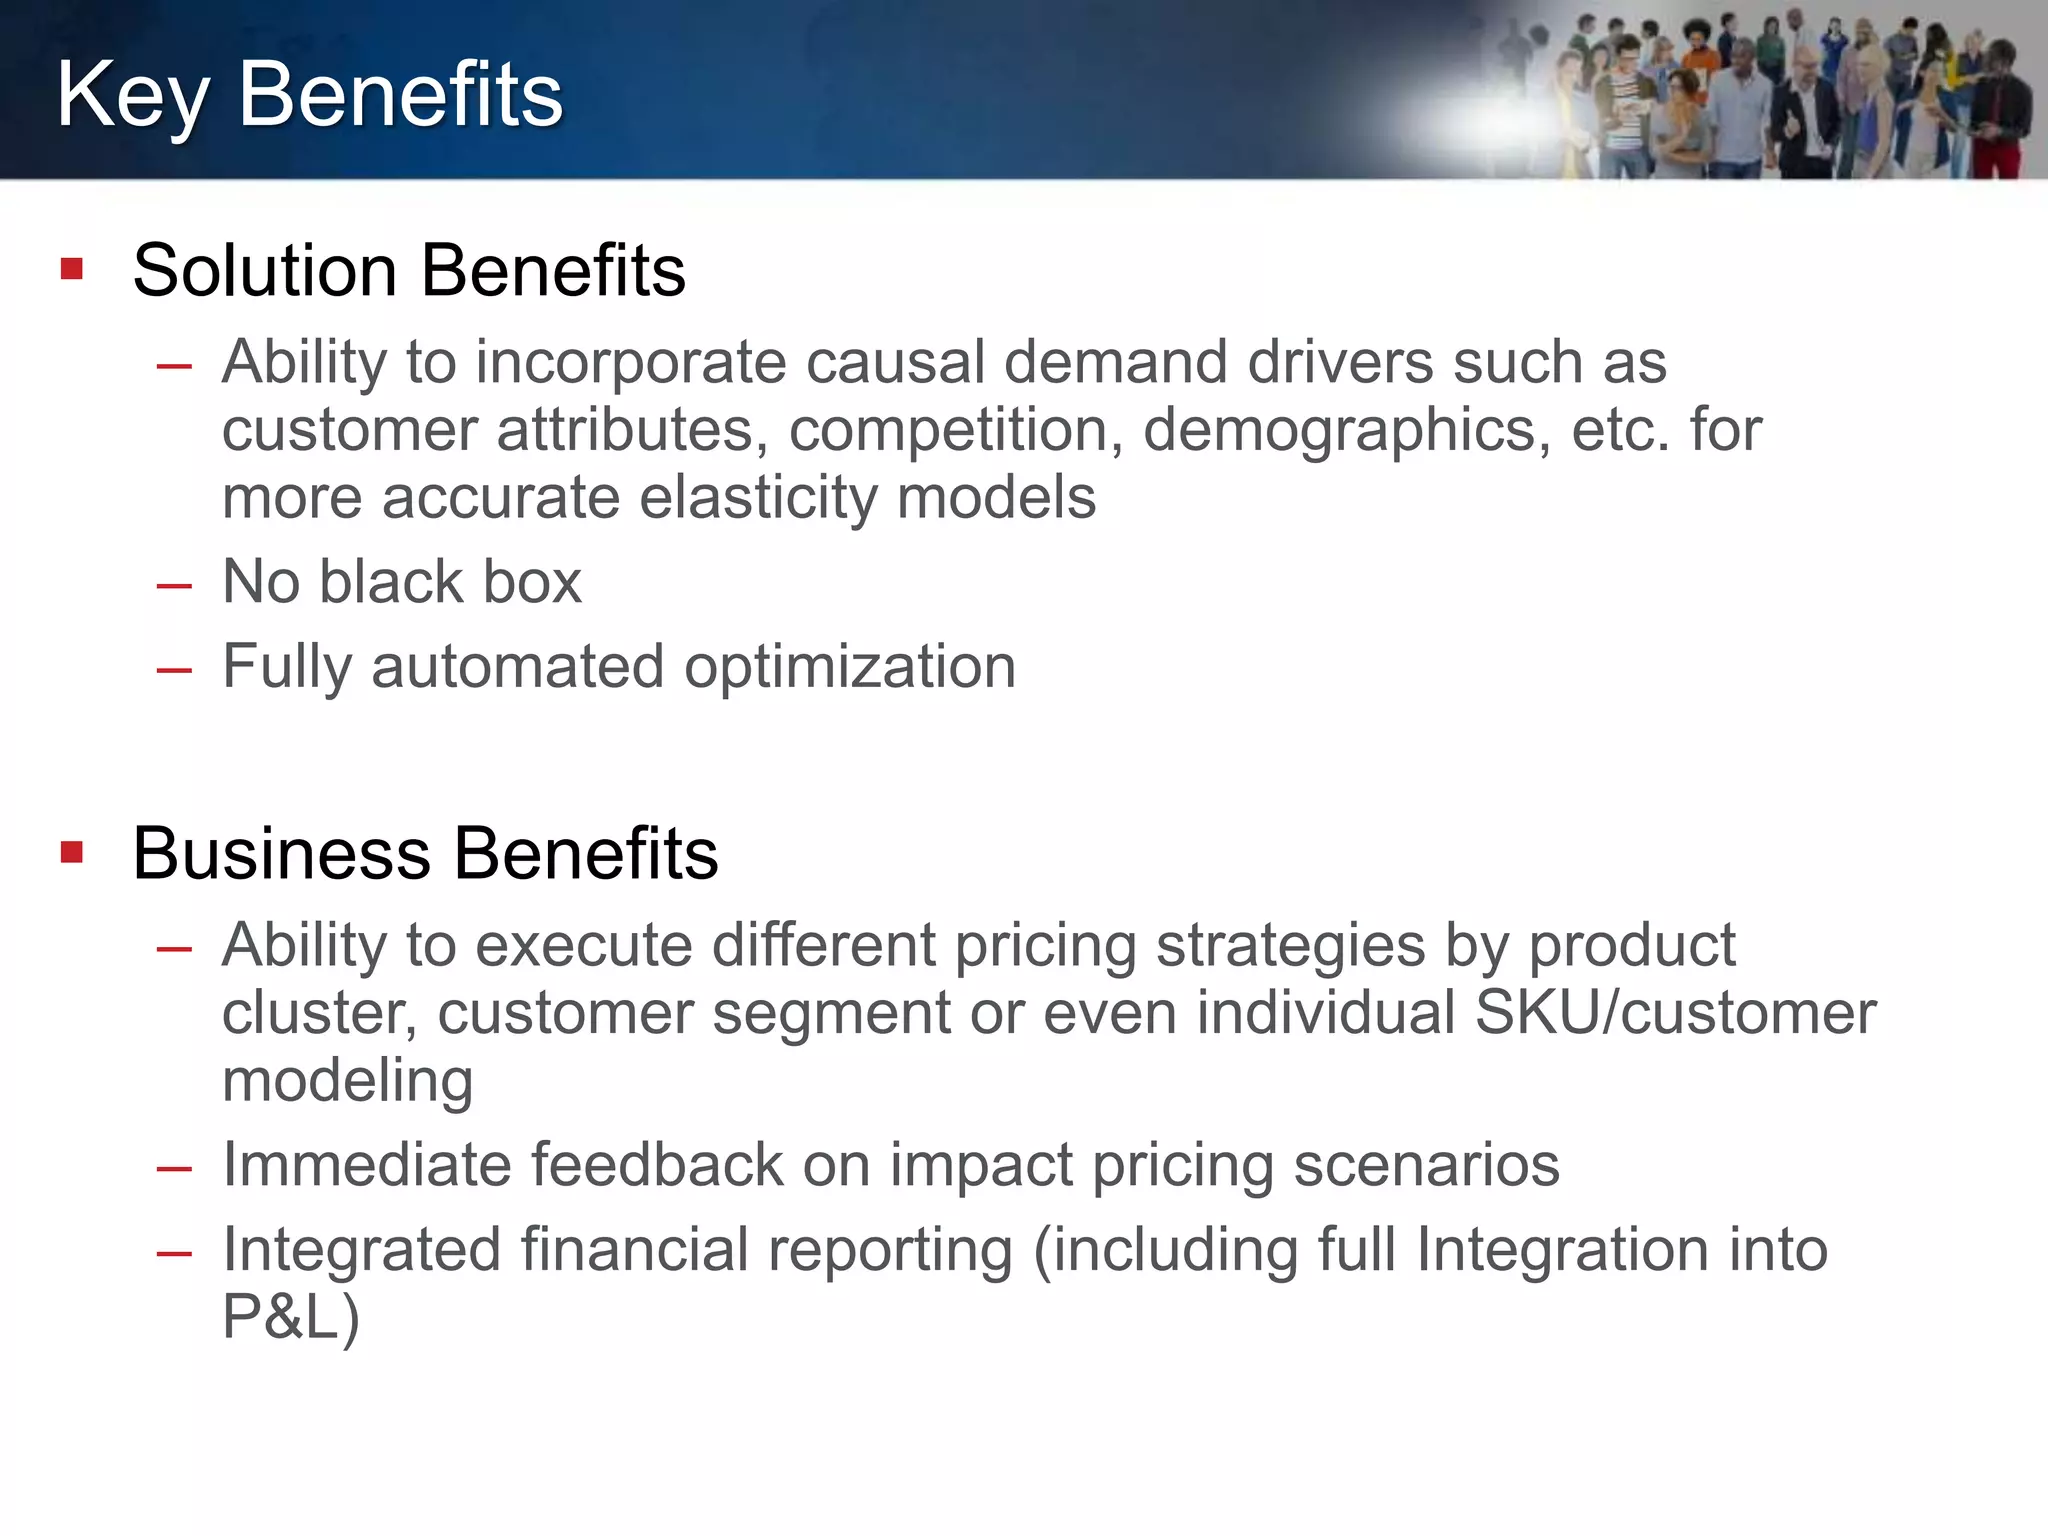
Predictive Price Optimization
January 18, 2018
Presenters
Scott Mutchler
Vice President of Advanced Analytics
QueBIT
Dallas Crawford
Director, Advanced Analytics
Account Management
QueBIT
Tim Corrigan
Advanced Analytics Technical Leader
QueBIT
Housekeeping
 Today’s webinar is part of a monthly advanced webinar series offered by
QueBIT. The next webinar is scheduled for Thursday, February 8th where we
will demonstrate how QueBIT’s Performance Optimization and Monitoring
Service will get your Cognos Analytics investment on the right track and keep it
there. Register by accessing the events page on our website at
quebit.com/news-events
 This webinar is being recorded and attendees will receive the recording link
within 24 hours
 Miss a past webinar? No problem! Visit the Resources page on the QueBIT
website - //quebit.com/who-we-are/video-catalog/
 Please type all questions in the Questions Pane located on the GTW toolbar.
As time permits, the questions will be addressed and answered at the end of
the demonstration.
 Follow-up sessions for questions and answers are available, if needed.
Agenda
 Brief QueBIT Introductions
 What is Price Optimization?
 QueBIT’s Approach to Price Optimization
 Achilles Demonstration
 Key Benefits
About QueBIT
 Trusted Experts in Analytics
 16+ years in business with managers on the team who
have been working in area of Analytics for 20+ years
 Full Offerings - Advisory & Implementation Services,
Reseller of IBM Software and Developer of Solutions
 900+ successful Analytics Projects
 450+ analytics customers in all types of industries
 115+ employees with HQ in New York
 Received 2016 IBM Beacon Award for Innovation for
Demand Planning Solution
 Deep Expertise in Financial Analytics, Advanced
Analytics, Business Intelligence, and DHW
 Strong focus in Predictive Planning applications
 Multi-Year Award Winner
Business Overview
What is price optimization?
 Adjusting prices on products and/or services for customers
(or groups of customers)
What is the business benefit of price optimization?
 Growing Top-line Revenue
 Growing Margins
 Growing Market Share
 Customer Retention
Price Optimization Challenges
Data driven process
 Must have changed prices over time
– Promotions, normal price changes, variation by geography, etc.
Different customers will react differently to price changes
 Optimally you want to make pricing changes for
homogeneous behavior groups
Price optimization must mesh with corporate objectives
 Margin targets
 Category management goals
 Strategic growth initiatives
Behavioral Customer Segmentation
 Top-down Segmentation of Customers
– Assume that “natural groupings” of customers will react
homogeneously to pricing changes
 Big box retailers, regional retailers, mom-and-pop retailers, etc.
 Bottoms-up Segmentation of Customers
– Use data and advanced analytics (clustering) to group customers
based on behavioral drivers
 Proximity to competition (and competition types)
 Prior changes in customer behavior (based on pricing changes)
 Competitor prices
– Web scraping, alternative (b2b) sources, etc.
Customer Segments = Varying Elasticities = Pricing Zones
Pricing Zone Examples
Pricing Zone Category Competition Pricing Elasticity
Zone 1 TVs High Highly Elastic
Zone 2 TVs Medium Elastic
Zone 3 TVs Low Inelastic
Zone 3 HDMI
Cables
Low Highly Inelastic
Category Goals
Category Management Goals Vary
 Category Role
– Destination, Core, , etc.
 Category Growth Potential
– Aggressive Grow, Maintain, Exit, etc.
 Category Pricing Sensitivity
– Highly Sensitivity (often price shopped), Medium, Low, etc.
Category Goals – Target Ranges
Category Role Growth Potential Pricing
Sensitivity
Target Price
Range
(Market Price)
TVs Destination Aggressive Grow High 90-100%
Bluetooth
Speakers
Core Maintain High 95-105%
HDMI Cables Convenience Maintain Low 105-110%
GPS Units Core Exit Low 105-110%
Phone Charger Routine Grow Medium 100-105%
…
Math Behind Price Optimization
Units are Driven by Price
ui = ai * pi
n + other causal factors…
Essentially we have a linear (n=1) or non-linear (n>1)
relationship between the units sold of a SKU and the price of
that SKU.
Other causal factors may include
 Demographics
 Competition
 Product Life Cycle, etc.
Elasticity by Pricing Zone
Price
Units
Mathematical Optimization
Optimization Finds the Price that Maximizes…
Margin, Revenue, Units (pick one)
And Stays Within Bounds Set by Category Management
Prices are Optimized at the Pricing Zone (Customer
Segment) and SKU level
Achilles Demo
Key Benefits
 Solution Benefits
– Ability to incorporate causal demand drivers such as
customer attributes, competition, demographics, etc. for
more accurate elasticity models
– No black box
– Fully automated optimization
 Business Benefits
– Ability to execute different pricing strategies by product
cluster, customer segment or even individual SKU/customer
modeling
– Immediate feedback on impact pricing scenarios
– Integrated financial reporting (including full Integration into
P&L)
Thank You
Q&AType your questions in the Question Pane located on the GTW toolbar
Contact Information
Dallas Crawford - dcrawford@quebit.com
Scott Mutchler - smutchler@quebit.com
Tim Corrigan - tcorrigan@quebit.com
www.quebit.com

Predictive Price Optimization January 2018 QueBIT Webinar - Achilles Price Optimization, Automation and Analytics

  • 1.
  • 2.
    Presenters Scott Mutchler Vice Presidentof Advanced Analytics QueBIT Dallas Crawford Director, Advanced Analytics Account Management QueBIT Tim Corrigan Advanced Analytics Technical Leader QueBIT
  • 3.
    Housekeeping  Today’s webinaris part of a monthly advanced webinar series offered by QueBIT. The next webinar is scheduled for Thursday, February 8th where we will demonstrate how QueBIT’s Performance Optimization and Monitoring Service will get your Cognos Analytics investment on the right track and keep it there. Register by accessing the events page on our website at quebit.com/news-events  This webinar is being recorded and attendees will receive the recording link within 24 hours  Miss a past webinar? No problem! Visit the Resources page on the QueBIT website - //quebit.com/who-we-are/video-catalog/  Please type all questions in the Questions Pane located on the GTW toolbar. As time permits, the questions will be addressed and answered at the end of the demonstration.  Follow-up sessions for questions and answers are available, if needed.
  • 4.
    Agenda  Brief QueBITIntroductions  What is Price Optimization?  QueBIT’s Approach to Price Optimization  Achilles Demonstration  Key Benefits
  • 5.
    About QueBIT  TrustedExperts in Analytics  16+ years in business with managers on the team who have been working in area of Analytics for 20+ years  Full Offerings - Advisory & Implementation Services, Reseller of IBM Software and Developer of Solutions  900+ successful Analytics Projects  450+ analytics customers in all types of industries  115+ employees with HQ in New York  Received 2016 IBM Beacon Award for Innovation for Demand Planning Solution  Deep Expertise in Financial Analytics, Advanced Analytics, Business Intelligence, and DHW  Strong focus in Predictive Planning applications  Multi-Year Award Winner
  • 6.
    Business Overview What isprice optimization?  Adjusting prices on products and/or services for customers (or groups of customers) What is the business benefit of price optimization?  Growing Top-line Revenue  Growing Margins  Growing Market Share  Customer Retention
  • 7.
    Price Optimization Challenges Datadriven process  Must have changed prices over time – Promotions, normal price changes, variation by geography, etc. Different customers will react differently to price changes  Optimally you want to make pricing changes for homogeneous behavior groups Price optimization must mesh with corporate objectives  Margin targets  Category management goals  Strategic growth initiatives
  • 8.
    Behavioral Customer Segmentation Top-down Segmentation of Customers – Assume that “natural groupings” of customers will react homogeneously to pricing changes  Big box retailers, regional retailers, mom-and-pop retailers, etc.  Bottoms-up Segmentation of Customers – Use data and advanced analytics (clustering) to group customers based on behavioral drivers  Proximity to competition (and competition types)  Prior changes in customer behavior (based on pricing changes)  Competitor prices – Web scraping, alternative (b2b) sources, etc. Customer Segments = Varying Elasticities = Pricing Zones
  • 9.
    Pricing Zone Examples PricingZone Category Competition Pricing Elasticity Zone 1 TVs High Highly Elastic Zone 2 TVs Medium Elastic Zone 3 TVs Low Inelastic Zone 3 HDMI Cables Low Highly Inelastic
  • 10.
    Category Goals Category ManagementGoals Vary  Category Role – Destination, Core, , etc.  Category Growth Potential – Aggressive Grow, Maintain, Exit, etc.  Category Pricing Sensitivity – Highly Sensitivity (often price shopped), Medium, Low, etc.
  • 11.
    Category Goals –Target Ranges Category Role Growth Potential Pricing Sensitivity Target Price Range (Market Price) TVs Destination Aggressive Grow High 90-100% Bluetooth Speakers Core Maintain High 95-105% HDMI Cables Convenience Maintain Low 105-110% GPS Units Core Exit Low 105-110% Phone Charger Routine Grow Medium 100-105% …
  • 12.
    Math Behind PriceOptimization Units are Driven by Price ui = ai * pi n + other causal factors… Essentially we have a linear (n=1) or non-linear (n>1) relationship between the units sold of a SKU and the price of that SKU. Other causal factors may include  Demographics  Competition  Product Life Cycle, etc.
  • 13.
    Elasticity by PricingZone Price Units
  • 14.
    Mathematical Optimization Optimization Findsthe Price that Maximizes… Margin, Revenue, Units (pick one) And Stays Within Bounds Set by Category Management Prices are Optimized at the Pricing Zone (Customer Segment) and SKU level
  • 15.
  • 16.
    Key Benefits  SolutionBenefits – Ability to incorporate causal demand drivers such as customer attributes, competition, demographics, etc. for more accurate elasticity models – No black box – Fully automated optimization  Business Benefits – Ability to execute different pricing strategies by product cluster, customer segment or even individual SKU/customer modeling – Immediate feedback on impact pricing scenarios – Integrated financial reporting (including full Integration into P&L)
  • 17.
    Thank You Q&AType yourquestions in the Question Pane located on the GTW toolbar Contact Information Dallas Crawford - dcrawford@quebit.com Scott Mutchler - smutchler@quebit.com Tim Corrigan - tcorrigan@quebit.com www.quebit.com