The document describes research using the ZDSD rat model to study diabetic nephropathy. Key findings include:
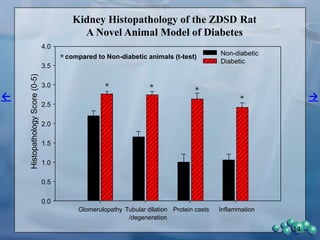
1) ZDSD rats exhibit nephropathy that closely mimics that observed in obese, insulin resistant patients as shown by elevated biomarkers, albuminuria, oxidative stress, and histological analysis.
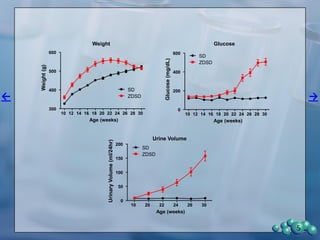
2) Terminal kidney weights are highest in ZDSD rats, indicating significant diabetic nephropathy, along with increased urine volume and microalbumin levels.
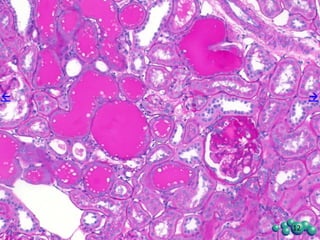
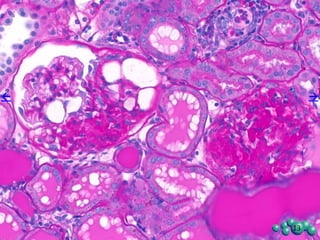
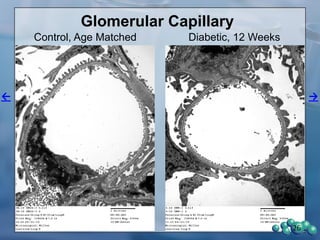
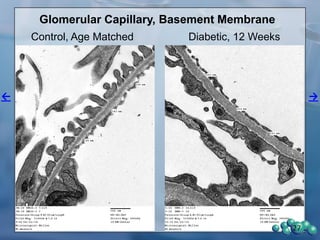
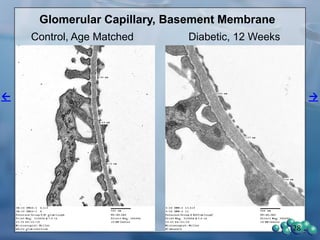
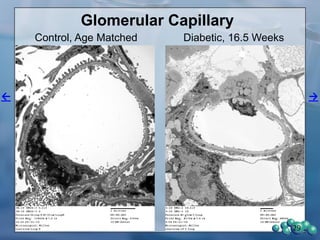
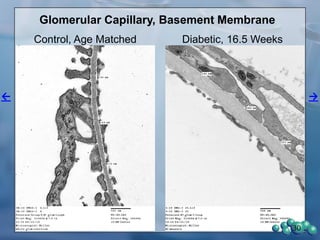
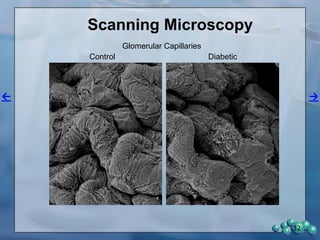
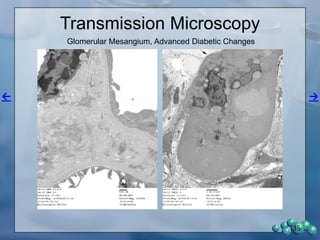
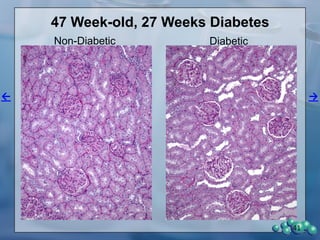
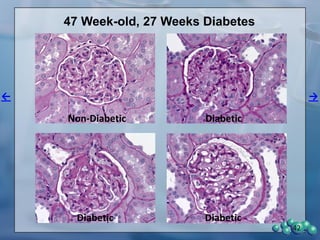
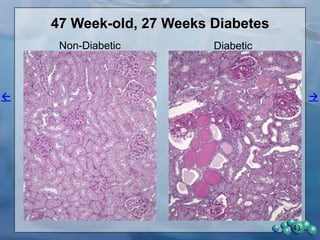
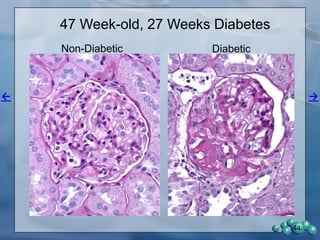
3) Histological analysis shows glomerular sclerosis, nodular sclerosis, thickened glomerular basement membranes, and podocyte effacement in ZDSD rats, consistent with diabetic nephropathy