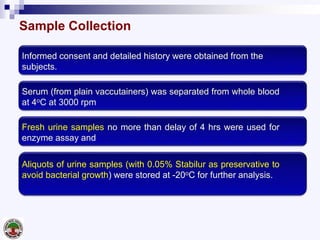
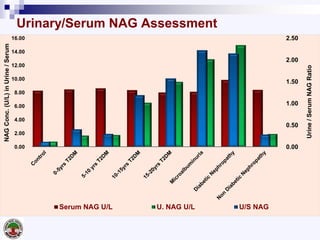
This study examines urinary N-acetyl β-D-glucosaminidase (NAG) as an early biomarker for detecting renal tubular damage in type 2 diabetes mellitus patients at risk for diabetic nephropathy. 991 patients were divided into 8 groups based on diabetes status and duration, albuminuria levels, and presence of nephropathy. Urinary and serum NAG levels increased with longer diabetes duration and worsening albuminuria/nephropathy. A urinary NAG cutoff of 3 U/L differentiated patients with 10+ years of diabetes, microalbuminuria, and nephropathy from controls, with high specificity and sensitivity. The study concludes urinary NAG can

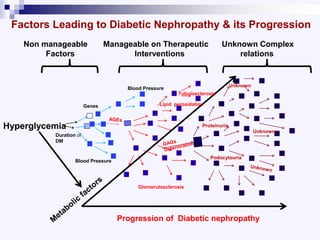
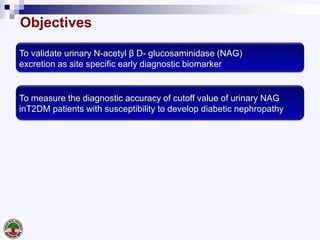
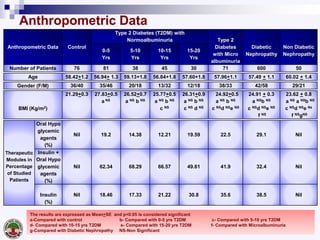
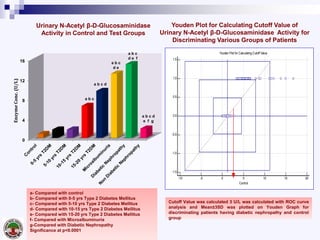
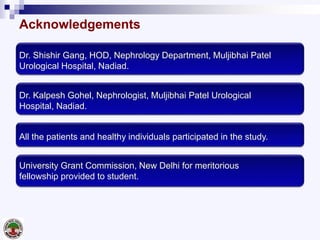
![ROC curves of urinary NAG for assessment of diabetic nephropathy. With 3 U/L cutoff value
control group discriminated T2DM patients with 10-15 yrs, 15-20 yrs, microalbuminuria and
diabetic nephropathy with a likelihood ratio of 25.6, 96.1 %specificity and 100% sensitivity. The
AUC were 1.000,0.999, 0.999 and 1.000 respectively.
ROC Curve Analysis to Determine Cutoff Value, Specificity and Sensitivity of
Urinary N-Acetyl β-D-Glucosaminidase Activity in Different Study Groups
[A] Control Vs
Other Study Groups
[B] 0-5 yrs T2DM Vs
Other Study Groups
[C] 5-10 yrs T2DM Vs
Other Study Groups](https://image.slidesharecdn.com/nagdiabetnephropatia-160607093005/85/Nag-diabet-nephropatia-19-320.jpg)
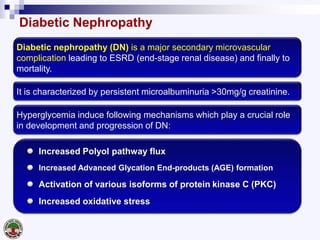
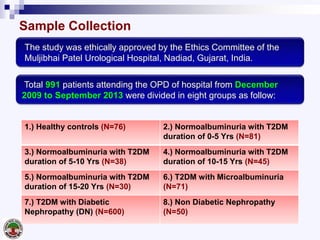
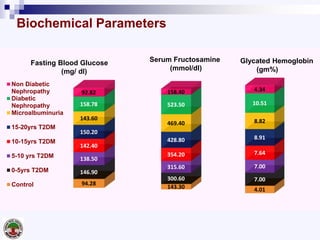
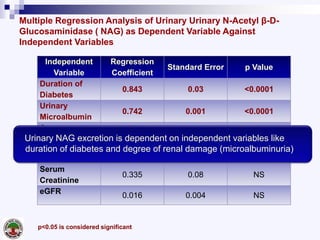
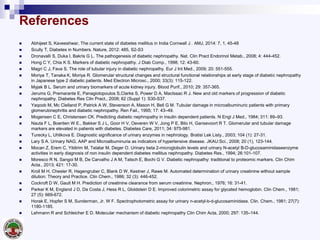
![ROC curves of urinary NAG for assessment of diabetic nephropathy. With 3 U/L cutoff value
control group discriminated T2DM patients with 10-15 yrs, 15-20 yrs, microalbuminuria and
diabetic nephropathy with a likelihood ratio of 25.6, 96.1 %specificity and 100% sensitivity. The
AUC were 1.000,0.999, 0.999 and 1.000 respectively.
ROC Curve Analysis to Determine Cutoff Value, Specificity and Sensitivity
of Urinary N-Acetyl β-D-Glucosaminidase Activity in Different Study Groups
[D] 10-15 yrs T2DM Vs
Other Study Groups
[E] 15-20 yrs T2DM Vs
Other Study Groups
[F] Microalbuminuria Vs
Diabetic Nephropathy &
Non Diabetic Nephropathy](https://image.slidesharecdn.com/nagdiabetnephropatia-160607093005/85/Nag-diabet-nephropatia-20-320.jpg)


![ONFH[AVN HIP] -TRIPLE REGIME -A NOVAL SURGICAL CONCEPT .pptx](https://cdn.slidesharecdn.com/ss_thumbnails/onfhavnhip2026koaconcalicutdrgokuldevdrmashraf-260210064517-213ec005-thumbnail.jpg?width=640&height=640&fit=bounds)


