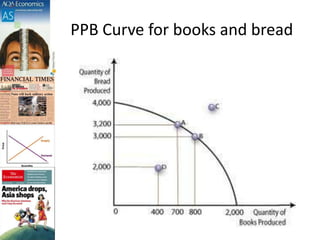
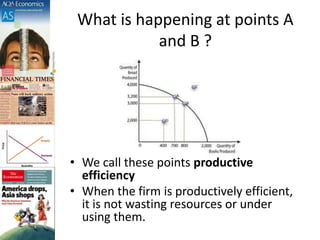
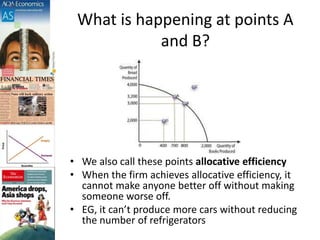
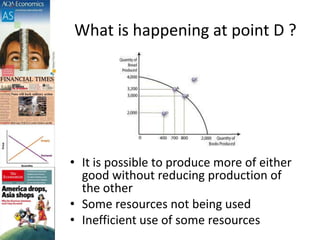
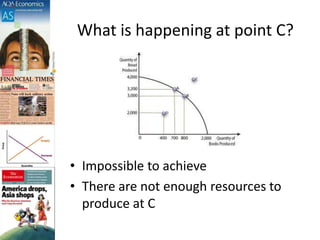
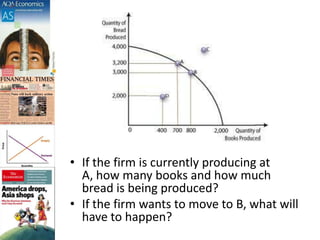
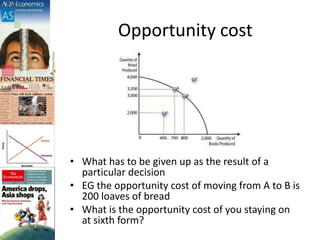
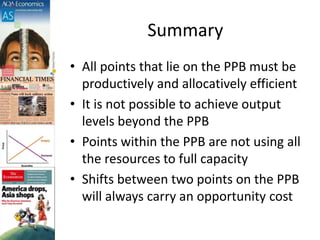
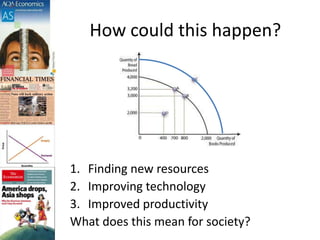
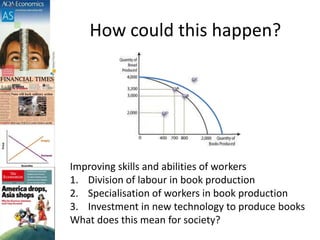
AS Economics
Production Possibility Boundaries
To get you started…
• Imagine a firm that produces two
products. What are they?
• Can the firm produce as many of
the two products as they want?
• Why? Why not?
• Can you show how this could
work on a graph?
Today’s objectives
• Be able to draw a production
possibility diagram
• Use a PPB to explain opportunity cost
• Be able to explain:
Allocative efficiency
Productive efficiency
A shift in the PPB
PPB Curve for books and bread
Economics Graphs
• Good Size
• Label each axis
• Label each point
• Explain clearly what your
graph is showing
What is happening at points A
and B ?
• We call these points productive
efficiency
• When the firm is productively efficient,
it is not wasting resources or under
using them.
What is happening at points A
and B?
• We also call these points allocative efficiency
• When the firm achieves allocative efficiency, it
cannot make anyone better off without making
someone worse off.
• EG, it can’t produce more cars without reducing
the number of refrigerators
What is happening at point D ?
• It is possible to produce more of either
good without reducing production of
the other
• Some resources not being used
• Inefficient use of some resources
What is happening at point C?
• Impossible to achieve
• There are not enough resources to
produce at C
• If the firm is currently producing at
A, how many books and how much
bread is being produced?
• If the firm wants to move to B, what will
have to happen?
Opportunity cost
• What has to be given up as the result of a
particular decision
• EG the opportunity cost of moving from A to B is
200 loaves of bread
• What is the opportunity cost of you staying on
at sixth form?
Summary
• All points that lie on the PPB must be
productively and allocatively efficient
• It is not possible to achieve output
levels beyond the PPB
• Points within the PPB are not using all
the resources to full capacity
• Shifts between two points on the PPB
will always carry an opportunity cost
How could this happen?
1. Finding new resources
2. Improving technology
3. Improved productivity
What does this mean for society?
How could this happen?
Improving skills and abilities of workers
1. Division of labour in book production
2. Specialisation of workers in book production
3. Investment in new technology to produce books
What does this mean for society?
Today’s objectives
• Be able to draw a production
possibility diagram
• Use a PPB to explain opportunity cost
• Be able to explain:
Allocative efficiency
Productive efficiency
A shift in the PPB

Ppb curves ptn

  • 1.
  • 2.
    To get youstarted… • Imagine a firm that produces two products. What are they? • Can the firm produce as many of the two products as they want? • Why? Why not? • Can you show how this could work on a graph?
  • 3.
    Today’s objectives • Beable to draw a production possibility diagram • Use a PPB to explain opportunity cost • Be able to explain: Allocative efficiency Productive efficiency A shift in the PPB
  • 4.
    PPB Curve forbooks and bread
  • 5.
    Economics Graphs • GoodSize • Label each axis • Label each point • Explain clearly what your graph is showing
  • 6.
    What is happeningat points A and B ? • We call these points productive efficiency • When the firm is productively efficient, it is not wasting resources or under using them.
  • 7.
    What is happeningat points A and B? • We also call these points allocative efficiency • When the firm achieves allocative efficiency, it cannot make anyone better off without making someone worse off. • EG, it can’t produce more cars without reducing the number of refrigerators
  • 8.
    What is happeningat point D ? • It is possible to produce more of either good without reducing production of the other • Some resources not being used • Inefficient use of some resources
  • 9.
    What is happeningat point C? • Impossible to achieve • There are not enough resources to produce at C
  • 10.
    • If thefirm is currently producing at A, how many books and how much bread is being produced? • If the firm wants to move to B, what will have to happen?
  • 11.
    Opportunity cost • Whathas to be given up as the result of a particular decision • EG the opportunity cost of moving from A to B is 200 loaves of bread • What is the opportunity cost of you staying on at sixth form?
  • 12.
    Summary • All pointsthat lie on the PPB must be productively and allocatively efficient • It is not possible to achieve output levels beyond the PPB • Points within the PPB are not using all the resources to full capacity • Shifts between two points on the PPB will always carry an opportunity cost
  • 13.
    How could thishappen? 1. Finding new resources 2. Improving technology 3. Improved productivity What does this mean for society?
  • 14.
    How could thishappen? Improving skills and abilities of workers 1. Division of labour in book production 2. Specialisation of workers in book production 3. Investment in new technology to produce books What does this mean for society?
  • 15.
    Today’s objectives • Beable to draw a production possibility diagram • Use a PPB to explain opportunity cost • Be able to explain: Allocative efficiency Productive efficiency A shift in the PPB