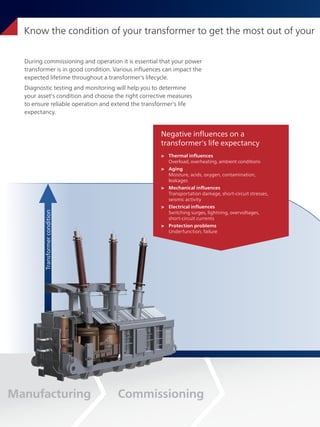
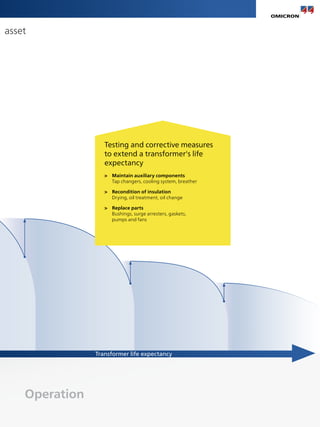
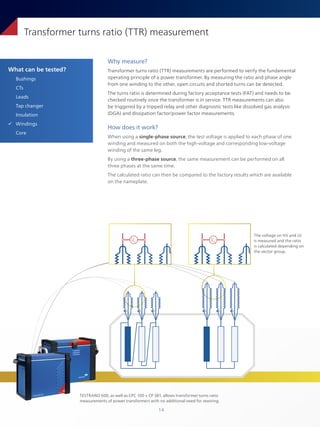
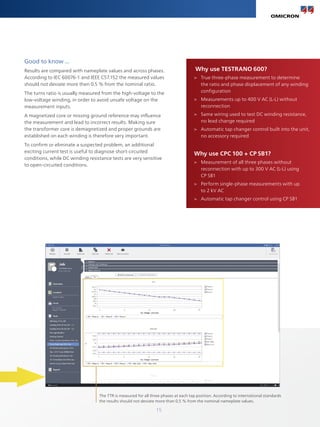
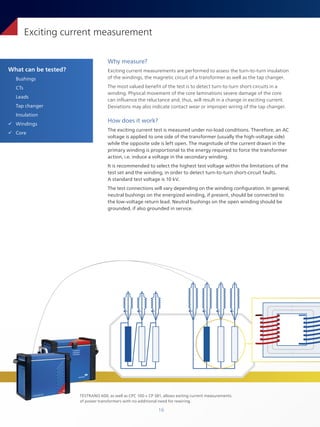
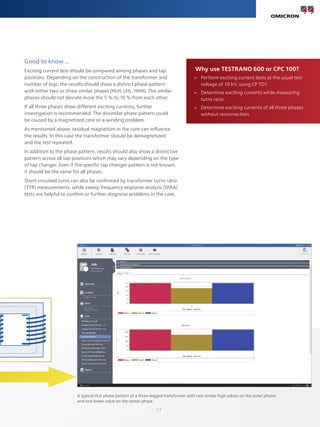
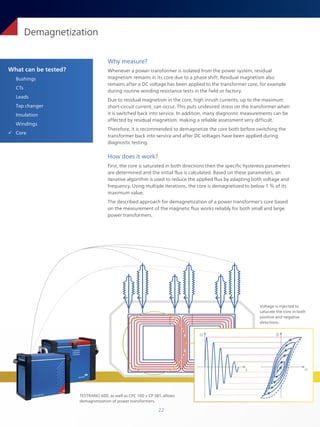
SlideShare a Scribd company logo
Testing and diagnostics
of power transformers
2
Know the condition of your transformer to get the most out of your
During commissioning and operation it is essential that your power
transformer is in good condition. Various influences can impact the
expected lifetime throughout a transformer's lifecycle.
Diagnostic testing and monitoring will help you to determine
your asset's condition and choose the right corrective measures
to ensure reliable operation and extend the transformer's life
expectancy.
Manufacturing
Transformer
condition
Commissioning
Negative influences on a
transformer's life expectancy
> Thermal influences
Overload, overheating, ambient conditions
> Aging
Moisture, acids, oxygen, contamination,
leakages
> Mechanical influences
Transportation damage, short-circuit stresses,
seismic activity
> Electrical influences
Switching surges, lightning, overvoltages,
short-circuit currents
> Protection problems
Underfunction, failure
3
asset
Operation
Transformer life expectancy
Testing and corrective measures
to extend a transformer's life
expectancy
> Maintain auxiliary components
Tap changers, cooling system, breather
> Recondition of insulation
Drying, oil treatment, oil change
> Replace parts
Bushings, surge arresters, gaskets,
pumps and fans
4
Transformer components and their detectable faults
Component Detectable faults
Bushings
Partial breakdown between capacitive graded layers,
cracks in resin-bonded insulation
Aging and moisture ingress
Open or compromised measuring tap connection
Partial discharges in insulation
CTs
Current ratio or phase error considering burden,
excessive residual magnetism, non-compliance to
relevant IEEE or IEC standard
Burden-dependent current ratio and phase displacement
Shorted turns
Leads
Contact problems
Mechanical deformation
Tap changer
Contact problems in tap selector and at diverter switch
Open circuit, shorted turns, or high resistance connections
in the OLTC preventative autotransformer
Contact problems in the DETC
Insulation
Moisture in solid insulation
Aging, moisture, contamination of insulation fluids
Partial discharges
Windings
Short-circuits between windings or between turns
Strand-to-strand short-circuits
Open circuits in parallel strands
Short-circuit to ground
Mechanical deformation
Contact problems, open circuits
Core
Mechanical deformation
Floating core ground
Shorted core laminates
Residual magnetism
5
C
a
p
a
c
i
t
a
n
c
e
a
n
d
p
o
w
e
r
f
a
c
t
o
r
/
d
i
s
s
i
p
a
t
i
o
n
f
a
c
t
o
r
m
e
a
s
u
r
e
m
e
n
t
:
a
t
5
0
H
z
o
r
6
0
H
z
a
s
t
i
p
-
u
p
t
e
s
t
w
i
t
h
v
a
r
i
a
b
l
e
f
r
e
q
u
e
n
c
y
D
C
w
i
n
d
i
n
g
r
e
s
i
s
t
a
n
c
e
m
e
a
s
u
r
e
m
e
n
t
a
n
d
O
L
T
C
v
e
r
i
f
i
c
a
t
i
o
n
T
r
a
n
s
f
o
r
m
e
r
t
u
r
n
s
r
a
t
i
o
(
T
T
R
)
m
e
a
s
u
r
e
m
e
n
t
E
x
c
i
t
i
n
g
c
u
r
r
e
n
t
m
e
a
s
u
r
e
m
e
n
t
S
h
o
r
t
-
c
i
r
c
u
i
t
i
m
p
e
d
a
n
c
e
/
l
e
a
k
a
g
e
r
e
a
c
t
a
n
c
e
m
e
a
s
u
r
e
m
e
n
t
F
r
e
q
u
e
n
c
y
r
e
s
p
o
n
s
e
o
f
s
t
r
a
y
l
o
s
s
e
s
(
F
R
S
L
)
m
e
a
s
u
r
e
m
e
n
t
D
e
m
a
g
n
e
t
i
z
a
t
i
o
n
D
i
e
l
e
c
t
r
i
c
(
f
r
e
q
u
e
n
c
y
)
r
e
s
p
o
n
s
e
a
n
a
l
y
s
i
s
S
w
e
e
p
f
r
e
q
u
e
n
c
y
r
e
s
p
o
n
s
e
a
n
a
l
y
s
i
s
(
S
F
R
A
)
C
u
r
r
e
n
t
t
r
a
n
s
f
o
r
m
e
r
a
n
a
l
y
s
i
s
P
a
r
t
i
a
l
d
i
s
c
h
a
r
g
e
a
n
a
l
y
s
i
s
P
a
r
t
i
a
l
d
i
s
c
h
a
r
g
e
l
o
c
a
l
i
z
a
t
i
o
n
Possible measurement methods
■ ■ ■ ■
■ ■ ■
■ ■
■ ■
■
■
■
■ ■
■
■ ■ ■
■ ■ ■
■ ■ ■
■ ■ ■
■ ■ ■
■ ■ ■
■ ■ ■ ■
■ ■
■ ■ ■
■ ■ ■
■ ■ ■ ■
■ ■
■ ■ ■
■ ■ ■
■ ■
■ ■ ■
6
TESTRANO 600 CPC 100 CPC 80 + CP TD1
Capacitance and power factor/dissipation factor measurement:
at 50 Hz or 60 Hz ■1
■1 ■
as tip-up test ■1
■1 ■
with variable frequency ■1
■1 ■
DC winding resistance measurement and OLTC verification ■ ■2
Transformer turns ratio (TTR) measurement ■ ■3
Exciting current measurement ■ ■1
Short-circuit impedance / leakage reactance measurement ■ ■
Frequency response of stray losses (FRSL) measurement ■ ■
Demagnetization ■ ■2
Dielectric (frequency) response analysis
Sweep frequency response analysis (SFRA)
Current transformer analysis ■
Partial discharge analysis
Partial discharge localization
Three-phase test
set for the fastest
and most compre-
hensive diagnostic
testing and condi-
tion assessment of
power transformers.
Multi-functional
test set for a com-
prehensive condi-
tion diagnosis and
condition assess-
ment of multiple
high-voltage assets.
Power/dissipation
factor and capaci-
tance test set,
(including source
and reference
capacitor) for vari-
ous high-voltage
assets.
The ideal solution for your individual needs and requirements/applic
1
Additional accessory CP TD1 required
2
Additional accessory CP SB1 required
3
Optional accessory CP SB1 available to speed up testing
4
Additional power supply and standard capacitor required
7
TANDO 700 DIRANA FRANEO 800 CT ANALYZER MPD 600 PDL 650
■4
■4
■4 ■
■
■
■
■
■
Ultra-precise test
set for dissipa-
tion/power factor
and capacitance
measurements on
high-voltage assets
(with an external
source and refer-
ence capacitor)
Lightweight test set
for fast and reliable
moisture content
determination of
oil-paper insulated
power transformers.
Smart test set for
sweep frequency
response analysis
(SFRA) on power
transformer core
and windings.
Highly accurate and
lightweight test set
for current trans-
former calibration
and verification.
High-end test set
for partial discharg-
es analysis in high-
voltage assets.
Test set for conve-
nient partial dis-
charge localization
in power transform-
ers.
ation
8
What can be tested?
ü Bushings
CTs
Leads
Tap changer
ü Insulation
Windings
Core
Capacitance and power factor/dissipation factor measurement
Why measure?
Capacitance and power factor/dissipation factor (PF/DF) measurements
are performed to investigate the condition of the insulation of power
transformers and bushings. Both insulation systems are essential for the
reliable operation of the transformer.
High oil conductivity, aging and an increase in the water content are
symptoms of the degradation process in the insulation. These symptoms
also result in an increase of losses, which can be quantified by measuring
the power factor or dissipation factor.
Changes in capacitance can indicate partial breakdown between the
capacitive layers of bushings. By measuring the capacitance and losses,
problems in the insulation can be detected before a failure occurs.
One of the major causes for transformer outages is the replacement of
bushings due to a deterioration or failure of the insulation.
CP TD1 combined with TESTRANO 600 or CPC 100/80 allows capacitance and power factor/dissipation factor
measurement. DIRANA and TANDO 700 can be used for advanced diagnostics or in the laboratory.
CA
CB
CC
CD
CE
CF
The capacitive layers
of a bushing
LV
CL
CHL
CH
HV
9
0.001
0.01
0.1
1
10
0.0001 0.001 0.01 0.1 1 10 100 1000
tan(
δ)
Frequency in Hz
wet, good oil dry, bad oil dry, good oil wet, bad oil
0.001
0.01
0.1
1
10
15 50 85 120 155 190 225 260 295 330 365 400
tan(
δ)
Frequency in Hz
wet, good oil dry, bad oil dry, good oil wet, bad oil
How does it work?
On power transformers, measurements are performed on the main insulation
between the windings (CHL
) and the insulation from the windings to the tank (CH
, CL
).
The windings are shorted and the test voltage is applied to one winding while the
current through the insulation is measured on the opposite winding or the tank.
On bushings, the voltage is applied to the main conductor while measuring the
current on the measurement tap.
The dissipation factor, also called tan(δ), is calculated via the tangent of the
angle δ between the measured current and the ideal current which would occur
if no losses would existed. The power factor is the cosine of the angle φ, therefore
also called cos(φ), between the output voltage and the measured current.
Using frequencies other than line frequency increases the sensitivity of the
measurement as some problems are more dominant at frequencies above or
below line frequency. Modern test devices can perform automatic frequency
or voltage sweeps.
Depending on the test device, different frequency ranges can be
measured, e.g. from 15 Hz to 400 Hz with TESTRANO 600 and
from 10 μHz to 5 kHz with DIRANA.
The tan(δ) of four different transformers below and above line frequency (50 Hz).
The dielectric losses cause a phase shift
t
i(t)
δ =
Reference current
Test object current
Phase shift
δ
φ
I
U
I
C
IR
tan( ) =
δ
IR
IC
cos( ) =
IR
I
φ
t
i(t)
δ =
Reference current
Test object current
Phase shift
δ
φ
I
U
I
C
IR
tan( ) =
δ
IR
IC
cos( ) =
IR
I
φ
10
Capacitance and power factor/dissipation factor measurement
Good to know ...
After the measurements have been completed, it is beneficial to compare the values
to previous results and reference values mentioned in the relevant standards for the
tested asset.
A rise in capacitance of more than 10 % compared to previous results is normally
considered to be dangerous for bushings. It indicates that a part of the insulation
distance is already compromised and the dielectric stress to the remaining insulation
is too high.
An additional voltage tip-up test can detect bad contacts of the bushing layers or
the measurement tap. They can be recognized by a decreasing PF/DF.
Standard PF/DF measurements at 50 Hz or 60 Hz can only detect the effects of
moisture and aging at an advanced stage. By performing the measurement across
a wider frequency range, these effects can be detected at an earlier stage allowing
for a longer reaction time to schedule corrective action.
If a high PF/DF is detected, dielectric response analysis can be used as a
supplementary diagnostic method. This broadband dielectric measurement
can be used to determine whether the high PF/DF is caused by moisture or
a high oil conductivity.
Typical values for power factor/dissipation factor of bushings
at line frequency and at 20°C/68°F according to international standards
Typical values for power factor/dissipation factor of transformers,
depending on the used insulating liquid at 20°C/68°F according to
international standards (IEEE C.57-152)
Insulating liquid kV rating
Nominal/new
PF/DF limit
Serviceability
aged limit
Mineral oil < 230 kV 0.5 % 1.0 %
Mineral oil ≥ 230 kV 0.5 % 1.0 %
Natural oil All 1.0 % 1.0 %
Insulation type
New
bushings
IEEE
C57.19.01
IEC
60137
Resin impregnated paper
(RIP)
0.3 % ... 0.4 % < 0.85 % < 0.70 %
Oil impregnated paper
(OIP)
0.2 % ... 0.4 % < 0.50 % < 0.70 %
Resin bonded paper
(RBP)
0.5 % ... 0.6 % < 2.00 % < 1.50 %
11
Our solutions ...
We offer a wide range of solutions for capacitance and power factor/dissipation
factor (tan δ) measurements. They range from mobile solutions for comfortable
on-site testing, through high precise solutions for laboratory use, up to dedicated
test sets for advanced power transformer condition diagnosis, such as moisture
determination.
Measurement range Typical application
TESTRANO 600 + CP TD1
0 ... 12 kV
15 Hz ... 400 Hz
Dedicated condition diagnosis of power
transformers on-site and during manufacturing
CPC 100 + CP TD1
0 ... 12 kV
15 Hz ... 400 Hz
General condition diagnosis of multiple assets
on-site and during manufacturing
CPC 80 + CP TD1
0 ... 12 kV
15 Hz ... 400 Hz
Dedicated power factor/dissipation factor
testing of multiple assets on-site and during
manufacturing
TANDO 700
Voltage depending
on external source
5 Hz ... 400 Hz
High-voltage laboratory tests, e.g. for routine
and type tests or material tests of multiple assets
DIRANA
max. 200 Vpeak
50 μHz ... 5 kHz
Advanced condition diagnosis and moisture
determination in oil-paper insulation
12
What can be tested?
Bushings
CTs
ü Leads
ü Tap changer
Insulation
ü Windings
Core
DC winding resistance measurement and OLTC verification
Why measure?
Winding resistance measurements are performed for assessing possible damage in
windings or contact problems, such as from the bushings to the windings, the windings
to the tap changer, etc.
They are also used to check the on-load tap changer (OLTC) as they can indicate when
to clean or replace OLTC contacts, or when to replace or refurbish the OLTC itself.
Failures can be detected without opening the tap changer compartment.
How does it work?
To measure the winding resistance, the winding must be charged until the core is
saturated. The resistance can then be determined by measuring DC current and
DC voltage. For tapped windings, this should be done for every tap position, hence
testing the OLTC and the winding together. There are two common approaches for
this test: static and dynamic winding resistance measurements.
Static winding resistance measurements are the most common and easiest way to
check for issues regarding the winding and OLTC. It investigates the resistance of each
subsequent tap position and compares it with the reference measurement data of the
manufacturer.
Dynamic resistance measurements are performed as a supplementary measurement
in order to analyze the transient switching process of a resistive diverter OLTC.
It investigates the switching process of the diverter switch itself. When switching the
tap changer during winding resistance measurements, the DC current temporarily
decreases and this behaviour is recorded and analyzed.
TESTRANO 600, as well as CPC 100 + CP SB1, allows static and dynamic resistance
measurements of power transformers with no additional need for rewiring.
OLTC
The specially designed
Kelvin clamps ensure
4-wire connection
technique for precise
resistance results.
13
Good to know ...
For DC winding resistance, the results should not differ more
than 1 % compared to the reference measurement. In addition,
differences between phases are usually less than 2-3 %.
When comparing winding resistance measurements, the
results have to be temperature corrected. The usual reference
temperature is 75 °C / 167 °F.
A transformer turns ratio measurement can be used to confirm
an open circuit while a frequency response analysis can be used
to confirm contact problems.
In both cases an additional gas analysis can indicate hot spots
in the transformer. However, gas signatures are not unique and,
thus, do not allow for the identification of the root cause.
During DC winding resistance measurements the core of the
transformer may be magnetized. Therefore, it is recommended
to demagnetize the core after performing this test.
Why use TESTRANO 600?
>
> Three-phase measurement of HV and LV windings
without reconnection using up to 33 A DC
>
> Single-phase measurement of low ohmic
windings using up to 100 A DC
>
> Automatic tap changer control and measurement
of OLTC motor current and voltage
>
> Demagnetize the core and measure turns ratio
without changing any leads
Why use CPC 100 + CP SB1?
>
> Measurement of all three phases without
reconnection using CP SB1 with up to 6 A DC
>
> Single-phase measurement of low ohmic windings
with up to 100 A DC
>
> Automatic tap changer control using CP SB1
Winding resistance per tap, recorded using the static winding resistance measurement.
Winding Resistance per Tap
Taps
0.33 Ω
0.28 Ω
0.23 Ω
0.18 Ω
0.13 Ω
1 3 5 7 9 11 13 15 17 19 21 23 25
Phase B
Phase A
Phase C
Transient current during switching process
of resistive diverter OLTC, recorded using
the dynamic resistance measurement.
0 ms 50 ms 100 ms 150 ms 200 ms
1.6 A
1.8 A
2 A
2.2 A
2.4 A
2.6 A
2.8 A
3 A
14
What can be tested?
Bushings
CTs
Leads
Tap changer
Insulation
ü Windings
Core
Transformer turns ratio (TTR) measurement
Why measure?
Transformer turns ratio (TTR) measurements are performed to verify the fundamental
operating principle of a power transformer. By measuring the ratio and phase angle
from one winding to the other, open circuits and shorted turns can be detected.
The turns ratio is determined during factory acceptance tests (FAT) and needs to be
checked routinely once the transformer is in service. TTR measurements can also
be triggered by a tripped relay and other diagnostic tests like dissolved gas analysis
(DGA) and dissipation factor/power factor measurements.
How does it work?
When using a single-phase source, the test voltage is applied to each phase of one
winding and measured on both the high-voltage and corresponding low-voltage
winding of the same leg.
By using a three-phase source, the same measurement can be performed on all
three phases at the same time.
The calculated ratio can then be compared to the factory results which are available
on the nameplate.
The voltage on HV and LV
is measured and the ratio
is calculated depending on
the vector group.
TESTRANO 600, as well as CPC 100 + CP SB1, allows transformer turns ratio
measurements of power transformers with no additional need for rewiring.
UHV
ULV
15
Good to know ...
Results are compared with nameplate values and across phases.
According to IEC 60076-1 and IEEE C57.152 the measured values
should not deviate more then 0.5 % from the nominal ratio.
The turns ratio is usually measured from the high-voltage to the
low-voltage winding, in order to avoid unsafe voltage on the
measurement inputs.
A magnetized core or missing ground reference may influence
the measurement and lead to incorrect results. Making sure
the transformer core is demagnetized and proper grounds are
established on each winding is therefore very important.
To confirm or eliminate a suspected problem, an additional
exciting current test is useful to diagnose short-circuited
conditions, while DC winding resistance tests are very sensitive
to open-circuited conditions.
Why use TESTRANO 600?
>
> True three-phase measurement to determine
the ratio and phase displacement of any winding
configuration
>
> Measurements up to 400 V AC (L-L) without
reconnection
>
> Same wiring used to test DC winding resistance,
no lead change required
>
> Automatic tap changer control built into the unit,
no accessory required
Why use CPC 100 + CP SB1?
>
> Measurement of all three phases without
reconnection with up to 300 V AC (L-L) using
CP SB1
>
> Perform single-phase measurements with up
to 2 kV AC
>
> Automatic tap changer control using CP SB1
The TTR is measured for all three phases at each tap position. According to international standards
the results should not deviate more than 0,5 % from the nominal nameplate values.
16
What can be tested?
Bushings
CTs
Leads
Tap changer
Insulation
ü Windings
ü Core
Exciting current measurement
Why measure?
Exciting current measurements are performed to assess the turn-to-turn insulation
of the windings, the magnetic circuit of a transformer as well as the tap changer.
The most valued benefit of the test is to detect turn-to-turn short-circuits in a
winding. Physical movement of the core laminations severe damage of the core
can influence the reluctance and, thus, will result in a change in exciting current.
Deviations may also indicate contact wear or improper wiring of the tap changer.
How does it work?
The exciting current test is measured under no-load conditions. Therefore, an AC
voltage is applied to one side of the transformer (usually the high-voltage side)
while the opposite side is left open. The magnitude of the current drawn in the
primary winding is proportional to the energy required to force the transformer
action, i.e. induce a voltage in the secondary winding.
It is recommended to select the highest test voltage within the limitations of the
test set and the winding, in order to detect turn-to-turn short-circuit faults.
A standard test voltage is 10 kV.
The test connections will vary depending on the winding configuration. In general,
neutral bushings on the energized winding, if present, should be connected to
the low-voltage return lead. Neutral bushings on the open winding should be
grounded, if also grounded in service.
TESTRANO 600, as well as CPC 100 + CP SB1, allows exiting current measurements
of power transformers with no additional need for rewiring.
17
Good to know ...
Exciting current test should be compared among phases and tap
positions. Depending on the construction of the transformer and
number of legs, the results should show a distinct phase pattern
with either two or three similar phases (HLH, LHL, HHH). The similar
phases should not deviate more the 5 % to 10 % from each other.
If all three phases show different exciting currents, further
investigation is recommended. The dissimilar phase pattern could
be caused by a magnetized core or a winding problem.
As mentioned above, residual magnetism in the core can influence
the results. In this case the transformer should be demagnetized
and the test repeated.
In addition to the phase pattern, results should also show a distinctive
pattern across all tap positions which may vary depending on the type
of tap changer. Even if the specific tap changer pattern is not known,
it should be the same for all phases.
Short-circuited turns can also be confirmed by transformer turns ratio
(TTR) measurements, while sweep frequency response analysis (SFRA)
tests are helpful to confirm or further diagnose problems in the core.
Why use TESTRANO 600 or CPC 100?
>
> Perform exciting current tests at the usual test
voltage of 10 kV, using CP TD1
>
> Determine exciting currents while measuring
turns ratio
>
> Determine exciting currents of all three phases
without reconnection
A typical HLH phase pattern of a three-legged transformer with two similar high values on the outer phases
and one lower value on the center phase.
18
What can be tested?
Bushings
CTs
Leads
Tap changer
Insulation
ü Windings
Core
Short-circuit impedance / leakage reactance measurement
Why measure?
Short-circuit impedance / leakage reactance measurements are sensitive methods
to assess possible deformation or displacement of windings.
Severe short-circuits or transportation of the power transformer may cause the
windings to move or become deformed. In events like these, short-circuit impedance
/ leakage reactance tests are recommended.
The tests are usually performed as a three-phase measurement which can be
compared to the nameplate value established by the manufacturer during factory
acceptance tests. As this value represents the average across all three phases, a per-
phase measurement is also recommended for winding diagnosis.
How does it work?
An AC source is connected to each phase of the high-voltage winding. During the
three-phase measurement, all three phases of the low-voltage side are shorted
without connecting the neutral terminal, when present. For the per-phase test, the
short-circuit is only applied on the corresponding winding on the low voltage side.
The current and the voltage across the high-voltage winding are measured in
amplitude and phase. Finally, the short-circuit impedance is calculated by
considering the specific transformer ratings.
TESTRANO 600, as well as CPC 100, allows short-circuit impedance / leakage reactance
measurements on power transformers. The TESTRANO 600 can perform a true three-
phase measurement without any rewiring.
Фσ1
Leaka
Main
19
Good to know ...
The short-circuit impedance obtained from the three-phase
measurement should not deviate more than 3 % from the
nameplate value.
However, higher deviations do not automatically confirm
winding deformation. In order to do so, at least one of the
per-phase leakage reactance test results must fail.
Each phase result should be compared to the average of all
three measurements of the per-phase test. In most cases
deviations from the average will be less than 1 % and should
not exceed 2-3 %. The results of the per-phase test cannot be
compared to the nameplate value.
The leakage reactance represents only the reactive part of
the short-circuit impedance. However both terms are used
synonymously to refer to the same test method.
In addition, a sweep frequency response analysis (SFRA) can
be performed to further investigate winding movement and
deformation.
Why use TESTRANO 600?
>
> True three-phase measurement to determine the
short-circuit impedance without reconnection
>
> Similar test method as used during factory
acceptance tests
>
> Same wiring used as for FRSL measurements
Why use CPC 100?
>
> Single-phase measurements to determine
three-phase equivalent and per-phase
short-circuit impedance
>
> Same wiring used as for FRSL measurements
The short-circuit impedance is calculated based on the measured three-phase results
and the power ratings of the transformer. Then, it is compared to the nominal value
on the transformer nameplate.
Ф12
Фσ2
age flux
n flux
The leakage reactance represents the leakage flux, which is
the flux not fully contained in the core. A shift or deformation
of the windings will change the reluctance of the leakage
path and, thus, the reactance.
Transformer Type Serial No.
Year: Manufacturing 1966 DB
Operation
V A
V A
V A
%
t
Hz
50 S Yd11
Cooling Vector Group
Power P: PRIM TERT SEC kVA
Rated
Voltage
Impedances:
Weight:
PRIM-TERT
Total Oil Active Part Shipping
TERT-SEC PRIM-SEC
ODL 16 000 / 110 561525
12 000
12 000
12 62 00
11 00 00
9 38 00
54.9
53.0
73.9
10 600
9.45
8.45
8.15
424 17.6 18 41
1
13
25
20
What can be tested?
Bushings
CTs
Leads
Tap changer
Insulation
ü Windings
Core
Frequency response of stray losses (FRSL) measurement
Why measure?
The frequency response of stray losses (FRSL) test is a measurement of the resistive
component of the short-circuit impedances at multiple frequencies. It is the only
electrical method to identify short-circuits between parallel strands and local
overheating due to excessive eddy current losses.
Similar to the short-circuit and leakage reactance test, it is recommended to perform
the FRSL measurement as a commissioning or acceptance test to establish benchmark
results. Likewise FRSL tests are not routine diagnostic tests, but are recommended for
advanced diagnostics. The test can also be performed as a three-phase or per-phase
test.
How does it work?
The test setup and procedure of the FRSL test is the same as for short-circuit
impedance/leakage reactance testing and can be performed simultaneously.
An AC source is connected to each phase of the high-voltage winding. During the
three-phase measurement, all three phases of the low voltage side are shorted
without connecting the neutral terminal, when present. For the per-phase test, the
short-circuit is only applied on the corresponding winding of the low voltage side.
From the measured current, voltage and phase displacement the resistive
component of the short-circuit impedance is calculated at discrete frequencies
between 15 and 400 Hz.
As the eddy losses in the transformer become more pronounced at higher
frequencies, a rise in the resistive component can be observed by plotting
the results over the range of frequencies.
FRSL measurements cover a
wider frequency range compared
to short-circuit impedance/leakage
reactance measurements.
TESTRANO 600 as well as CPC 100 allows for measuring the frequency response of stray losses (FRSL).
The TESTRANO 600 can perform a true three-phase measurement without any rewiring.
FRSL
Short-circuit impedance /
leakage reactance
Hz
Z
15 50/60 400
21
Good to know ...
The analysis of FRSL results is largely visual and includes
the comparison across phases and over time. Because the
eddy losses are proportional to the frequency, an increase in
impedance can be observed over the range of frequencies.
This increase should be uniform across all three phases,
resulting in a smooth, exponential curve. Deviations as low as
3 %, especially in the higher frequencies, may already indicate
a strand-to-strand short-circuit condition.
FRSL results should be cross-checked by performing dissolved
gas analysis (DGA). Many of the problems which can be
diagnosed using FRSL produce combustible gases.
For example, short-circuit strands may cause higher than
normal overheating, which could be detected by DGA.
The most common problems which may result in misleading
FRSL results are bad connections and small cross sections of
the applied short-circuit jumper. In this case, a vertical offset
between the phases can be observed.
Why use TESTRANO 600?
>
> True three-phase measurement to measure FRSL
without reconnection
>
> Same wiring used to test short-circuit impedance /
leakage reactance tests
Why use CPC 100?
>
> Single-phase measurements to measure
three- phase equivalent and per phase FRSL
>
> Same wiring used to test short-circuit impedance /
leakage reactance tests
Frequency in Hz
0
0.0 Ω
0.5 Ω
1.0 Ω
1.5 Ω
2.0 Ω
2.5 Ω
3.0 Ω
Resistance
3.5 Ω
4.0 Ω
4.5 Ω
50 100 150 200 250 300 350 400
Phase B
Phase A
Phase C
Acceptable FRSL results
Frequency in Hz
0
50 mΩ
100 mΩ
150 mΩ
200 mΩ
250 mΩ
300 mΩ
Resistance
50 100 150 200 250 300 350 400
Phase B
Phase A
Phase C
FRSL results indicate short-circuit in parallel
strands in phase C winding
22
What can be tested?
Bushings
CTs
Leads
Tap changer
Insulation
Windings
ü Core
Demagnetization
Why measure?
Whenever a power transformer is isolated from the power system, residual
magnetism remains in its core due to a phase shift. Residual magnetism also
remains after a DC voltage has been applied to the transformer core, for example
during routine winding resistance tests in the field or factory.
Due to residual magnetism in the core, high inrush currents, up to the maximum
short-circuit current, can occur. This puts undesired stress on the transformer when
it is switched back into service. In addition, many diagnostic measurements can be
affected by residual magnetism, making a reliable assessment very difficult.
Therefore, it is recommended to demagnetize the core both before switching the
transformer back into service and after DC voltages have been applied during
diagnostic testing.
How does it work?
First, the core is saturated in both directions then the specific hysteresis parameters
are determined and the initial flux is calculated. Based on these parameters, an
iterative algorithm is used to reduce the applied flux by adapting both voltage and
frequency. Using multiple iterations, the core is demagnetized to below 1 % of its
maximum value.
The described approach for demagnetization of a power transformer's core based
on the measurement of the magnetic flux works reliably for both small and large
power transformers.
U
t H
B
Voltage is injected to
saturate the core in both
positive and negative
directions.
TESTRANO 600, as well as CPC 100 + CP SB1, allows
demagnetization of power transformers.
23
SFRA measurement before demagnetization
SFRA measurement after demagnetization
Good to know ...
The demagnetization of the power transformer's core
minimizes the risk for personnel and equipment when
switching the transformer back into service.
It is also recommended to demagnetize the transformer before
performing exciting current, sweep frequency response analysis
(SFRA) or magnetic balance tests. All these measurements will
be affected by a magnetized core which may lead to a false
interpretation of the results.
An important aspect of a successful demagnetization is to
constantly monitor the magnetic flux (ф) in the core during
the demagnetization process.
Why use TESTRANO 600 or
CPC 100 + CP SB1?
>
> Fast and reliable demagnetization of the
power transformer core
>
> Measurement of initial remanence for further
diagnosis, e.g. of unexpected exciting current
test results
>
> Demagnetization to below 1 % of core's
maximum value
Inrush current
Linked flux
Time
Linked
flux,
current
High inrush current occurs due to residual magnetism and
can jeopardize a transformer when it is switched back into service.
SFRA measurement on phase A: The shift in resonance points shows
how the measurement is affected by the magnetized core.
24
What can be tested?
Bushings
CTs
ü Leads
Tap changer
Insulation
ü Windings
ü Core
Sweep frequency response analysis (SFRA)
Why measure?
Sweep frequency response analysis (SFRA) is used to identify mechanical or electrical
problems in power transformer windings, contacts or cores. Severe short-circuits or
shocks during the transformer's transportation may cause the winding to move or
become deformed.
Since the IEC 60076-18 standard was introduced, this method has become one of the
common electrical tests and its acceptance on the market has increased accordingly.
SFRA tests are recommended to be performed at the end of the acceptance test at the
manufacturer's to establish the transformer's original fingerprint and then again after
transportation, and during commissioning.
How does it work?
Power transformers can be seen as a complex electrical network of capacitance,
inductances and resistors. Each electrical network has its own unique frequency
response.
A sinusoidal excitation voltage with a continuously increasing frequency is injected
into one end of the transformer winding and the response signal returning from
the other end is measured. The comparison of input and output signals generates a
unique frequency response, which can be compared with the reference fingerprint.
Changes, movement or deformation of internal components lead to changes in this
transfer function and can be identified by comparing the plots.
The correct connection technique
ensures reproducible result.
� � 
FRANEO 800 allows reliable core and windings diagnosis of power transformers
by using sweep frequency response analysis (SFRA).
25
Good to know ...
SFRA is based on the comparison of a current test with a reference
test. When such a fingerprint is not available, results of another
phase or a similar transformer can also be used for comparison.
These detected faults can be confirmed by other measurements,
such as DC winding resistance, frequency response of stray
losses (FRSL), short-circuit impedance / leakage reactance,
exciting current, or transformer turns ratio (TTR) measurement.
SFRA is a non-invasive method. It allows the reliable assessment
of a power transformer's integrity without applying high-voltages.
No other method is as sensitive to mechanical deformations
of the active part of power transformers as SFRA.
Why use FRANEO 800?
>
> Widest dynamic measuring range in the industry
(> 150 dB)
>
> Reproducible results thanks to innovative
connection technique, based on IEC 60076-18,
Method 1
>
> Operating with Primary Test ManagerTM
, thus
guided workflow for test set-up, execution and
assessment for easy analysis without expert
knowledge
>
> Fast measurement times due to intelligent sweep
algorithms
>
> Small and lightweight equipment guarantees
optimum usability
PTM offers automatic result assessment and comparison, also typical influences for deviations can be visualized.
26
What can be tested?
ü Bushings
CTs
Leads
Tap changer
ü Insulation
Windings
Core
Dielectric (frequency) response analysis
Why measure?
Dielectric response analysis, also known as dielectric frequency response analysis,
is used to assess the moisture content of the cellulose insulation and, thus, determine
its condition.
Moisture in oil-paper insulated power transformers is produced by paper aging or
enters the transformer via leaky seals or breathing. It leads to a reduced breakdown
strength and an increased aging of the insulation.
Knowing the moisture content is important for the condition assessment of
the power transformer and its bushings. This measurement is also used for new
transformers to prove the low moisture content after the drying process.
How does it work?
The main amount of cellulose insulation in the active part of a power transformer
is located between the primary and secondary winding. To measure this insulation,
the output is connected to the high-voltage winding and the input to the low-voltage
winding. Unwanted capacitive and resistive currents are bypassed by the guard
connection which is applied to the tank.
The power factor/dissipation factor of this insulation is measured over a wide
frequency range. The resulting curve contains information about the insulation
condition.
The very low frequencies contain information on moisture in the solid insulation,
while the position of the slope in the mid range frequencies indicates the conductivity
of the liquid insulation. This curve is automatically compared to model curves and
the moisture content of the cellulose insulation is calculated.
LV
CL
CHL
CH
HV
DIRANA determines the moisture content of oil-paper insulated power transformers
and also assesses the condition of bushings by using dielectric response analysis.
27
Why use DIRANA?
>
> Reliable moisture determination of power
transformers and oil-impregnated-paper (OIP)
bushings.
>
> Provides extremely short measurement
times by combining measurement methods
(FDS and PDC+)
>
> Wide frequency range (10 µHz ... 5 kHz)
Good to know ...
This method is also scientifically approved by CIGRÉ. There are
no other non-invasive ways to assess moisture in a transformer
which provide comparable accuracy.
The moisture content is directly determined in the cellulose and
not deduced from the moisture in the oil. Thus, the method is
applicable at all temperatures and there is no need to wait until
moisture equilibrium between paper and oil has been reached.
The assessment is performed according to IEC 60422 which
provides categories for moisture levels.
The dielectric response curve allows conclusions to be drawn about the different factors
that influence the measurement result.
Frequency in Hz
0.0001 0.001 0.01 0.1 1.0 10 50 100
0.005
0.01
0.02
0.05
0.10
0.2
0.5
1.0
2.0
1000
0.001
low water (0,3 wt.%),
good oil
moderate water (2 wt.%),
bad oil
wet (3,3 wt.%),
good oil
Tan Delta
0.1
1
Moisture and aging
of cellulose
Insulation Geometry
Oil conductivity
0.01
0.001
Frequency
0.001 Hz 1 Hz 1000 Hz
Dissipation Factor
28
What can be tested?
Bushings
ü CTs
Leads
Tap changer
Insulation
Windings
Core
Current transformer analysis
Why measure?
The bushing current transformers (CTs) are tested by power transformer
manufacturers during the final acceptance test, whereas substation operators
test during commissioning. The tests check if the CTs send correct signals to the
substation’s protection system.
Wrong signals lead to maloperation of the protection system which may damage
the connected assets. Checked parameters are the CT accuracy, including CT ratio
error and phase displacement, accuracy for different burdens, CT winding resistance,
CT excitation characteristics, ALF and FS.
All tests are performed in compliance with the standards: IEC 60044-6, IEC 60044-1,
IEC 61869-2, IEEE C57.13
How does it work?
Each phase is tested separately, the other phases must be short-circuited. A voltage
is applied via the secondary side. This produces the magnetic force and the magnetic
flux density in the CT core. The ratio error is calculated using the burden and the data
of the CT model (equivalent circuit diagram), whose parameters are determined.
No high-current source is needed and the test must only be performed once, even
when the CT must later be assessed using further burdens and primary currents.
All relevant CT parameters are accurately measured, considering the CT's burden
and excitation characteristics.
CT Analyzer performs diagnostic tests on bushing CTs.
29
Good to know ...
The cycles and values for diagnostic tests on bushing current
transformers (CTs) are defined in the respective standards and
in the commissioning guidance of CT operators.
The CT error is determined for different connection methods
of a transformer's windings. A polarity check verifies correct
polarity of the CT and of the CT winding. The excitation curve
is measured and the kneepoints are calculated. Remanence is
measured and the CTs are demagnetized to avoid maloperation
of the protection relay.
The larger the impedance of the burden, the smaller the margin
until saturation is reached. Saturation of the core is reached
when magnetization does not increase anymore while the
external magnetic field strength is further increased. The result
is a massive decrease of the CT efficiency and performance.
When measuring ratio of CTs mounted at the bushing of the
transformer winding terminals, the voltage injection method
is used instead of the current injection method due to the
impedance of the transformer winding. For this method, a
test voltage is applied to the secondary side of the CT and a
voltage measurement is taken at the bushing terminals of the
transformer windings. This test can also be performed using
CPC 100 to check ratio, polarity and CTs protection class.
Why use CT Analyzer?
>
> Automatic demagnetization of CTs avoids
maloperation of protection system
>
> Automatic test report generation according
to the standards
>
> The secondary voltage injection method is
the only way for testing bushing CTs already
connected to power transformers
>
> Extremely high accuracy (0.02 % typical)
up to the 0.1 accuracy class
>
> Compact and lightweight design
(< 8 kg / 17.4 lbs)
Different test cards support you in checking and assessing relevant
CT parameters such as ratio, resistance and its protection class.
30
What can be tested?
ü Bushings
CTs
Leads
Tap changer
ü Insulation
ü Windings
Core
LV HV
Partial discharge analysis
Why measure?
Partial discharge (PD) can damage insulation materials in power transformer bushings
and windings. This can lead to their failure and costly outages.
PD is observed in power transformer bushings and windings if the insulation material
between different voltage potentials is aged, contaminated or faulty.
PD measurement is a reliable and non-destructive method used to diagnose the
condition of a power transformer insulation system. It is performed during factory
acceptance, on-site commissioning and routine maintenance testing to detect critical
defects and assess risks.
How does it work?
When measuring and analyzing PD activity in power transformers, the particular tests
and test set-ups are determined by the type of transformer and to which standard
the measurements are performed.
Depending on the type of bushings used, the PD analysis system is connected either
to the capacitive tap of the bushings or to an external coupling capacitor. This allows
electrical PD measurements on the transformer.
PD is measured either in µV (according to IEEE standards) or in pC (according to the
IEC 60270 standard).
Advanced noise suppression techniques are commonly deployed in high-interference
environments to minimize irrelevant data.
For synchronous multi-channel PD measurements, e.g. for three-phase testing,
at least three MPDs are needed for connection to the HV bushings.
C2’
C3’
C1’
Void
HV
LV /
GND
Insulation
31
Good to know ...
PD can also be directly measured inside the tank of liquid-
insulated transformers using ultra-high frequency (UHF)
sensors. UHF PD measurements can be used as an effective
gating method to verify results – PD pulses from an electrical
measurement at the bushings are only accepted if a UHF pulse
from the transformer tank is also present.
Once PD activity is detected, acoustic PD measurements can be
performed to accurately locate transformer defects.
For on-going risk management, an on-line dielectric condition
monitoring system can be installed to continuously evaluate the
insulation state of bushings and transformers.
Why use MPD 600?
>
> Fiber optic data transmission for safe operation
and improved signal-to-noise ratio
>
> Simultaneous and synchronous multi-channel PD
measurement for more complete analysis
>
> Active noise suppression and gating methods for
optimal accuracy despite high interference
>
> Powerful tools (3PARD and 3FREQ) for separating
noise and multiple PD sources
>
> MPD TransformerTest software module enables
reliable QIEC and/or RIV measurements during
factory acceptance tests
The detected PD cluster can be visualized in detail
by using the PRPD histogram.
Noise
A 3PARD (3-Phase Amplitude Relation Diagram)
separates PD sources from noise
PD cluster
MPD W
MPD U
MPD V
32
What can be tested?
Bushings
CTs
Leads
Tap changer
ü Insulation
ü Windings
Core
Partial discharge localization
Why measure?
Partial discharge (PD) can cause irreversible damage to power transformer insulation,
long before the insulation actually fails. Even upon detection and analysis, it is
essential to know exactly where insulation defects are located in the transformer.
Through acoustic PD measurements, weak points or defects in the insulation can
be precisely located. Once the exact defect location is known, remedial steps can
be efficiently planned and executed to prevent failure.
Acoustic PD measurements are conducted after PD has been detected during factory
acceptance tests, and are an integral part of on-site diagnosis measurements during
the service life of power transformers.
How does it work?
Multiple acoustic sensors are magnetically mounted to the surface of a power
transformer tank. Each sensor measures the acoustic signal propagation time
from the PD source to the tank wall. Defect location is then calculated based on
time differences, sensor position and propagation speed.
The data gathered by these sensors is compared simultaneously to accurately
identify the defect location.
The IEEE C57.127-2007 standard describes the typical workflow of an acoustic
measurement.
Multiple acoustic sensors spread over the
transformer wall help to locate the defect.
PDL 650 setup at a
power transformer with
four acoustic sensors.
33
Good to know ...
Dissolved gas analysis (DGA) can indicate PD activity, but it
cannot actually localize it in power transformers. Acoustic PD
measurements are therefore performed if DGA results show
evidence of PD.
The combination of electrical and ultra-high frequency (UHF)
PD detection measurements can be used to trigger an acoustic
PD measurement. This method ensures optimal PD localization
in environments with heavy interference.
Acoustic PD measurements are performed while power
transformers are online. This eliminates the need for an
outage to keep the transformer in full service.
Why use PDL 650?
>
> Modular, lightweight design for easy
transportability and on-site setup
>
> Safe due to galvanic separation of operator
from high-voltage
>
> 3D visualization enables users to clearly see
defect locations inside the transformer
>
> Electrical triggering in combination with the
MPD 600 and UHF sensors ensures optimal PD
localization in noisy environments
3D model of the transformer reveals the exact PD location.
34
Welcome to the team
At OMICRON you can always depend on an experienced team that actively supports
you and an infrastructure that you can rely on. We always listen attentively in order
to understand your needs so that we can offer you the best possible solutions.
We strive for lasting partnerships and ensure that you can continue to rely on your
product long after you've purchased it. In order to do this, we focus on quality, the
transfer of knowledge and unique customer support.
Charles, Wenyu and René are able to tell you about the services we have available
for you and why it pays to be part of the team.
A strong and safe connection
Charles Sweetser
Application Specialist
Solutions you can rely on...
... developed with experience, passion and an innovative approach that we use to
continually set groundbreaking standards in our industry sector.
We invest more than 15 % of the total turnover in research and development so that
we can even guarantee the reliable use of the latest technology and methods in the
future.
Our comprehensive product care concept also guarantees that your investment in
our solutions – like free software updates – pays off in the long term.
35
René Ulmer
Technical Support
We share our knowledge...
… by maintaining a constant dialogue with users and experts. Some examples
of this are our customer events and conferences that take place all over the
world and our collaboration with numerous standardization committees.
We also make our knowledge available to you in the customer section of our
website in the form of application reports, specialized articles and articles in
the discussion forum. With the OMICRON Academy, we also provide a wide
spectrum of training possibilities and assist you with Start-up training and
free webinars.
When rapid assistance is required...
… our excellent level of support is always appreciated. You can reach the highly-
qualified and committed technicians in our customer support department 24 hours
a day, seven days a week – and it's completely free. We deal with repair services and
service features in a fair and non-bureaucratic manner.
We can help minimize your downtime by lending you equipment from a readily avail-
able plant at one of our service centers in your area. A comprehensive offer of services
for consulting, testing and diagnostics completes our range of services.
Wenyu Guo
OMICRON Academy
Subject to change without notice.
www.omicronenergy.com
For more information, additional literature,
and detailed contact information of our
worldwide offices please visit our website.
OMICRON is an international company serving the electrical power industry with
innovative testing and diagnostic solutions. The application of OMICRON products
allows users to assess the condition of the primary and secondary equipment on
their systems with complete confidence. Services offered in the area of consulting,
commissioning, testing, diagnosis and training make the product range complete.
Customers in more than 150 countries rely on the company’s ability to supply leading-
edge technology of excellent quality. Service centers on all continents provide a broad
base of knowledge and extraordinary customer support. All of this together with our
strong network of sales partners is what has made our company a market leader in the
electrical power industry.
© OMICRON L2921, September 2018

More Related Content

Similar to Power-Transformer-Testing-Brochure-ENU.pdf

Transformer Protection Fundamentals
Transformer Protection FundamentalsTransformer Protection Fundamentals
Transformer Protection Fundamentals
Harjit Birdi
 
Power transformer maintenance
Power transformer maintenancePower transformer maintenance
Power transformer maintenance
Luis Antonio González Mederos
 
Power transformer maintenance
Power transformer maintenancePower transformer maintenance
Power transformer maintenance
Lucian Lazar
 
Frequency response analysis for transformer tap changer damage detection
Frequency response analysis for transformer tap changer damage detectionFrequency response analysis for transformer tap changer damage detection
Frequency response analysis for transformer tap changer damage detection
International Journal of Power Electronics and Drive Systems
 
circuit breaker
circuit breakercircuit breaker
circuit breaker
AbhishekLalkiya
 
Electrical Checks And Measurements And Customer Requirements LEAP
Electrical Checks And Measurements And Customer Requirements LEAPElectrical Checks And Measurements And Customer Requirements LEAP
Electrical Checks And Measurements And Customer Requirements LEAP
Jorge I. Villacis Gallo
 
Partial Discharge Techniques For Measuring Condition Of MV & HV Switchgear
Partial Discharge Techniques For Measuring Condition Of MV & HV SwitchgearPartial Discharge Techniques For Measuring Condition Of MV & HV Switchgear
Partial Discharge Techniques For Measuring Condition Of MV & HV Switchgear
Thorne & Derrick International
 
Chakresh Tiwari Philips report
Chakresh Tiwari Philips reportChakresh Tiwari Philips report
Chakresh Tiwari Philips report
pranav kapoor
 
Transfomer diagnostics/sanjeet-1308143
Transfomer diagnostics/sanjeet-1308143Transfomer diagnostics/sanjeet-1308143
Transfomer diagnostics/sanjeet-1308143
sanjeet kumar
 
3 phase transformer protection
3 phase transformer protection3 phase transformer protection
3 phase transformer protection
Himanshu Paghdal
 
Prueba eléctrica de motores y generadores eléctricos - Calidad de Energía el...
Prueba eléctrica de motores  y generadores eléctricos - Calidad de Energía el...Prueba eléctrica de motores  y generadores eléctricos - Calidad de Energía el...
Prueba eléctrica de motores y generadores eléctricos - Calidad de Energía el...
JOe Torres Palomino
 
Liquid Insulation Dissipation factor and Dielectric Factor Measurement Unit
Liquid Insulation Dissipation factor and Dielectric Factor Measurement UnitLiquid Insulation Dissipation factor and Dielectric Factor Measurement Unit
Liquid Insulation Dissipation factor and Dielectric Factor Measurement Unit
NadiiaHubar
 
Transformer
TransformerTransformer
Transformer
Sarin S Abraham
 
CT and VT.pptx
CT and VT.pptxCT and VT.pptx
CT and VT.pptx
MAHMOUDMOHAMED431205
 
Edwin Newsletter on transformer failures on 13 October 2015
Edwin Newsletter on transformer failures on 13 October 2015Edwin Newsletter on transformer failures on 13 October 2015
Edwin Newsletter on transformer failures on 13 October 2015
Edwin Low
 
BPMI TRANSFORMER PROTECTION.pptx.pdf
BPMI TRANSFORMER PROTECTION.pptx.pdfBPMI TRANSFORMER PROTECTION.pptx.pdf
BPMI TRANSFORMER PROTECTION.pptx.pdf
ssuser2e69dc
 
Devlopement of the dynamic resistance measurement (drm) method for condition ...
Devlopement of the dynamic resistance measurement (drm) method for condition ...Devlopement of the dynamic resistance measurement (drm) method for condition ...
Devlopement of the dynamic resistance measurement (drm) method for condition ...
eSAT Publishing House
 
H010514852
H010514852H010514852
H010514852
IOSR Journals
 
Tan Delta on MV Cables (Megger)
Tan Delta on MV Cables (Megger)Tan Delta on MV Cables (Megger)
Tan Delta on MV Cables (Megger)
AHMED MOHAMED HEGAB
 
Testing of transformer
Testing of transformerTesting of transformer
Testing of transformer
vikasgupta1965
 

Similar to Power-Transformer-Testing-Brochure-ENU.pdf (20)

Transformer Protection Fundamentals
Transformer Protection FundamentalsTransformer Protection Fundamentals
Transformer Protection Fundamentals
 
Power transformer maintenance
Power transformer maintenancePower transformer maintenance
Power transformer maintenance
 
Power transformer maintenance
Power transformer maintenancePower transformer maintenance
Power transformer maintenance
 
Frequency response analysis for transformer tap changer damage detection
Frequency response analysis for transformer tap changer damage detectionFrequency response analysis for transformer tap changer damage detection
Frequency response analysis for transformer tap changer damage detection
 
circuit breaker
circuit breakercircuit breaker
circuit breaker
 
Electrical Checks And Measurements And Customer Requirements LEAP
Electrical Checks And Measurements And Customer Requirements LEAPElectrical Checks And Measurements And Customer Requirements LEAP
Electrical Checks And Measurements And Customer Requirements LEAP
 
Partial Discharge Techniques For Measuring Condition Of MV & HV Switchgear
Partial Discharge Techniques For Measuring Condition Of MV & HV SwitchgearPartial Discharge Techniques For Measuring Condition Of MV & HV Switchgear
Partial Discharge Techniques For Measuring Condition Of MV & HV Switchgear
 
Chakresh Tiwari Philips report
Chakresh Tiwari Philips reportChakresh Tiwari Philips report
Chakresh Tiwari Philips report
 
Transfomer diagnostics/sanjeet-1308143
Transfomer diagnostics/sanjeet-1308143Transfomer diagnostics/sanjeet-1308143
Transfomer diagnostics/sanjeet-1308143
 
3 phase transformer protection
3 phase transformer protection3 phase transformer protection
3 phase transformer protection
 
Prueba eléctrica de motores y generadores eléctricos - Calidad de Energía el...
Prueba eléctrica de motores  y generadores eléctricos - Calidad de Energía el...Prueba eléctrica de motores  y generadores eléctricos - Calidad de Energía el...
Prueba eléctrica de motores y generadores eléctricos - Calidad de Energía el...
 
Liquid Insulation Dissipation factor and Dielectric Factor Measurement Unit
Liquid Insulation Dissipation factor and Dielectric Factor Measurement UnitLiquid Insulation Dissipation factor and Dielectric Factor Measurement Unit
Liquid Insulation Dissipation factor and Dielectric Factor Measurement Unit
 
Transformer
TransformerTransformer
Transformer
 
CT and VT.pptx
CT and VT.pptxCT and VT.pptx
CT and VT.pptx
 
Edwin Newsletter on transformer failures on 13 October 2015
Edwin Newsletter on transformer failures on 13 October 2015Edwin Newsletter on transformer failures on 13 October 2015
Edwin Newsletter on transformer failures on 13 October 2015
 
BPMI TRANSFORMER PROTECTION.pptx.pdf
BPMI TRANSFORMER PROTECTION.pptx.pdfBPMI TRANSFORMER PROTECTION.pptx.pdf
BPMI TRANSFORMER PROTECTION.pptx.pdf
 
Devlopement of the dynamic resistance measurement (drm) method for condition ...
Devlopement of the dynamic resistance measurement (drm) method for condition ...Devlopement of the dynamic resistance measurement (drm) method for condition ...
Devlopement of the dynamic resistance measurement (drm) method for condition ...
 
H010514852
H010514852H010514852
H010514852
 
Tan Delta on MV Cables (Megger)
Tan Delta on MV Cables (Megger)Tan Delta on MV Cables (Megger)
Tan Delta on MV Cables (Megger)
 
Testing of transformer
Testing of transformerTesting of transformer
Testing of transformer
 

Recently uploaded

LLM Fine Tuning with QLoRA Cassandra Lunch 4, presented by Anant
LLM Fine Tuning with QLoRA Cassandra Lunch 4, presented by AnantLLM Fine Tuning with QLoRA Cassandra Lunch 4, presented by Anant
LLM Fine Tuning with QLoRA Cassandra Lunch 4, presented by Anant
Anant Corporation
 
Prediction of Electrical Energy Efficiency Using Information on Consumer's Ac...
Prediction of Electrical Energy Efficiency Using Information on Consumer's Ac...Prediction of Electrical Energy Efficiency Using Information on Consumer's Ac...
Prediction of Electrical Energy Efficiency Using Information on Consumer's Ac...
PriyankaKilaniya
 
DEEP LEARNING FOR SMART GRID INTRUSION DETECTION: A HYBRID CNN-LSTM-BASED MODEL
DEEP LEARNING FOR SMART GRID INTRUSION DETECTION: A HYBRID CNN-LSTM-BASED MODELDEEP LEARNING FOR SMART GRID INTRUSION DETECTION: A HYBRID CNN-LSTM-BASED MODEL
DEEP LEARNING FOR SMART GRID INTRUSION DETECTION: A HYBRID CNN-LSTM-BASED MODEL
ijaia
 
Engineering Standards Wiring methods.pdf
Engineering Standards Wiring methods.pdfEngineering Standards Wiring methods.pdf
Engineering Standards Wiring methods.pdf
edwin408357
 
Welding Metallurgy Ferrous Materials.pdf
Welding Metallurgy Ferrous Materials.pdfWelding Metallurgy Ferrous Materials.pdf
Welding Metallurgy Ferrous Materials.pdf
AjmalKhan50578
 
Optimizing Gradle Builds - Gradle DPE Tour Berlin 2024
Optimizing Gradle Builds - Gradle DPE Tour Berlin 2024Optimizing Gradle Builds - Gradle DPE Tour Berlin 2024
Optimizing Gradle Builds - Gradle DPE Tour Berlin 2024
Sinan KOZAK
 
2008 BUILDING CONSTRUCTION Illustrated - Ching Chapter 02 The Building.pdf
2008 BUILDING CONSTRUCTION Illustrated - Ching Chapter 02 The Building.pdf2008 BUILDING CONSTRUCTION Illustrated - Ching Chapter 02 The Building.pdf
2008 BUILDING CONSTRUCTION Illustrated - Ching Chapter 02 The Building.pdf
Yasser Mahgoub
 
一比一原版(osu毕业证书)美国俄勒冈州立大学毕业证如何办理
一比一原版(osu毕业证书)美国俄勒冈州立大学毕业证如何办理一比一原版(osu毕业证书)美国俄勒冈州立大学毕业证如何办理
一比一原版(osu毕业证书)美国俄勒冈州立大学毕业证如何办理
upoux
 
4. Mosca vol I -Fisica-Tipler-5ta-Edicion-Vol-1.pdf
4. Mosca vol I -Fisica-Tipler-5ta-Edicion-Vol-1.pdf4. Mosca vol I -Fisica-Tipler-5ta-Edicion-Vol-1.pdf
4. Mosca vol I -Fisica-Tipler-5ta-Edicion-Vol-1.pdf
Gino153088
 
Generative AI Use cases applications solutions and implementation.pdf
Generative AI Use cases applications solutions and implementation.pdfGenerative AI Use cases applications solutions and implementation.pdf
Generative AI Use cases applications solutions and implementation.pdf
mahaffeycheryld
 
Rainfall intensity duration frequency curve statistical analysis and modeling...
Rainfall intensity duration frequency curve statistical analysis and modeling...Rainfall intensity duration frequency curve statistical analysis and modeling...
Rainfall intensity duration frequency curve statistical analysis and modeling...
bijceesjournal
 
Redefining brain tumor segmentation: a cutting-edge convolutional neural netw...
Redefining brain tumor segmentation: a cutting-edge convolutional neural netw...Redefining brain tumor segmentation: a cutting-edge convolutional neural netw...
Redefining brain tumor segmentation: a cutting-edge convolutional neural netw...
IJECEIAES
 
Electric vehicle and photovoltaic advanced roles in enhancing the financial p...
Electric vehicle and photovoltaic advanced roles in enhancing the financial p...Electric vehicle and photovoltaic advanced roles in enhancing the financial p...
Electric vehicle and photovoltaic advanced roles in enhancing the financial p...
IJECEIAES
 
Applications of artificial Intelligence in Mechanical Engineering.pdf
Applications of artificial Intelligence in Mechanical Engineering.pdfApplications of artificial Intelligence in Mechanical Engineering.pdf
Applications of artificial Intelligence in Mechanical Engineering.pdf
Atif Razi
 
一比一原版(CalArts毕业证)加利福尼亚艺术学院毕业证如何办理
一比一原版(CalArts毕业证)加利福尼亚艺术学院毕业证如何办理一比一原版(CalArts毕业证)加利福尼亚艺术学院毕业证如何办理
一比一原版(CalArts毕业证)加利福尼亚艺术学院毕业证如何办理
ecqow
 
Software Engineering and Project Management - Introduction, Modeling Concepts...
Software Engineering and Project Management - Introduction, Modeling Concepts...Software Engineering and Project Management - Introduction, Modeling Concepts...
Software Engineering and Project Management - Introduction, Modeling Concepts...
Prakhyath Rai
 
Comparative analysis between traditional aquaponics and reconstructed aquapon...
Comparative analysis between traditional aquaponics and reconstructed aquapon...Comparative analysis between traditional aquaponics and reconstructed aquapon...
Comparative analysis between traditional aquaponics and reconstructed aquapon...
bijceesjournal
 
Data Driven Maintenance | UReason Webinar
Data Driven Maintenance | UReason WebinarData Driven Maintenance | UReason Webinar
Data Driven Maintenance | UReason Webinar
UReason
 
IEEE Aerospace and Electronic Systems Society as a Graduate Student Member
IEEE Aerospace and Electronic Systems Society as a Graduate Student MemberIEEE Aerospace and Electronic Systems Society as a Graduate Student Member
IEEE Aerospace and Electronic Systems Society as a Graduate Student Member
VICTOR MAESTRE RAMIREZ
 
1FIDIC-CONSTRUCTION-CONTRACT-2ND-ED-2017-RED-BOOK.pdf
1FIDIC-CONSTRUCTION-CONTRACT-2ND-ED-2017-RED-BOOK.pdf1FIDIC-CONSTRUCTION-CONTRACT-2ND-ED-2017-RED-BOOK.pdf
1FIDIC-CONSTRUCTION-CONTRACT-2ND-ED-2017-RED-BOOK.pdf
MadhavJungKarki
 

Recently uploaded (20)

LLM Fine Tuning with QLoRA Cassandra Lunch 4, presented by Anant
LLM Fine Tuning with QLoRA Cassandra Lunch 4, presented by AnantLLM Fine Tuning with QLoRA Cassandra Lunch 4, presented by Anant
LLM Fine Tuning with QLoRA Cassandra Lunch 4, presented by Anant
 
Prediction of Electrical Energy Efficiency Using Information on Consumer's Ac...
Prediction of Electrical Energy Efficiency Using Information on Consumer's Ac...Prediction of Electrical Energy Efficiency Using Information on Consumer's Ac...
Prediction of Electrical Energy Efficiency Using Information on Consumer's Ac...
 
DEEP LEARNING FOR SMART GRID INTRUSION DETECTION: A HYBRID CNN-LSTM-BASED MODEL
DEEP LEARNING FOR SMART GRID INTRUSION DETECTION: A HYBRID CNN-LSTM-BASED MODELDEEP LEARNING FOR SMART GRID INTRUSION DETECTION: A HYBRID CNN-LSTM-BASED MODEL
DEEP LEARNING FOR SMART GRID INTRUSION DETECTION: A HYBRID CNN-LSTM-BASED MODEL
 
Engineering Standards Wiring methods.pdf
Engineering Standards Wiring methods.pdfEngineering Standards Wiring methods.pdf
Engineering Standards Wiring methods.pdf
 
Welding Metallurgy Ferrous Materials.pdf
Welding Metallurgy Ferrous Materials.pdfWelding Metallurgy Ferrous Materials.pdf
Welding Metallurgy Ferrous Materials.pdf
 
Optimizing Gradle Builds - Gradle DPE Tour Berlin 2024
Optimizing Gradle Builds - Gradle DPE Tour Berlin 2024Optimizing Gradle Builds - Gradle DPE Tour Berlin 2024
Optimizing Gradle Builds - Gradle DPE Tour Berlin 2024
 
2008 BUILDING CONSTRUCTION Illustrated - Ching Chapter 02 The Building.pdf
2008 BUILDING CONSTRUCTION Illustrated - Ching Chapter 02 The Building.pdf2008 BUILDING CONSTRUCTION Illustrated - Ching Chapter 02 The Building.pdf
2008 BUILDING CONSTRUCTION Illustrated - Ching Chapter 02 The Building.pdf
 
一比一原版(osu毕业证书)美国俄勒冈州立大学毕业证如何办理
一比一原版(osu毕业证书)美国俄勒冈州立大学毕业证如何办理一比一原版(osu毕业证书)美国俄勒冈州立大学毕业证如何办理
一比一原版(osu毕业证书)美国俄勒冈州立大学毕业证如何办理
 
4. Mosca vol I -Fisica-Tipler-5ta-Edicion-Vol-1.pdf
4. Mosca vol I -Fisica-Tipler-5ta-Edicion-Vol-1.pdf4. Mosca vol I -Fisica-Tipler-5ta-Edicion-Vol-1.pdf
4. Mosca vol I -Fisica-Tipler-5ta-Edicion-Vol-1.pdf
 
Generative AI Use cases applications solutions and implementation.pdf
Generative AI Use cases applications solutions and implementation.pdfGenerative AI Use cases applications solutions and implementation.pdf
Generative AI Use cases applications solutions and implementation.pdf
 
Rainfall intensity duration frequency curve statistical analysis and modeling...
Rainfall intensity duration frequency curve statistical analysis and modeling...Rainfall intensity duration frequency curve statistical analysis and modeling...
Rainfall intensity duration frequency curve statistical analysis and modeling...
 
Redefining brain tumor segmentation: a cutting-edge convolutional neural netw...
Redefining brain tumor segmentation: a cutting-edge convolutional neural netw...Redefining brain tumor segmentation: a cutting-edge convolutional neural netw...
Redefining brain tumor segmentation: a cutting-edge convolutional neural netw...
 
Electric vehicle and photovoltaic advanced roles in enhancing the financial p...
Electric vehicle and photovoltaic advanced roles in enhancing the financial p...Electric vehicle and photovoltaic advanced roles in enhancing the financial p...
Electric vehicle and photovoltaic advanced roles in enhancing the financial p...
 
Applications of artificial Intelligence in Mechanical Engineering.pdf
Applications of artificial Intelligence in Mechanical Engineering.pdfApplications of artificial Intelligence in Mechanical Engineering.pdf
Applications of artificial Intelligence in Mechanical Engineering.pdf
 
一比一原版(CalArts毕业证)加利福尼亚艺术学院毕业证如何办理
一比一原版(CalArts毕业证)加利福尼亚艺术学院毕业证如何办理一比一原版(CalArts毕业证)加利福尼亚艺术学院毕业证如何办理
一比一原版(CalArts毕业证)加利福尼亚艺术学院毕业证如何办理
 
Software Engineering and Project Management - Introduction, Modeling Concepts...
Software Engineering and Project Management - Introduction, Modeling Concepts...Software Engineering and Project Management - Introduction, Modeling Concepts...
Software Engineering and Project Management - Introduction, Modeling Concepts...
 
Comparative analysis between traditional aquaponics and reconstructed aquapon...
Comparative analysis between traditional aquaponics and reconstructed aquapon...Comparative analysis between traditional aquaponics and reconstructed aquapon...
Comparative analysis between traditional aquaponics and reconstructed aquapon...
 
Data Driven Maintenance | UReason Webinar
Data Driven Maintenance | UReason WebinarData Driven Maintenance | UReason Webinar
Data Driven Maintenance | UReason Webinar
 
IEEE Aerospace and Electronic Systems Society as a Graduate Student Member
IEEE Aerospace and Electronic Systems Society as a Graduate Student MemberIEEE Aerospace and Electronic Systems Society as a Graduate Student Member
IEEE Aerospace and Electronic Systems Society as a Graduate Student Member
 
1FIDIC-CONSTRUCTION-CONTRACT-2ND-ED-2017-RED-BOOK.pdf
1FIDIC-CONSTRUCTION-CONTRACT-2ND-ED-2017-RED-BOOK.pdf1FIDIC-CONSTRUCTION-CONTRACT-2ND-ED-2017-RED-BOOK.pdf
1FIDIC-CONSTRUCTION-CONTRACT-2ND-ED-2017-RED-BOOK.pdf
 

Power-Transformer-Testing-Brochure-ENU.pdf

  • 1. Testing and diagnostics of power transformers
  • 2. 2 Know the condition of your transformer to get the most out of your During commissioning and operation it is essential that your power transformer is in good condition. Various influences can impact the expected lifetime throughout a transformer's lifecycle. Diagnostic testing and monitoring will help you to determine your asset's condition and choose the right corrective measures to ensure reliable operation and extend the transformer's life expectancy. Manufacturing Transformer condition Commissioning Negative influences on a transformer's life expectancy > Thermal influences Overload, overheating, ambient conditions > Aging Moisture, acids, oxygen, contamination, leakages > Mechanical influences Transportation damage, short-circuit stresses, seismic activity > Electrical influences Switching surges, lightning, overvoltages, short-circuit currents > Protection problems Underfunction, failure
  • 3. 3 asset Operation Transformer life expectancy Testing and corrective measures to extend a transformer's life expectancy > Maintain auxiliary components Tap changers, cooling system, breather > Recondition of insulation Drying, oil treatment, oil change > Replace parts Bushings, surge arresters, gaskets, pumps and fans
  • 4. 4 Transformer components and their detectable faults Component Detectable faults Bushings Partial breakdown between capacitive graded layers, cracks in resin-bonded insulation Aging and moisture ingress Open or compromised measuring tap connection Partial discharges in insulation CTs Current ratio or phase error considering burden, excessive residual magnetism, non-compliance to relevant IEEE or IEC standard Burden-dependent current ratio and phase displacement Shorted turns Leads Contact problems Mechanical deformation Tap changer Contact problems in tap selector and at diverter switch Open circuit, shorted turns, or high resistance connections in the OLTC preventative autotransformer Contact problems in the DETC Insulation Moisture in solid insulation Aging, moisture, contamination of insulation fluids Partial discharges Windings Short-circuits between windings or between turns Strand-to-strand short-circuits Open circuits in parallel strands Short-circuit to ground Mechanical deformation Contact problems, open circuits Core Mechanical deformation Floating core ground Shorted core laminates Residual magnetism
  • 5. 5 C a p a c i t a n c e a n d p o w e r f a c t o r / d i s s i p a t i o n f a c t o r m e a s u r e m e n t : a t 5 0 H z o r 6 0 H z a s t i p - u p t e s t w i t h v a r i a b l e f r e q u e n c y D C w i n d i n g r e s i s t a n c e m e a s u r e m e n t a n d O L T C v e r i f i c a t i o n T r a n s f o r m e r t u r n s r a t i o ( T T R ) m e a s u r e m e n t E x c i t i n g c u r r e n t m e a s u r e m e n t S h o r t - c i r c u i t i m p e d a n c e / l e a k a g e r e a c t a n c e m e a s u r e m e n t F r e q u e n c y r e s p o n s e o f s t r a y l o s s e s ( F R S L ) m e a s u r e m e n t D e m a g n e t i z a t i o n D i e l e c t r i c ( f r e q u e n c y ) r e s p o n s e a n a l y s i s S w e e p f r e q u e n c y r e s p o n s e a n a l y s i s ( S F R A ) C u r r e n t t r a n s f o r m e r a n a l y s i s P a r t i a l d i s c h a r g e a n a l y s i s P a r t i a l d i s c h a r g e l o c a l i z a t i o n Possible measurement methods ■ ■ ■ ■ ■ ■ ■ ■ ■ ■ ■ ■ ■ ■ ■ ■ ■ ■ ■ ■ ■ ■ ■ ■ ■ ■ ■ ■ ■ ■ ■ ■ ■ ■ ■ ■ ■ ■ ■ ■ ■ ■ ■ ■ ■ ■ ■ ■ ■ ■ ■ ■ ■ ■ ■ ■ ■ ■ ■ ■ ■ ■ ■ ■
  • 6. 6 TESTRANO 600 CPC 100 CPC 80 + CP TD1 Capacitance and power factor/dissipation factor measurement: at 50 Hz or 60 Hz ■1 ■1 ■ as tip-up test ■1 ■1 ■ with variable frequency ■1 ■1 ■ DC winding resistance measurement and OLTC verification ■ ■2 Transformer turns ratio (TTR) measurement ■ ■3 Exciting current measurement ■ ■1 Short-circuit impedance / leakage reactance measurement ■ ■ Frequency response of stray losses (FRSL) measurement ■ ■ Demagnetization ■ ■2 Dielectric (frequency) response analysis Sweep frequency response analysis (SFRA) Current transformer analysis ■ Partial discharge analysis Partial discharge localization Three-phase test set for the fastest and most compre- hensive diagnostic testing and condi- tion assessment of power transformers. Multi-functional test set for a com- prehensive condi- tion diagnosis and condition assess- ment of multiple high-voltage assets. Power/dissipation factor and capaci- tance test set, (including source and reference capacitor) for vari- ous high-voltage assets. The ideal solution for your individual needs and requirements/applic 1 Additional accessory CP TD1 required 2 Additional accessory CP SB1 required 3 Optional accessory CP SB1 available to speed up testing 4 Additional power supply and standard capacitor required
  • 7. 7 TANDO 700 DIRANA FRANEO 800 CT ANALYZER MPD 600 PDL 650 ■4 ■4 ■4 ■ ■ ■ ■ ■ ■ Ultra-precise test set for dissipa- tion/power factor and capacitance measurements on high-voltage assets (with an external source and refer- ence capacitor) Lightweight test set for fast and reliable moisture content determination of oil-paper insulated power transformers. Smart test set for sweep frequency response analysis (SFRA) on power transformer core and windings. Highly accurate and lightweight test set for current trans- former calibration and verification. High-end test set for partial discharg- es analysis in high- voltage assets. Test set for conve- nient partial dis- charge localization in power transform- ers. ation
  • 8. 8 What can be tested? ü Bushings CTs Leads Tap changer ü Insulation Windings Core Capacitance and power factor/dissipation factor measurement Why measure? Capacitance and power factor/dissipation factor (PF/DF) measurements are performed to investigate the condition of the insulation of power transformers and bushings. Both insulation systems are essential for the reliable operation of the transformer. High oil conductivity, aging and an increase in the water content are symptoms of the degradation process in the insulation. These symptoms also result in an increase of losses, which can be quantified by measuring the power factor or dissipation factor. Changes in capacitance can indicate partial breakdown between the capacitive layers of bushings. By measuring the capacitance and losses, problems in the insulation can be detected before a failure occurs. One of the major causes for transformer outages is the replacement of bushings due to a deterioration or failure of the insulation. CP TD1 combined with TESTRANO 600 or CPC 100/80 allows capacitance and power factor/dissipation factor measurement. DIRANA and TANDO 700 can be used for advanced diagnostics or in the laboratory. CA CB CC CD CE CF The capacitive layers of a bushing LV CL CHL CH HV
  • 9. 9 0.001 0.01 0.1 1 10 0.0001 0.001 0.01 0.1 1 10 100 1000 tan( δ) Frequency in Hz wet, good oil dry, bad oil dry, good oil wet, bad oil 0.001 0.01 0.1 1 10 15 50 85 120 155 190 225 260 295 330 365 400 tan( δ) Frequency in Hz wet, good oil dry, bad oil dry, good oil wet, bad oil How does it work? On power transformers, measurements are performed on the main insulation between the windings (CHL ) and the insulation from the windings to the tank (CH , CL ). The windings are shorted and the test voltage is applied to one winding while the current through the insulation is measured on the opposite winding or the tank. On bushings, the voltage is applied to the main conductor while measuring the current on the measurement tap. The dissipation factor, also called tan(δ), is calculated via the tangent of the angle δ between the measured current and the ideal current which would occur if no losses would existed. The power factor is the cosine of the angle φ, therefore also called cos(φ), between the output voltage and the measured current. Using frequencies other than line frequency increases the sensitivity of the measurement as some problems are more dominant at frequencies above or below line frequency. Modern test devices can perform automatic frequency or voltage sweeps. Depending on the test device, different frequency ranges can be measured, e.g. from 15 Hz to 400 Hz with TESTRANO 600 and from 10 μHz to 5 kHz with DIRANA. The tan(δ) of four different transformers below and above line frequency (50 Hz). The dielectric losses cause a phase shift t i(t) δ = Reference current Test object current Phase shift δ φ I U I C IR tan( ) = δ IR IC cos( ) = IR I φ t i(t) δ = Reference current Test object current Phase shift δ φ I U I C IR tan( ) = δ IR IC cos( ) = IR I φ
  • 10. 10 Capacitance and power factor/dissipation factor measurement Good to know ... After the measurements have been completed, it is beneficial to compare the values to previous results and reference values mentioned in the relevant standards for the tested asset. A rise in capacitance of more than 10 % compared to previous results is normally considered to be dangerous for bushings. It indicates that a part of the insulation distance is already compromised and the dielectric stress to the remaining insulation is too high. An additional voltage tip-up test can detect bad contacts of the bushing layers or the measurement tap. They can be recognized by a decreasing PF/DF. Standard PF/DF measurements at 50 Hz or 60 Hz can only detect the effects of moisture and aging at an advanced stage. By performing the measurement across a wider frequency range, these effects can be detected at an earlier stage allowing for a longer reaction time to schedule corrective action. If a high PF/DF is detected, dielectric response analysis can be used as a supplementary diagnostic method. This broadband dielectric measurement can be used to determine whether the high PF/DF is caused by moisture or a high oil conductivity. Typical values for power factor/dissipation factor of bushings at line frequency and at 20°C/68°F according to international standards Typical values for power factor/dissipation factor of transformers, depending on the used insulating liquid at 20°C/68°F according to international standards (IEEE C.57-152) Insulating liquid kV rating Nominal/new PF/DF limit Serviceability aged limit Mineral oil < 230 kV 0.5 % 1.0 % Mineral oil ≥ 230 kV 0.5 % 1.0 % Natural oil All 1.0 % 1.0 % Insulation type New bushings IEEE C57.19.01 IEC 60137 Resin impregnated paper (RIP) 0.3 % ... 0.4 % < 0.85 % < 0.70 % Oil impregnated paper (OIP) 0.2 % ... 0.4 % < 0.50 % < 0.70 % Resin bonded paper (RBP) 0.5 % ... 0.6 % < 2.00 % < 1.50 %
  • 11. 11 Our solutions ... We offer a wide range of solutions for capacitance and power factor/dissipation factor (tan δ) measurements. They range from mobile solutions for comfortable on-site testing, through high precise solutions for laboratory use, up to dedicated test sets for advanced power transformer condition diagnosis, such as moisture determination. Measurement range Typical application TESTRANO 600 + CP TD1 0 ... 12 kV 15 Hz ... 400 Hz Dedicated condition diagnosis of power transformers on-site and during manufacturing CPC 100 + CP TD1 0 ... 12 kV 15 Hz ... 400 Hz General condition diagnosis of multiple assets on-site and during manufacturing CPC 80 + CP TD1 0 ... 12 kV 15 Hz ... 400 Hz Dedicated power factor/dissipation factor testing of multiple assets on-site and during manufacturing TANDO 700 Voltage depending on external source 5 Hz ... 400 Hz High-voltage laboratory tests, e.g. for routine and type tests or material tests of multiple assets DIRANA max. 200 Vpeak 50 μHz ... 5 kHz Advanced condition diagnosis and moisture determination in oil-paper insulation
  • 12. 12 What can be tested? Bushings CTs ü Leads ü Tap changer Insulation ü Windings Core DC winding resistance measurement and OLTC verification Why measure? Winding resistance measurements are performed for assessing possible damage in windings or contact problems, such as from the bushings to the windings, the windings to the tap changer, etc. They are also used to check the on-load tap changer (OLTC) as they can indicate when to clean or replace OLTC contacts, or when to replace or refurbish the OLTC itself. Failures can be detected without opening the tap changer compartment. How does it work? To measure the winding resistance, the winding must be charged until the core is saturated. The resistance can then be determined by measuring DC current and DC voltage. For tapped windings, this should be done for every tap position, hence testing the OLTC and the winding together. There are two common approaches for this test: static and dynamic winding resistance measurements. Static winding resistance measurements are the most common and easiest way to check for issues regarding the winding and OLTC. It investigates the resistance of each subsequent tap position and compares it with the reference measurement data of the manufacturer. Dynamic resistance measurements are performed as a supplementary measurement in order to analyze the transient switching process of a resistive diverter OLTC. It investigates the switching process of the diverter switch itself. When switching the tap changer during winding resistance measurements, the DC current temporarily decreases and this behaviour is recorded and analyzed. TESTRANO 600, as well as CPC 100 + CP SB1, allows static and dynamic resistance measurements of power transformers with no additional need for rewiring. OLTC The specially designed Kelvin clamps ensure 4-wire connection technique for precise resistance results.
  • 13. 13 Good to know ... For DC winding resistance, the results should not differ more than 1 % compared to the reference measurement. In addition, differences between phases are usually less than 2-3 %. When comparing winding resistance measurements, the results have to be temperature corrected. The usual reference temperature is 75 °C / 167 °F. A transformer turns ratio measurement can be used to confirm an open circuit while a frequency response analysis can be used to confirm contact problems. In both cases an additional gas analysis can indicate hot spots in the transformer. However, gas signatures are not unique and, thus, do not allow for the identification of the root cause. During DC winding resistance measurements the core of the transformer may be magnetized. Therefore, it is recommended to demagnetize the core after performing this test. Why use TESTRANO 600? > > Three-phase measurement of HV and LV windings without reconnection using up to 33 A DC > > Single-phase measurement of low ohmic windings using up to 100 A DC > > Automatic tap changer control and measurement of OLTC motor current and voltage > > Demagnetize the core and measure turns ratio without changing any leads Why use CPC 100 + CP SB1? > > Measurement of all three phases without reconnection using CP SB1 with up to 6 A DC > > Single-phase measurement of low ohmic windings with up to 100 A DC > > Automatic tap changer control using CP SB1 Winding resistance per tap, recorded using the static winding resistance measurement. Winding Resistance per Tap Taps 0.33 Ω 0.28 Ω 0.23 Ω 0.18 Ω 0.13 Ω 1 3 5 7 9 11 13 15 17 19 21 23 25 Phase B Phase A Phase C Transient current during switching process of resistive diverter OLTC, recorded using the dynamic resistance measurement. 0 ms 50 ms 100 ms 150 ms 200 ms 1.6 A 1.8 A 2 A 2.2 A 2.4 A 2.6 A 2.8 A 3 A
  • 14. 14 What can be tested? Bushings CTs Leads Tap changer Insulation ü Windings Core Transformer turns ratio (TTR) measurement Why measure? Transformer turns ratio (TTR) measurements are performed to verify the fundamental operating principle of a power transformer. By measuring the ratio and phase angle from one winding to the other, open circuits and shorted turns can be detected. The turns ratio is determined during factory acceptance tests (FAT) and needs to be checked routinely once the transformer is in service. TTR measurements can also be triggered by a tripped relay and other diagnostic tests like dissolved gas analysis (DGA) and dissipation factor/power factor measurements. How does it work? When using a single-phase source, the test voltage is applied to each phase of one winding and measured on both the high-voltage and corresponding low-voltage winding of the same leg. By using a three-phase source, the same measurement can be performed on all three phases at the same time. The calculated ratio can then be compared to the factory results which are available on the nameplate. The voltage on HV and LV is measured and the ratio is calculated depending on the vector group. TESTRANO 600, as well as CPC 100 + CP SB1, allows transformer turns ratio measurements of power transformers with no additional need for rewiring. UHV ULV
  • 15. 15 Good to know ... Results are compared with nameplate values and across phases. According to IEC 60076-1 and IEEE C57.152 the measured values should not deviate more then 0.5 % from the nominal ratio. The turns ratio is usually measured from the high-voltage to the low-voltage winding, in order to avoid unsafe voltage on the measurement inputs. A magnetized core or missing ground reference may influence the measurement and lead to incorrect results. Making sure the transformer core is demagnetized and proper grounds are established on each winding is therefore very important. To confirm or eliminate a suspected problem, an additional exciting current test is useful to diagnose short-circuited conditions, while DC winding resistance tests are very sensitive to open-circuited conditions. Why use TESTRANO 600? > > True three-phase measurement to determine the ratio and phase displacement of any winding configuration > > Measurements up to 400 V AC (L-L) without reconnection > > Same wiring used to test DC winding resistance, no lead change required > > Automatic tap changer control built into the unit, no accessory required Why use CPC 100 + CP SB1? > > Measurement of all three phases without reconnection with up to 300 V AC (L-L) using CP SB1 > > Perform single-phase measurements with up to 2 kV AC > > Automatic tap changer control using CP SB1 The TTR is measured for all three phases at each tap position. According to international standards the results should not deviate more than 0,5 % from the nominal nameplate values.
  • 16. 16 What can be tested? Bushings CTs Leads Tap changer Insulation ü Windings ü Core Exciting current measurement Why measure? Exciting current measurements are performed to assess the turn-to-turn insulation of the windings, the magnetic circuit of a transformer as well as the tap changer. The most valued benefit of the test is to detect turn-to-turn short-circuits in a winding. Physical movement of the core laminations severe damage of the core can influence the reluctance and, thus, will result in a change in exciting current. Deviations may also indicate contact wear or improper wiring of the tap changer. How does it work? The exciting current test is measured under no-load conditions. Therefore, an AC voltage is applied to one side of the transformer (usually the high-voltage side) while the opposite side is left open. The magnitude of the current drawn in the primary winding is proportional to the energy required to force the transformer action, i.e. induce a voltage in the secondary winding. It is recommended to select the highest test voltage within the limitations of the test set and the winding, in order to detect turn-to-turn short-circuit faults. A standard test voltage is 10 kV. The test connections will vary depending on the winding configuration. In general, neutral bushings on the energized winding, if present, should be connected to the low-voltage return lead. Neutral bushings on the open winding should be grounded, if also grounded in service. TESTRANO 600, as well as CPC 100 + CP SB1, allows exiting current measurements of power transformers with no additional need for rewiring.
  • 17. 17 Good to know ... Exciting current test should be compared among phases and tap positions. Depending on the construction of the transformer and number of legs, the results should show a distinct phase pattern with either two or three similar phases (HLH, LHL, HHH). The similar phases should not deviate more the 5 % to 10 % from each other. If all three phases show different exciting currents, further investigation is recommended. The dissimilar phase pattern could be caused by a magnetized core or a winding problem. As mentioned above, residual magnetism in the core can influence the results. In this case the transformer should be demagnetized and the test repeated. In addition to the phase pattern, results should also show a distinctive pattern across all tap positions which may vary depending on the type of tap changer. Even if the specific tap changer pattern is not known, it should be the same for all phases. Short-circuited turns can also be confirmed by transformer turns ratio (TTR) measurements, while sweep frequency response analysis (SFRA) tests are helpful to confirm or further diagnose problems in the core. Why use TESTRANO 600 or CPC 100? > > Perform exciting current tests at the usual test voltage of 10 kV, using CP TD1 > > Determine exciting currents while measuring turns ratio > > Determine exciting currents of all three phases without reconnection A typical HLH phase pattern of a three-legged transformer with two similar high values on the outer phases and one lower value on the center phase.
  • 18. 18 What can be tested? Bushings CTs Leads Tap changer Insulation ü Windings Core Short-circuit impedance / leakage reactance measurement Why measure? Short-circuit impedance / leakage reactance measurements are sensitive methods to assess possible deformation or displacement of windings. Severe short-circuits or transportation of the power transformer may cause the windings to move or become deformed. In events like these, short-circuit impedance / leakage reactance tests are recommended. The tests are usually performed as a three-phase measurement which can be compared to the nameplate value established by the manufacturer during factory acceptance tests. As this value represents the average across all three phases, a per- phase measurement is also recommended for winding diagnosis. How does it work? An AC source is connected to each phase of the high-voltage winding. During the three-phase measurement, all three phases of the low-voltage side are shorted without connecting the neutral terminal, when present. For the per-phase test, the short-circuit is only applied on the corresponding winding on the low voltage side. The current and the voltage across the high-voltage winding are measured in amplitude and phase. Finally, the short-circuit impedance is calculated by considering the specific transformer ratings. TESTRANO 600, as well as CPC 100, allows short-circuit impedance / leakage reactance measurements on power transformers. The TESTRANO 600 can perform a true three- phase measurement without any rewiring. Фσ1 Leaka Main
  • 19. 19 Good to know ... The short-circuit impedance obtained from the three-phase measurement should not deviate more than 3 % from the nameplate value. However, higher deviations do not automatically confirm winding deformation. In order to do so, at least one of the per-phase leakage reactance test results must fail. Each phase result should be compared to the average of all three measurements of the per-phase test. In most cases deviations from the average will be less than 1 % and should not exceed 2-3 %. The results of the per-phase test cannot be compared to the nameplate value. The leakage reactance represents only the reactive part of the short-circuit impedance. However both terms are used synonymously to refer to the same test method. In addition, a sweep frequency response analysis (SFRA) can be performed to further investigate winding movement and deformation. Why use TESTRANO 600? > > True three-phase measurement to determine the short-circuit impedance without reconnection > > Similar test method as used during factory acceptance tests > > Same wiring used as for FRSL measurements Why use CPC 100? > > Single-phase measurements to determine three-phase equivalent and per-phase short-circuit impedance > > Same wiring used as for FRSL measurements The short-circuit impedance is calculated based on the measured three-phase results and the power ratings of the transformer. Then, it is compared to the nominal value on the transformer nameplate. Ф12 Фσ2 age flux n flux The leakage reactance represents the leakage flux, which is the flux not fully contained in the core. A shift or deformation of the windings will change the reluctance of the leakage path and, thus, the reactance. Transformer Type Serial No. Year: Manufacturing 1966 DB Operation V A V A V A % t Hz 50 S Yd11 Cooling Vector Group Power P: PRIM TERT SEC kVA Rated Voltage Impedances: Weight: PRIM-TERT Total Oil Active Part Shipping TERT-SEC PRIM-SEC ODL 16 000 / 110 561525 12 000 12 000 12 62 00 11 00 00 9 38 00 54.9 53.0 73.9 10 600 9.45 8.45 8.15 424 17.6 18 41 1 13 25
  • 20. 20 What can be tested? Bushings CTs Leads Tap changer Insulation ü Windings Core Frequency response of stray losses (FRSL) measurement Why measure? The frequency response of stray losses (FRSL) test is a measurement of the resistive component of the short-circuit impedances at multiple frequencies. It is the only electrical method to identify short-circuits between parallel strands and local overheating due to excessive eddy current losses. Similar to the short-circuit and leakage reactance test, it is recommended to perform the FRSL measurement as a commissioning or acceptance test to establish benchmark results. Likewise FRSL tests are not routine diagnostic tests, but are recommended for advanced diagnostics. The test can also be performed as a three-phase or per-phase test. How does it work? The test setup and procedure of the FRSL test is the same as for short-circuit impedance/leakage reactance testing and can be performed simultaneously. An AC source is connected to each phase of the high-voltage winding. During the three-phase measurement, all three phases of the low voltage side are shorted without connecting the neutral terminal, when present. For the per-phase test, the short-circuit is only applied on the corresponding winding of the low voltage side. From the measured current, voltage and phase displacement the resistive component of the short-circuit impedance is calculated at discrete frequencies between 15 and 400 Hz. As the eddy losses in the transformer become more pronounced at higher frequencies, a rise in the resistive component can be observed by plotting the results over the range of frequencies. FRSL measurements cover a wider frequency range compared to short-circuit impedance/leakage reactance measurements. TESTRANO 600 as well as CPC 100 allows for measuring the frequency response of stray losses (FRSL). The TESTRANO 600 can perform a true three-phase measurement without any rewiring. FRSL Short-circuit impedance / leakage reactance Hz Z 15 50/60 400
  • 21. 21 Good to know ... The analysis of FRSL results is largely visual and includes the comparison across phases and over time. Because the eddy losses are proportional to the frequency, an increase in impedance can be observed over the range of frequencies. This increase should be uniform across all three phases, resulting in a smooth, exponential curve. Deviations as low as 3 %, especially in the higher frequencies, may already indicate a strand-to-strand short-circuit condition. FRSL results should be cross-checked by performing dissolved gas analysis (DGA). Many of the problems which can be diagnosed using FRSL produce combustible gases. For example, short-circuit strands may cause higher than normal overheating, which could be detected by DGA. The most common problems which may result in misleading FRSL results are bad connections and small cross sections of the applied short-circuit jumper. In this case, a vertical offset between the phases can be observed. Why use TESTRANO 600? > > True three-phase measurement to measure FRSL without reconnection > > Same wiring used to test short-circuit impedance / leakage reactance tests Why use CPC 100? > > Single-phase measurements to measure three- phase equivalent and per phase FRSL > > Same wiring used to test short-circuit impedance / leakage reactance tests Frequency in Hz 0 0.0 Ω 0.5 Ω 1.0 Ω 1.5 Ω 2.0 Ω 2.5 Ω 3.0 Ω Resistance 3.5 Ω 4.0 Ω 4.5 Ω 50 100 150 200 250 300 350 400 Phase B Phase A Phase C Acceptable FRSL results Frequency in Hz 0 50 mΩ 100 mΩ 150 mΩ 200 mΩ 250 mΩ 300 mΩ Resistance 50 100 150 200 250 300 350 400 Phase B Phase A Phase C FRSL results indicate short-circuit in parallel strands in phase C winding
  • 22. 22 What can be tested? Bushings CTs Leads Tap changer Insulation Windings ü Core Demagnetization Why measure? Whenever a power transformer is isolated from the power system, residual magnetism remains in its core due to a phase shift. Residual magnetism also remains after a DC voltage has been applied to the transformer core, for example during routine winding resistance tests in the field or factory. Due to residual magnetism in the core, high inrush currents, up to the maximum short-circuit current, can occur. This puts undesired stress on the transformer when it is switched back into service. In addition, many diagnostic measurements can be affected by residual magnetism, making a reliable assessment very difficult. Therefore, it is recommended to demagnetize the core both before switching the transformer back into service and after DC voltages have been applied during diagnostic testing. How does it work? First, the core is saturated in both directions then the specific hysteresis parameters are determined and the initial flux is calculated. Based on these parameters, an iterative algorithm is used to reduce the applied flux by adapting both voltage and frequency. Using multiple iterations, the core is demagnetized to below 1 % of its maximum value. The described approach for demagnetization of a power transformer's core based on the measurement of the magnetic flux works reliably for both small and large power transformers. U t H B Voltage is injected to saturate the core in both positive and negative directions. TESTRANO 600, as well as CPC 100 + CP SB1, allows demagnetization of power transformers.
  • 23. 23 SFRA measurement before demagnetization SFRA measurement after demagnetization Good to know ... The demagnetization of the power transformer's core minimizes the risk for personnel and equipment when switching the transformer back into service. It is also recommended to demagnetize the transformer before performing exciting current, sweep frequency response analysis (SFRA) or magnetic balance tests. All these measurements will be affected by a magnetized core which may lead to a false interpretation of the results. An important aspect of a successful demagnetization is to constantly monitor the magnetic flux (ф) in the core during the demagnetization process. Why use TESTRANO 600 or CPC 100 + CP SB1? > > Fast and reliable demagnetization of the power transformer core > > Measurement of initial remanence for further diagnosis, e.g. of unexpected exciting current test results > > Demagnetization to below 1 % of core's maximum value Inrush current Linked flux Time Linked flux, current High inrush current occurs due to residual magnetism and can jeopardize a transformer when it is switched back into service. SFRA measurement on phase A: The shift in resonance points shows how the measurement is affected by the magnetized core.
  • 24. 24 What can be tested? Bushings CTs ü Leads Tap changer Insulation ü Windings ü Core Sweep frequency response analysis (SFRA) Why measure? Sweep frequency response analysis (SFRA) is used to identify mechanical or electrical problems in power transformer windings, contacts or cores. Severe short-circuits or shocks during the transformer's transportation may cause the winding to move or become deformed. Since the IEC 60076-18 standard was introduced, this method has become one of the common electrical tests and its acceptance on the market has increased accordingly. SFRA tests are recommended to be performed at the end of the acceptance test at the manufacturer's to establish the transformer's original fingerprint and then again after transportation, and during commissioning. How does it work? Power transformers can be seen as a complex electrical network of capacitance, inductances and resistors. Each electrical network has its own unique frequency response. A sinusoidal excitation voltage with a continuously increasing frequency is injected into one end of the transformer winding and the response signal returning from the other end is measured. The comparison of input and output signals generates a unique frequency response, which can be compared with the reference fingerprint. Changes, movement or deformation of internal components lead to changes in this transfer function and can be identified by comparing the plots. The correct connection technique ensures reproducible result. � �  FRANEO 800 allows reliable core and windings diagnosis of power transformers by using sweep frequency response analysis (SFRA).
  • 25. 25 Good to know ... SFRA is based on the comparison of a current test with a reference test. When such a fingerprint is not available, results of another phase or a similar transformer can also be used for comparison. These detected faults can be confirmed by other measurements, such as DC winding resistance, frequency response of stray losses (FRSL), short-circuit impedance / leakage reactance, exciting current, or transformer turns ratio (TTR) measurement. SFRA is a non-invasive method. It allows the reliable assessment of a power transformer's integrity without applying high-voltages. No other method is as sensitive to mechanical deformations of the active part of power transformers as SFRA. Why use FRANEO 800? > > Widest dynamic measuring range in the industry (> 150 dB) > > Reproducible results thanks to innovative connection technique, based on IEC 60076-18, Method 1 > > Operating with Primary Test ManagerTM , thus guided workflow for test set-up, execution and assessment for easy analysis without expert knowledge > > Fast measurement times due to intelligent sweep algorithms > > Small and lightweight equipment guarantees optimum usability PTM offers automatic result assessment and comparison, also typical influences for deviations can be visualized.
  • 26. 26 What can be tested? ü Bushings CTs Leads Tap changer ü Insulation Windings Core Dielectric (frequency) response analysis Why measure? Dielectric response analysis, also known as dielectric frequency response analysis, is used to assess the moisture content of the cellulose insulation and, thus, determine its condition. Moisture in oil-paper insulated power transformers is produced by paper aging or enters the transformer via leaky seals or breathing. It leads to a reduced breakdown strength and an increased aging of the insulation. Knowing the moisture content is important for the condition assessment of the power transformer and its bushings. This measurement is also used for new transformers to prove the low moisture content after the drying process. How does it work? The main amount of cellulose insulation in the active part of a power transformer is located between the primary and secondary winding. To measure this insulation, the output is connected to the high-voltage winding and the input to the low-voltage winding. Unwanted capacitive and resistive currents are bypassed by the guard connection which is applied to the tank. The power factor/dissipation factor of this insulation is measured over a wide frequency range. The resulting curve contains information about the insulation condition. The very low frequencies contain information on moisture in the solid insulation, while the position of the slope in the mid range frequencies indicates the conductivity of the liquid insulation. This curve is automatically compared to model curves and the moisture content of the cellulose insulation is calculated. LV CL CHL CH HV DIRANA determines the moisture content of oil-paper insulated power transformers and also assesses the condition of bushings by using dielectric response analysis.
  • 27. 27 Why use DIRANA? > > Reliable moisture determination of power transformers and oil-impregnated-paper (OIP) bushings. > > Provides extremely short measurement times by combining measurement methods (FDS and PDC+) > > Wide frequency range (10 µHz ... 5 kHz) Good to know ... This method is also scientifically approved by CIGRÉ. There are no other non-invasive ways to assess moisture in a transformer which provide comparable accuracy. The moisture content is directly determined in the cellulose and not deduced from the moisture in the oil. Thus, the method is applicable at all temperatures and there is no need to wait until moisture equilibrium between paper and oil has been reached. The assessment is performed according to IEC 60422 which provides categories for moisture levels. The dielectric response curve allows conclusions to be drawn about the different factors that influence the measurement result. Frequency in Hz 0.0001 0.001 0.01 0.1 1.0 10 50 100 0.005 0.01 0.02 0.05 0.10 0.2 0.5 1.0 2.0 1000 0.001 low water (0,3 wt.%), good oil moderate water (2 wt.%), bad oil wet (3,3 wt.%), good oil Tan Delta 0.1 1 Moisture and aging of cellulose Insulation Geometry Oil conductivity 0.01 0.001 Frequency 0.001 Hz 1 Hz 1000 Hz Dissipation Factor
  • 28. 28 What can be tested? Bushings ü CTs Leads Tap changer Insulation Windings Core Current transformer analysis Why measure? The bushing current transformers (CTs) are tested by power transformer manufacturers during the final acceptance test, whereas substation operators test during commissioning. The tests check if the CTs send correct signals to the substation’s protection system. Wrong signals lead to maloperation of the protection system which may damage the connected assets. Checked parameters are the CT accuracy, including CT ratio error and phase displacement, accuracy for different burdens, CT winding resistance, CT excitation characteristics, ALF and FS. All tests are performed in compliance with the standards: IEC 60044-6, IEC 60044-1, IEC 61869-2, IEEE C57.13 How does it work? Each phase is tested separately, the other phases must be short-circuited. A voltage is applied via the secondary side. This produces the magnetic force and the magnetic flux density in the CT core. The ratio error is calculated using the burden and the data of the CT model (equivalent circuit diagram), whose parameters are determined. No high-current source is needed and the test must only be performed once, even when the CT must later be assessed using further burdens and primary currents. All relevant CT parameters are accurately measured, considering the CT's burden and excitation characteristics. CT Analyzer performs diagnostic tests on bushing CTs.
  • 29. 29 Good to know ... The cycles and values for diagnostic tests on bushing current transformers (CTs) are defined in the respective standards and in the commissioning guidance of CT operators. The CT error is determined for different connection methods of a transformer's windings. A polarity check verifies correct polarity of the CT and of the CT winding. The excitation curve is measured and the kneepoints are calculated. Remanence is measured and the CTs are demagnetized to avoid maloperation of the protection relay. The larger the impedance of the burden, the smaller the margin until saturation is reached. Saturation of the core is reached when magnetization does not increase anymore while the external magnetic field strength is further increased. The result is a massive decrease of the CT efficiency and performance. When measuring ratio of CTs mounted at the bushing of the transformer winding terminals, the voltage injection method is used instead of the current injection method due to the impedance of the transformer winding. For this method, a test voltage is applied to the secondary side of the CT and a voltage measurement is taken at the bushing terminals of the transformer windings. This test can also be performed using CPC 100 to check ratio, polarity and CTs protection class. Why use CT Analyzer? > > Automatic demagnetization of CTs avoids maloperation of protection system > > Automatic test report generation according to the standards > > The secondary voltage injection method is the only way for testing bushing CTs already connected to power transformers > > Extremely high accuracy (0.02 % typical) up to the 0.1 accuracy class > > Compact and lightweight design (< 8 kg / 17.4 lbs) Different test cards support you in checking and assessing relevant CT parameters such as ratio, resistance and its protection class.
  • 30. 30 What can be tested? ü Bushings CTs Leads Tap changer ü Insulation ü Windings Core LV HV Partial discharge analysis Why measure? Partial discharge (PD) can damage insulation materials in power transformer bushings and windings. This can lead to their failure and costly outages. PD is observed in power transformer bushings and windings if the insulation material between different voltage potentials is aged, contaminated or faulty. PD measurement is a reliable and non-destructive method used to diagnose the condition of a power transformer insulation system. It is performed during factory acceptance, on-site commissioning and routine maintenance testing to detect critical defects and assess risks. How does it work? When measuring and analyzing PD activity in power transformers, the particular tests and test set-ups are determined by the type of transformer and to which standard the measurements are performed. Depending on the type of bushings used, the PD analysis system is connected either to the capacitive tap of the bushings or to an external coupling capacitor. This allows electrical PD measurements on the transformer. PD is measured either in µV (according to IEEE standards) or in pC (according to the IEC 60270 standard). Advanced noise suppression techniques are commonly deployed in high-interference environments to minimize irrelevant data. For synchronous multi-channel PD measurements, e.g. for three-phase testing, at least three MPDs are needed for connection to the HV bushings. C2’ C3’ C1’ Void HV LV / GND Insulation
  • 31. 31 Good to know ... PD can also be directly measured inside the tank of liquid- insulated transformers using ultra-high frequency (UHF) sensors. UHF PD measurements can be used as an effective gating method to verify results – PD pulses from an electrical measurement at the bushings are only accepted if a UHF pulse from the transformer tank is also present. Once PD activity is detected, acoustic PD measurements can be performed to accurately locate transformer defects. For on-going risk management, an on-line dielectric condition monitoring system can be installed to continuously evaluate the insulation state of bushings and transformers. Why use MPD 600? > > Fiber optic data transmission for safe operation and improved signal-to-noise ratio > > Simultaneous and synchronous multi-channel PD measurement for more complete analysis > > Active noise suppression and gating methods for optimal accuracy despite high interference > > Powerful tools (3PARD and 3FREQ) for separating noise and multiple PD sources > > MPD TransformerTest software module enables reliable QIEC and/or RIV measurements during factory acceptance tests The detected PD cluster can be visualized in detail by using the PRPD histogram. Noise A 3PARD (3-Phase Amplitude Relation Diagram) separates PD sources from noise PD cluster MPD W MPD U MPD V
  • 32. 32 What can be tested? Bushings CTs Leads Tap changer ü Insulation ü Windings Core Partial discharge localization Why measure? Partial discharge (PD) can cause irreversible damage to power transformer insulation, long before the insulation actually fails. Even upon detection and analysis, it is essential to know exactly where insulation defects are located in the transformer. Through acoustic PD measurements, weak points or defects in the insulation can be precisely located. Once the exact defect location is known, remedial steps can be efficiently planned and executed to prevent failure. Acoustic PD measurements are conducted after PD has been detected during factory acceptance tests, and are an integral part of on-site diagnosis measurements during the service life of power transformers. How does it work? Multiple acoustic sensors are magnetically mounted to the surface of a power transformer tank. Each sensor measures the acoustic signal propagation time from the PD source to the tank wall. Defect location is then calculated based on time differences, sensor position and propagation speed. The data gathered by these sensors is compared simultaneously to accurately identify the defect location. The IEEE C57.127-2007 standard describes the typical workflow of an acoustic measurement. Multiple acoustic sensors spread over the transformer wall help to locate the defect. PDL 650 setup at a power transformer with four acoustic sensors.
  • 33. 33 Good to know ... Dissolved gas analysis (DGA) can indicate PD activity, but it cannot actually localize it in power transformers. Acoustic PD measurements are therefore performed if DGA results show evidence of PD. The combination of electrical and ultra-high frequency (UHF) PD detection measurements can be used to trigger an acoustic PD measurement. This method ensures optimal PD localization in environments with heavy interference. Acoustic PD measurements are performed while power transformers are online. This eliminates the need for an outage to keep the transformer in full service. Why use PDL 650? > > Modular, lightweight design for easy transportability and on-site setup > > Safe due to galvanic separation of operator from high-voltage > > 3D visualization enables users to clearly see defect locations inside the transformer > > Electrical triggering in combination with the MPD 600 and UHF sensors ensures optimal PD localization in noisy environments 3D model of the transformer reveals the exact PD location.
  • 34. 34 Welcome to the team At OMICRON you can always depend on an experienced team that actively supports you and an infrastructure that you can rely on. We always listen attentively in order to understand your needs so that we can offer you the best possible solutions. We strive for lasting partnerships and ensure that you can continue to rely on your product long after you've purchased it. In order to do this, we focus on quality, the transfer of knowledge and unique customer support. Charles, Wenyu and René are able to tell you about the services we have available for you and why it pays to be part of the team. A strong and safe connection Charles Sweetser Application Specialist Solutions you can rely on... ... developed with experience, passion and an innovative approach that we use to continually set groundbreaking standards in our industry sector. We invest more than 15 % of the total turnover in research and development so that we can even guarantee the reliable use of the latest technology and methods in the future. Our comprehensive product care concept also guarantees that your investment in our solutions – like free software updates – pays off in the long term.
  • 35. 35 René Ulmer Technical Support We share our knowledge... … by maintaining a constant dialogue with users and experts. Some examples of this are our customer events and conferences that take place all over the world and our collaboration with numerous standardization committees. We also make our knowledge available to you in the customer section of our website in the form of application reports, specialized articles and articles in the discussion forum. With the OMICRON Academy, we also provide a wide spectrum of training possibilities and assist you with Start-up training and free webinars. When rapid assistance is required... … our excellent level of support is always appreciated. You can reach the highly- qualified and committed technicians in our customer support department 24 hours a day, seven days a week – and it's completely free. We deal with repair services and service features in a fair and non-bureaucratic manner. We can help minimize your downtime by lending you equipment from a readily avail- able plant at one of our service centers in your area. A comprehensive offer of services for consulting, testing and diagnostics completes our range of services. Wenyu Guo OMICRON Academy
  • 36. Subject to change without notice. www.omicronenergy.com For more information, additional literature, and detailed contact information of our worldwide offices please visit our website. OMICRON is an international company serving the electrical power industry with innovative testing and diagnostic solutions. The application of OMICRON products allows users to assess the condition of the primary and secondary equipment on their systems with complete confidence. Services offered in the area of consulting, commissioning, testing, diagnosis and training make the product range complete. Customers in more than 150 countries rely on the company’s ability to supply leading- edge technology of excellent quality. Service centers on all continents provide a broad base of knowledge and extraordinary customer support. All of this together with our strong network of sales partners is what has made our company a market leader in the electrical power industry. © OMICRON L2921, September 2018