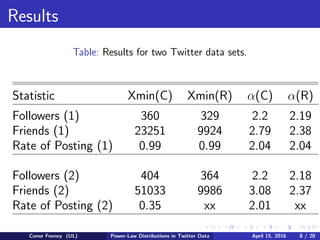
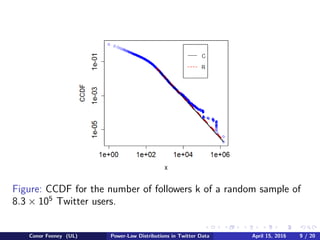
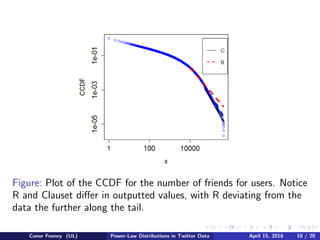
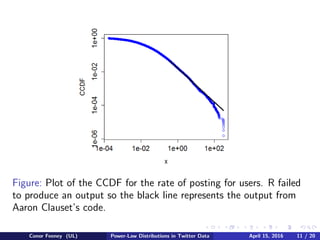
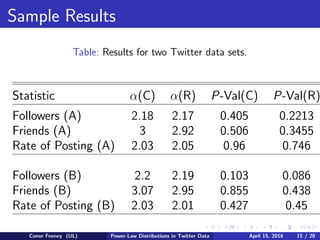
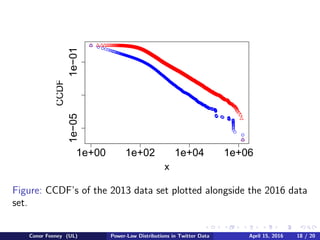
The document examines power-law distributions in Twitter data. It collected over 8 million rows of Twitter data using the TwitteR package in R. Testing showed that the number of followers, friends, and posting rates followed power-law distributions. Synthetic data was generated and the Kolmogorov-Smirnov test confirmed the power-law fits. While R's poweRlaw package provided reasonable results, Aaron Clauset's code was more accurate. Comparing to 2013 data, the power-law distributions for number of followers was similar, showing the structure of Twitter has remained stable.
1. Power-Law Distributions in Twitter
Data
Conor Feeney
University of Limerick
Supervisor: Prof James Gleeson
April 15, 2016
Conor Feeney (UL) Power-Law Distributions in Twitter Data April 15, 2016 1 / 20
2. Outline
Twitter.
Power-law distributions.
Data collection.
Initial results.
Synthetic data & Kolmogorov-Smirnov test.
Comparing “poweRlaw” and Aaron Clauset’s code.
Twitter’s structure: changes in last three years.
Conclusion
Conor Feeney (UL) Power-Law Distributions in Twitter Data April 15, 2016 2 / 20
3. Twitter
Twitter was founded in March 2006, and in a little
over 10 years has amassed over 300 million users
worldwide.
Due to this, a large amount of social media data
that can be obtained from Twitter.
The purposes of this paper is to examine the
potential presence of power-law distributions in
Twitter Data.
Conor Feeney (UL) Power-Law Distributions in Twitter Data April 15, 2016 3 / 20
4. Introduction to Power-Law Distributions
A power-law probability distribution is a distribution
whose density function (or mass function in the
discrete case) has the form
p(x) = Cx−α
,
where C is a normalising constant.
Power-law distributions are deemed “heavy tail”.
This means that there is a greater chance of extreme
values than the Gaussian distrubution for example.
Conor Feeney (UL) Power-Law Distributions in Twitter Data April 15, 2016 4 / 20
5. Plotting a Power-Law Distribution
Most common way is plotting the CCDF on a
log-log scale.
In theory it should have an approximate straight line
form.
Very few empirical phenomena obey power laws for
all values of x, generally the power-law is only
obeyed for values greater than some xmin.
Conor Feeney (UL) Power-Law Distributions in Twitter Data April 15, 2016 5 / 20
6. Data Collection
First, a Twitter API (Application Program
Interface) was set up. This is because specific codes
generated by the app are needed to establish a
connection with R.
Data was collected using the “TwitteR” package in
R. This package is designed to work specifically with
Twitter, and their API.
Some difficulties at start because only specific
versions of R work with this package.
Conor Feeney (UL) Power-Law Distributions in Twitter Data April 15, 2016 6 / 20
7. Results
Initially a data set of 1.89 × 10⁵
(1) was obtained.
“poweRlaw” and Clauset’s code was run on it to
calculate α and xmin values.
Over the break in semesters, further data was
collected and stored. This took nearly two weeks to
fully collect.
Our new data set contained 8.3 × 10⁵
(2) rows and
similar tests were carried out.
For second data set, we were required to use the
64-bit version of R for out results.
Conor Feeney (UL) Power-Law Distributions in Twitter Data April 15, 2016 7 / 20
8. Results
Table: Results for two Twitter data sets.
Statistic Xmin(C) Xmin(R) α(C) α(R)
Followers (1) 360 329 2.2 2.19
Friends (1) 23251 9924 2.79 2.38
Rate of Posting (1) 0.99 0.99 2.04 2.04
Followers (2) 404 364 2.2 2.18
Friends (2) 51033 9986 3.08 2.37
Rate of Posting (2) 0.35 xx 2.01 xx
Conor Feeney (UL) Power-Law Distributions in Twitter Data April 15, 2016 8 / 20
9. Figure: CCDF for the number of followers k of a random sample of
8.3 × 10⁵
Twitter users.
Conor Feeney (UL) Power-Law Distributions in Twitter Data April 15, 2016 9 / 20
10. Figure: Plot of the CCDF for the number of friends for users. Notice
R and Clauset differ in outputted values, with R deviating from the
data the further along the tail.
Conor Feeney (UL) Power-Law Distributions in Twitter Data April 15, 2016 10 / 20
11. Figure: Plot of the CCDF for the rate of posting for users. R failed
to produce an output so the black line represents the output from
Aaron Clauset’s code.
Conor Feeney (UL) Power-Law Distributions in Twitter Data April 15, 2016 11 / 20
12. Synthetic Data
Synthetic data is any production data applicable to
a given situation that is not obtained by direct
measurement.
Synthetic data is generated to meet specific needs
or certain conditions that may not be found in the
original, real data.
The method that this paper utilised is known as
Inverse Transform Sampling.
Conor Feeney (UL) Power-Law Distributions in Twitter Data April 15, 2016 12 / 20
13. Synthetic Data
Needed to create synthetic data sets that follow
power-law distributions for our various samples.
They had to have α values equal to our empirical
data.
This was needed to perform the KS test.
Conor Feeney (UL) Power-Law Distributions in Twitter Data April 15, 2016 13 / 20
14. Kolmogorov-Smirnov Test Results
Necessary to show that the power-law model is a
good fit for data.
Ran on two random samples, size 2 × 10⁴
and
4 × 10⁴
.
The results from these samples gave p-values that
told us that the data could be drawn from the
power-law model.
This, however, was not true for the larger sample’s
followers count, gave a p-value of around .08.
Conor Feeney (UL) Power-Law Distributions in Twitter Data April 15, 2016 14 / 20
15. Sample Results
Table: Results for two Twitter data sets.
Statistic α(C) α(R) P-Val(C) P-Val(R)
Followers (A) 2.18 2.17 0.405 0.2213
Friends (A) 3 2.92 0.506 0.3455
Rate of Posting (A) 2.03 2.05 0.96 0.746
Followers (B) 2.2 2.19 0.103 0.086
Friends (B) 3.07 2.95 0.855 0.438
Rate of Posting (B) 2.03 2.01 0.427 0.45
Conor Feeney (UL) Power-Law Distributions in Twitter Data April 15, 2016 15 / 20
16. A Comparison of R and Clauset’s codes.
R’s code nearly systematically calculated an xmin
that was less than Clauset, leading to less accurate
αs.
“poweRlaw” gave p-values less than Clauset’s
values.
While it is okay to use, borderline values should be
doubled checked using additional resources.
Conor Feeney (UL) Power-Law Distributions in Twitter Data April 15, 2016 16 / 20
17. Comparing 2013 Twitter to 2016 Twitter
Data set from a different paper was obtained.
Data was collected in 2013. We used it for
comparison purposes.
Only data was a users number of followers, but had
8.2 × 10⁵
users.
Had a similar α values, 2.13 vs 2.2.
Conor Feeney (UL) Power-Law Distributions in Twitter Data April 15, 2016 17 / 20
18. 1e+00 1e+02 1e+04 1e+06
1e−051e−01
x
CCDF
Figure: CCDF’s of the 2013 data set plotted alongside the 2016 data
set.
Conor Feeney (UL) Power-Law Distributions in Twitter Data April 15, 2016 18 / 20
19. Conclusion
Twitter & Power-law Distributions.
Data Collection.
Initial Results.
Synthetic Data & Kolmogorov-Smirnov Test.
Comparing “poweRlaw” and Aaron Clauset’s Code.
Twitter’s Structure: Changes in Last Three Years.
Conor Feeney (UL) Power-Law Distributions in Twitter Data April 15, 2016 19 / 20
20. Thank You for Listening
Questions?
Conor Feeney (UL) Power-Law Distributions in Twitter Data April 15, 2016 20 / 20