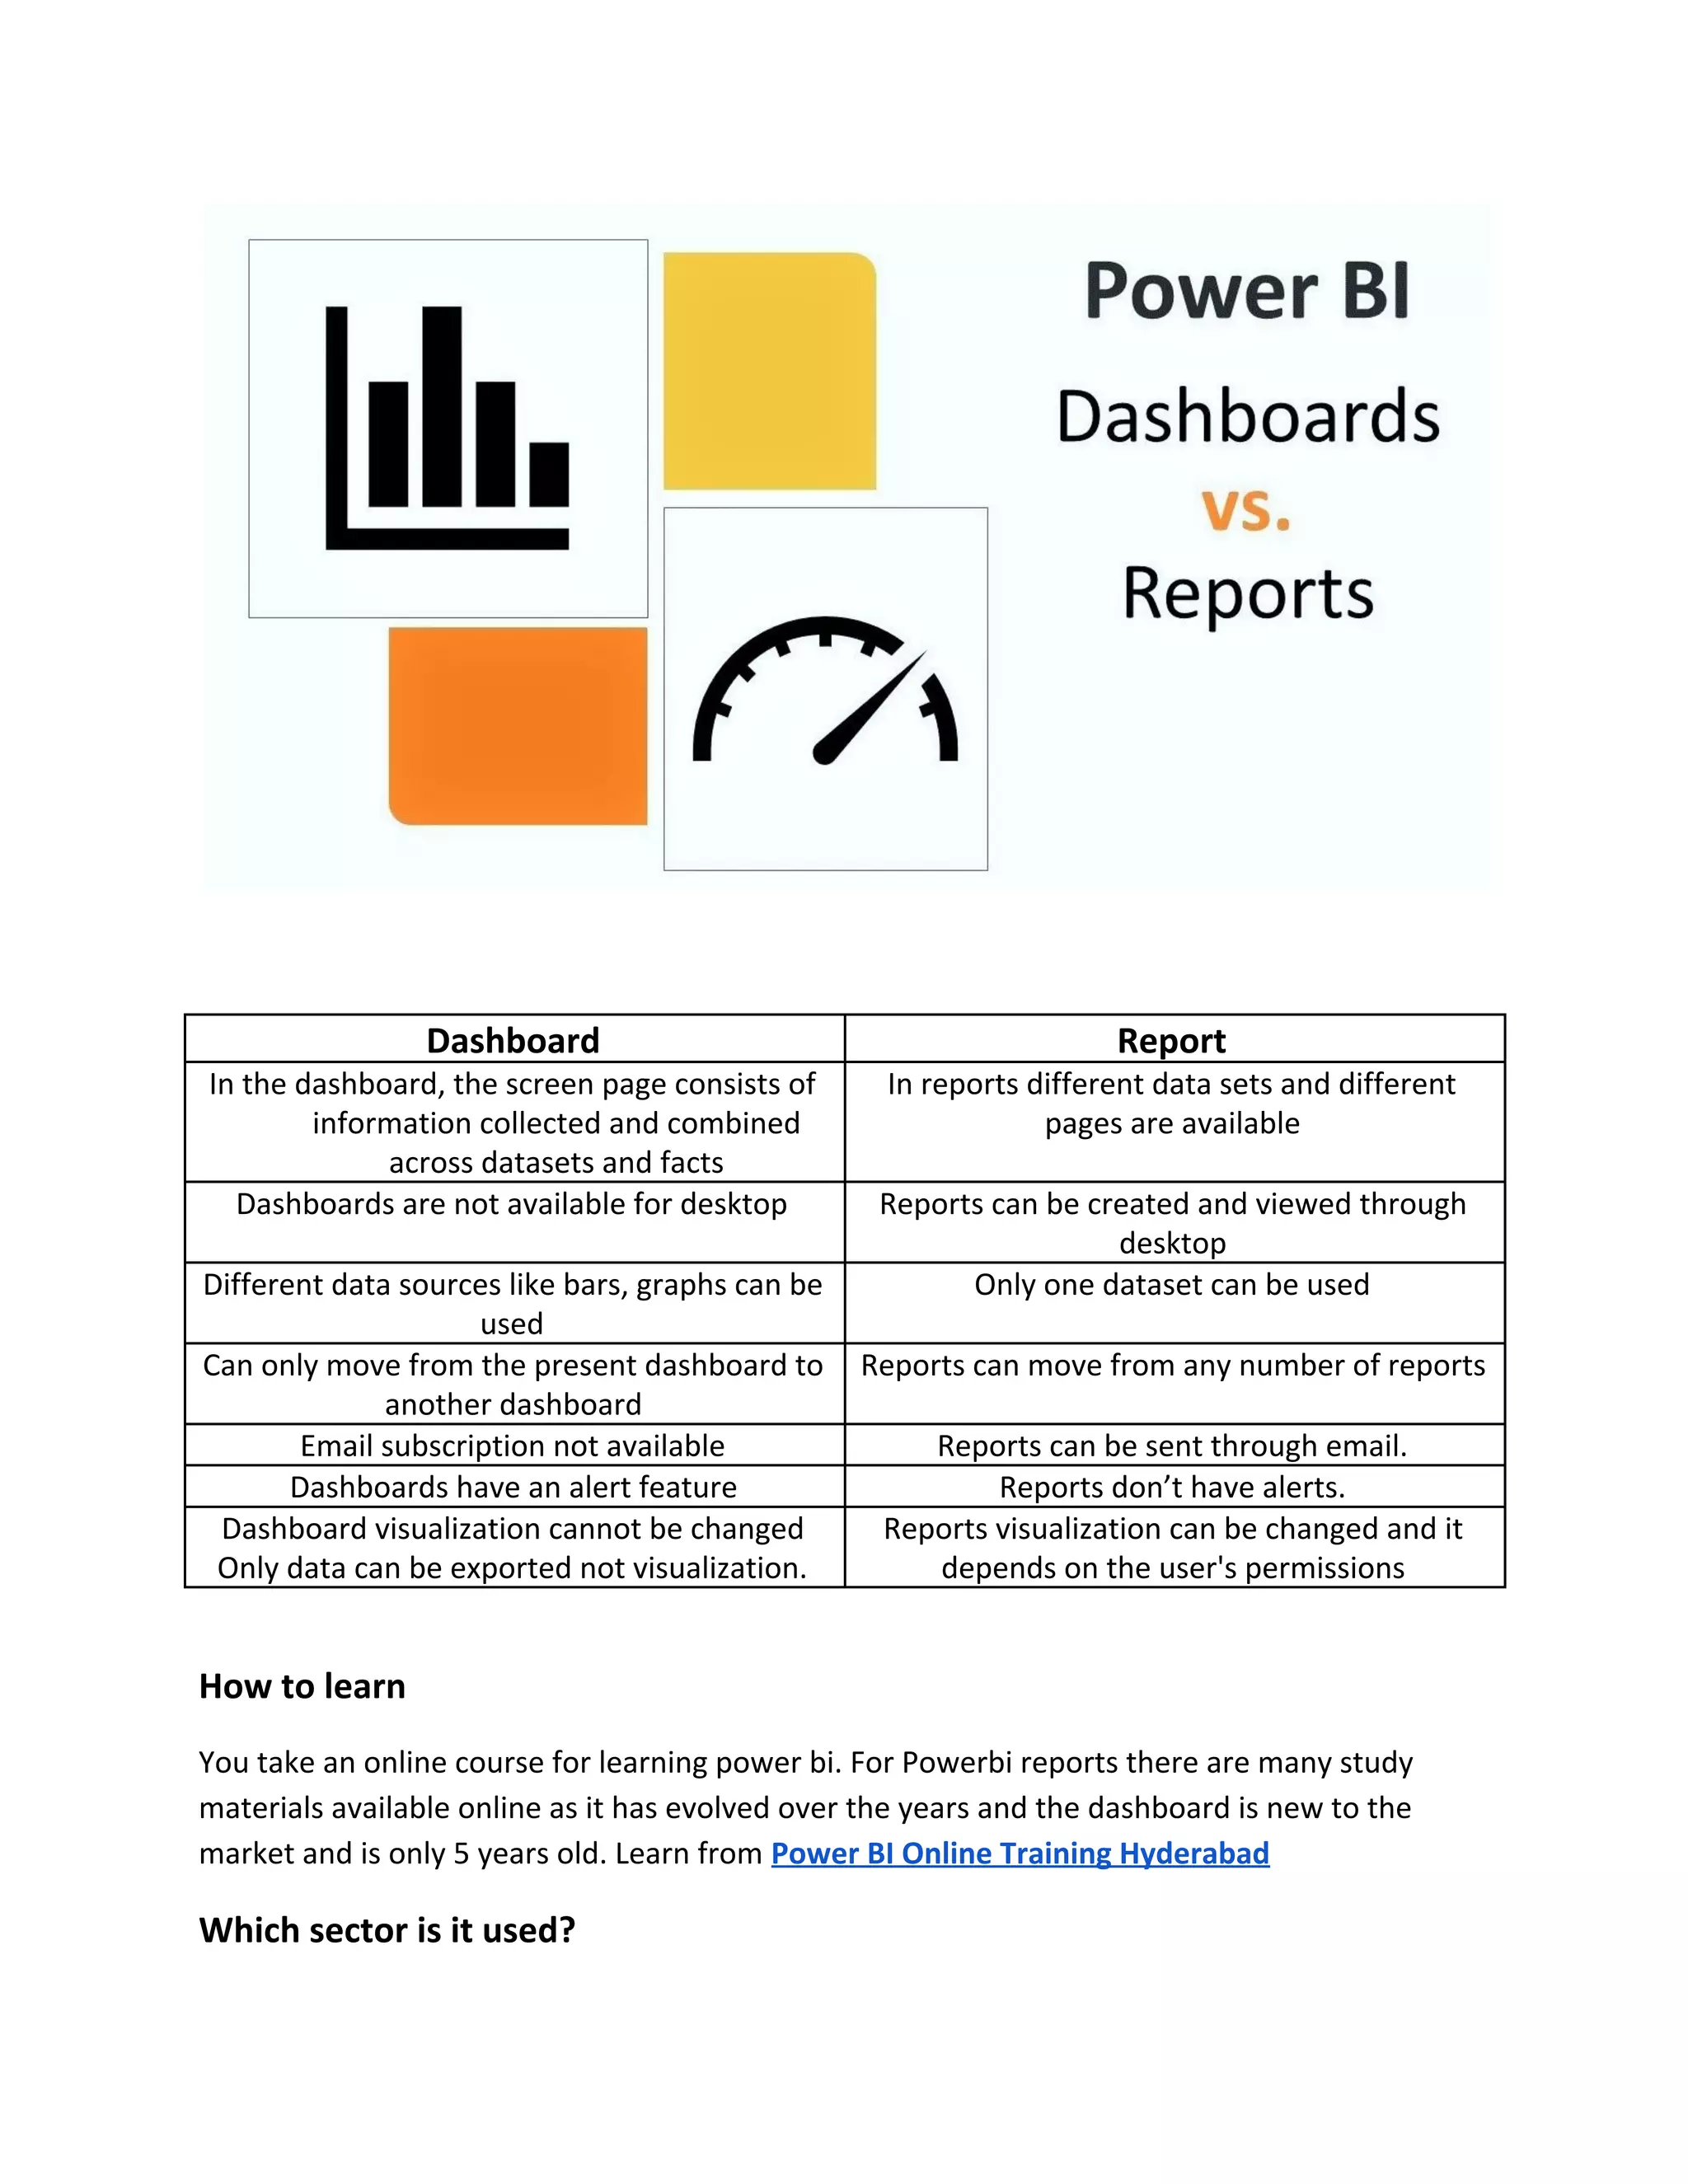
PowerBI Dashboard vs Report
PowerBI:
PowerBi is a software developed by Microsoft corporation as a tool to share business insights
within an organization. It helps in separating data transforms and cleans the data. The data is
created in the form of graphs and charts. These can be shared across the organization. Some
have the misconception of believing dashboard and reports both the same which is not true.
Hence to clear this confusion, today in this article I’m going to differentiate the power BI report
vs. Dashboard.
PowerBi Dashboard v/s reports
The Powerbi dashboard displays decision making facts to run a business. It displays values of
business which are used in order to change the business dynamics in one screen.
PowerBi reports are displayed in bar graphs, charts and in tabular. Reports are based on the
data of a particular business for example business data of a store in San Jose.
Dashboards and reports are dependent on each other because of the values that can be
dropdown report level.
Usage
Powerbi dashboard design ​is responsible to view business insights and key performance
indicators for making business decisions of owners or else senior management on the webpage
or else in the mobile app.
PowerBI reports are used for analyzing data of a store or a manager which helps in making
decisions based on the reports, say there are 20 computers and 2 desktops sold per hour in a
store. The data can be viewed in a PowerBI report and you make your production or purchase
according to demand.
Benefits
Dashboards are used to get an idea of KPI (key performance indicators). By using this data
owners can come to terms with making decisions of profit and loss.
Reports give a detailed analysis of various dimensions and the real facts of demand, supply and
purchase. Follow for more info at ​Power bi Training
Real-time use
For example, the real-time dashboard of a number of diabetic patients in a particular area and
the medicines they use are stored as data in the power bi dashboard. By using these data
pharmaceutical companies can develop drugs according to the requirement.
Reports give even more comprehensive data of diabetic patients, their hospital details, etc to
make decisions that are useful for the development of business for a longer-term.
Applications
Powerbi dashboards are used by almost all the owners who are on the digital platform. Reports
can be used by any business from sales to services.
Other key differences of Powerbi dashboard v/s report
Dashboard Report
In the dashboard, the screen page consists of
information collected and combined
across datasets and facts
In reports different data sets and different
pages are available
Dashboards are not available for desktop Reports can be created and viewed through
desktop
Different data sources like bars, graphs can be
used
Only one dataset can be used
Can only move from the present dashboard to
another dashboard
Reports can move from any number of reports
Email subscription not available Reports can be sent through email.
Dashboards have an alert feature Reports don’t have alerts.
Dashboard visualization cannot be changed
Only data can be exported not visualization.
Reports visualization can be changed and it
depends on the user's permissions
How to learn
You take an online course for learning power bi. For Powerbi reports there are many study
materials available online as it has evolved over the years and the dashboard is new to the
market and is only 5 years old. Learn from ​Power BI Online Training Hyderabad
Which sector is it used?
Both power bi dashboards and ​ ​Powerbi reports​ ​are used in the IT sector. ​Powerbi dashboard
design ​is the next level of application development in the IT sector. Powerbi report is used to
report business in detail.
Conclusion:
By reading this article on the power bi dashboard vs report you might have come to a
conclusion about these technologies already. They may be related to one another but not the
same. The dashboard is a one-page view that gives the summary of datasets by key
performance indicators whereas reports are individual in nature and don't depend on the
dashboards and have their own attributes to read the data.

Power bi dashboard vs report

  • 1.
    PowerBI Dashboard vsReport PowerBI: PowerBi is a software developed by Microsoft corporation as a tool to share business insights within an organization. It helps in separating data transforms and cleans the data. The data is created in the form of graphs and charts. These can be shared across the organization. Some have the misconception of believing dashboard and reports both the same which is not true. Hence to clear this confusion, today in this article I’m going to differentiate the power BI report vs. Dashboard. PowerBi Dashboard v/s reports The Powerbi dashboard displays decision making facts to run a business. It displays values of business which are used in order to change the business dynamics in one screen. PowerBi reports are displayed in bar graphs, charts and in tabular. Reports are based on the data of a particular business for example business data of a store in San Jose. Dashboards and reports are dependent on each other because of the values that can be dropdown report level. Usage
  • 2.
    Powerbi dashboard design​is responsible to view business insights and key performance indicators for making business decisions of owners or else senior management on the webpage or else in the mobile app. PowerBI reports are used for analyzing data of a store or a manager which helps in making decisions based on the reports, say there are 20 computers and 2 desktops sold per hour in a store. The data can be viewed in a PowerBI report and you make your production or purchase according to demand. Benefits Dashboards are used to get an idea of KPI (key performance indicators). By using this data owners can come to terms with making decisions of profit and loss. Reports give a detailed analysis of various dimensions and the real facts of demand, supply and purchase. Follow for more info at ​Power bi Training Real-time use For example, the real-time dashboard of a number of diabetic patients in a particular area and the medicines they use are stored as data in the power bi dashboard. By using these data pharmaceutical companies can develop drugs according to the requirement. Reports give even more comprehensive data of diabetic patients, their hospital details, etc to make decisions that are useful for the development of business for a longer-term. Applications Powerbi dashboards are used by almost all the owners who are on the digital platform. Reports can be used by any business from sales to services. Other key differences of Powerbi dashboard v/s report
  • 3.
    Dashboard Report In thedashboard, the screen page consists of information collected and combined across datasets and facts In reports different data sets and different pages are available Dashboards are not available for desktop Reports can be created and viewed through desktop Different data sources like bars, graphs can be used Only one dataset can be used Can only move from the present dashboard to another dashboard Reports can move from any number of reports Email subscription not available Reports can be sent through email. Dashboards have an alert feature Reports don’t have alerts. Dashboard visualization cannot be changed Only data can be exported not visualization. Reports visualization can be changed and it depends on the user's permissions How to learn You take an online course for learning power bi. For Powerbi reports there are many study materials available online as it has evolved over the years and the dashboard is new to the market and is only 5 years old. Learn from ​Power BI Online Training Hyderabad Which sector is it used?
  • 4.
    Both power bidashboards and ​ ​Powerbi reports​ ​are used in the IT sector. ​Powerbi dashboard design ​is the next level of application development in the IT sector. Powerbi report is used to report business in detail. Conclusion: By reading this article on the power bi dashboard vs report you might have come to a conclusion about these technologies already. They may be related to one another but not the same. The dashboard is a one-page view that gives the summary of datasets by key performance indicators whereas reports are individual in nature and don't depend on the dashboards and have their own attributes to read the data.