Synthesis of flower-like magnetite nanoassembly: Application in the efficient...
poster_lu ling
1. Detection of heavy metal ions in drinking water by enhancing the
sensitivity of heavy-metal responsive dyes using MEF effect
Presenter: Lu Ling Supervisor: Prof. Chang Young-Tae
Department of Chemistry, Faculty of Science, National University of Singapore, 21 Lower Kent Ridge Road, Singapore
The threat of heavy metal ions in drinking water to public health is gaining its concern all
around the world. Various approaches have been developed for detection and quantification
of heavy metal ions, and thus to control their concentration lower than the regulated level.
However, designing a simple, rapid, inexpensive, selective and sensitive technique is still
challenging. Applications using heavy-metal responsive fluorescent sensors have the
greatest potential. To overcome the weak fluorescence behavior in diluted heavy-metal
solutions, silica coated gold nanoparticles were used in this project. Such enhancement of
fluorescence is referred to as metal enhanced fluorescence (MEF). This effect is dependent
on the distance between metal cores and fluorophores, and concentration of nanoparticles.
Both these two factors were investigated in this study. In addition, covalent coupling was
introduced to the system, which was expected to affect the interaction as well.
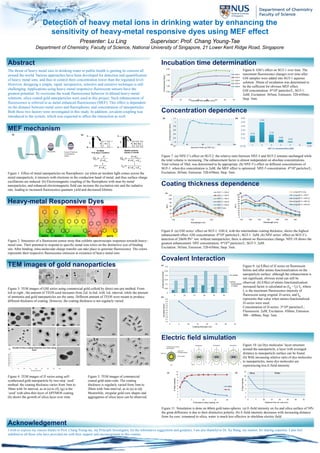
(a) (b)
Figure 1: Effect of metal nanoparticles on fluorophores: (a) when an incident light comes across the
metal nanoparticle, it interacts with electrons in the conduction band of metal, and thus surface charge
oscillations are induced. (b) Electromagnetic coupling of the fluorophore with near-by metal
nanoparticles, and enhanced electromagnetic field can increase the excitation rate and the radiative
rate, leading to increased fluorescence quantum yield and decreased lifetime.
Heavy-metal Responsive Dyes
Figure 2: Structures of a fluorescent sensor array that exhibits spectroscopic responses towards heavy-
metal ions. Their potential to respond to specific metal ions relies on the distinctive size of binding
site. After binding, intra-molecular charge transfer can take place to generate fluorescence. The colors
represents their respective fluorescence emission in existence of heavy metal ions.
TEM images of gold nanoparticles
Figure 3: TEM images of GSI series using commercial gold colloid by direct one-pot method. From
left to right , the amount of TEOS used increases from 2uL to 6uL with 1uL interval, while the amount
of ammonia and gold nanoparticles are the same. Different amount of TEOS were meant to produce
different thickness of coating. However, the coating thickness is not regularly varied.
Figure 4: TEM images of JJ series using self-
synthesized gold nanoparticle by two-step ‘seed’
method: the coating thickness varies from 5nm to
30nm with 5n interval, as in (a) to (f); (g) is the
‘seed’ with ultra-thin layer of APTMOS coating.
(h) shows the growth of silica layer over time.
Figure 5: TEM images of commercial
coated gold nano-rods. The coating
thickness is regularly varied from 5nm to
20nm with 5nm interval, as in (a) to (d).
Meanwhile, irregular gold core shapes and
aggregation of silica layer can be observed.
Incubation time determination
-
0.50
1.00
1.50
2.00
2.50
0 10 20 30 40 50 60 70
Enhancementfactor
Time after GSI addition (min)
GSI-2
GSI-3
GSI-4
GSI-5
GSI-6
Figure 6: GSI’s effect on SGT-1 over time. The
maximum fluorescence changes over time after
GSI samples were added into SGT-1 aqueous
solution. 30min of incubation was determined to
be the sufficient for obvious MEF effect.
GSI concentration: 4*109 particles/L; SGT-1:
2uM; Excitation: 365nm; Emission: 520-650nm;
Step: 5nm.
Concentration dependence
-0.2
0
0.2
0.4
0.6
0.8
1
1.2
-20 30 80 130 180
Enhancementfactor
Amount of work-up DIW (uL)
(a)
0.16
0.50
0.19
0.06
0.02
-0.04(0.10)
-
0.10
0.20
0.30
0.40
0.50
0.60
1 2 3 4 6 8
SGT-1's concentration (uM)
(b)
Figure 7: (a) NPZ-5’s effect on SGT-2: the relative ratio between NPZ-5 and SGT-2 remains unchanged while
the total volume is increasing. The enhancement factor is almost independent on absolute concentrations.
Total volume of 50uL was determined to be appropriate. (b) NPZ-5’s effect on different concentrations of
SGT-1: when dye concentration is 2uM, the MEF effect is optimized. NPZ-5 concentration: 4*109 particles/L;
Excitation: 365nm; Emission: 520-650nm; Step: 5nm.
Coating thickness dependence
Figure 8: (a) GSI series’ effect on SGT-1: GSI-4, with the intermediate coating thickness, shows the highest
enhancement effect. GSI concentration: 4*109 particles/L; SGT-1: 2uM. (b) NPZ series’ effect on SGT-5’s
detection of 20nM Pb2+ ion: without nanoparticles, there is almost no fluorescence change. NPZ-10 shows the
greatest enhancement. NPZ concentration: 4*1010 particles/L; SGT-5: 2uM.
Excitation: 365nm; Emission: 520-650nm; Step: 5nm.
Covalent Interaction
Figure 9: (a) Effect of JJ series on fluorescein
before and after amino functionalization on the
nanoparticle surface: although the enhancement is
not significant, obvious trend can still be
observed. (b) Effect of amino functionalization:
increased factor is calculated as (Iaj – Ij)/ Ij, where
Ij is the maximum fluorescence intensity of
fluorescein using original JJ-series, and Iaj
represents that value when amino-functionalized
JJ-series were used.
Concentration of JJ-series: 3*108 particles/L;
Fluorescein: 2uM; Excitation: 450nm; Emission:
500 – 600nm; Step: 5nm.
0
20
40
60
80
100
120
520 570 620
RFU
Wavelength (nm)
SGT-1 + GSI-2
SGT-1 + GSI-3
SGT-1 + GSI-4
SGT-1 + GSI-5
SGT-1 + GSI-6
SGT-1 only
0
10
20
30
40
50
60
70
80
90
100
520 540 560 580 600 620 640
RFU
Wavelength (nm)
using SGT-5 only
using SGT-5 + NPZ-5
using SGT-5 + NPZ-10
using SGT-5 + NPZ-15
using SGT-5 + NPZ-20
(a) (b)
0
0.05
0.1
0.15
0.2
0.25
0.3
5 10 15 20 25 30
Enhancementfactor
JJ series
amino
functionalized
JJ series
1.5
1.7
1.9
2.1
2.3
2.5
2.7
2.9
3.1
3.3
3.5
0 5 10 15 20 25 30 35
Increasedfactor
Coating thickness (nm)
(a)
(b)
Electric field simulation
2
3
4
5
6
7
8
9
10
11
0 5 10 15 20
E-fieldintensity
Thickness of silica coating, nm
silica
Au
0
2
4
6
8
10
12
0 5 10 15 20 25 30 35
E-fieldintensity
Distance from Au core (nm)
Silica Water(b)(a)
Figure 11: Simulation is done on 60nm gold nano-spheres. (a) E-field intensity on Au and silica surface of NPs:
the great difference is due to their distinctive polarity. (b) E-field intensity decreases with increasing distance
from Au core: compared to silica, water is much less effective in shielding electric field.
Figure 10: (a) Dye molecules’ layer-structure
around the nanoparticle, a layer with averaged
distance to nanoparticle surface can be found.
(b) With increasing relative ratio of dye molecules
to nanoparticles, more dye molecules are
experiencing less E-field intensity.
I wish to express my sincere thanks to Prof. Chang Young-tae, my Principle Investigator, for the informative suggestions and guidance. I am also thankful to Dr. Xu Wang, my mentor, for sharing expertise. I also feel
indebted to all those who have provided me with their support and encouragement in this venture.
MEF mechanism
Abstract
Acknowledgement