Download to read offline
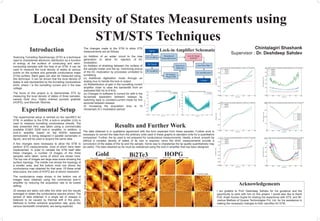

This document summarizes a student project to measure local density of states using scanning tunneling spectroscopy (STS) techniques. The student demonstrated STS on three samples - gold, highly ordered pyrolytic graphite, and bismuth telluride. Several images of each sample's surface topology and conductance maps were obtained. Spectroscopy data was also collected by averaging 30 sweeps to reduce thermal drift effects. Further work is needed to convert the data to standard units and characterize tip quality to obtain fully quantitative results.


![Eric Schulken-Portfolio [11-8-16]](https://cdn.slidesharecdn.com/ss_thumbnails/eschulkenportfolio5-11-16-160512212543-thumbnail.jpg?width=640&height=640&fit=bounds)