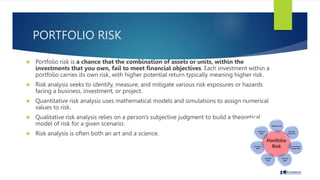
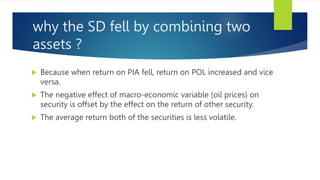
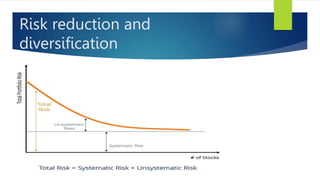
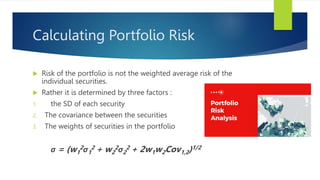
PORTFOLIO
A portfolio is a collection of financial
investments like stocks, bonds,
cash, and cash equivalents, including
end funds and exchange traded funds
People generally believe that
stocks, bonds, and cash comprise
the core of a portfolio.
PORTFOLIO RISK
 Portfolio risk is a chance that the combination of assets or units, within the
investments that you own, fail to meet financial objectives. Each investment within a
portfolio carries its own risk, with higher potential return typically meaning higher risk.
 Risk analysis seeks to identify, measure, and mitigate various risk exposures or hazards
facing a business, investment, or project.
 Quantitative risk analysis uses mathematical models and simulations to assign numerical
values to risk.
 Qualitative risk analysis relies on a person's subjective judgment to build a theoretical
model of risk for a given scenario.
 Risk analysis is often both an art and a science.
Why risk decrease when we combine two
or more assets
 Suppose that the following table shows expected return on PIA and POL shares
 SD of PIA Return = 9.2
 SD of POL Return = 7.63
Scenario PIA POL Average
Same oil price 10% 10% 10%
Oil price fall 20% 5% 12.5%
Oil price rise 2% 20% 11%
Interpretation
 If we invest only in PIA our return may fluctuate by a value of
9.2%
 Similarly if we invest only in POL our return may fluctuate by
a value of 7.63%
 However, if we invest half of our funds in POL , fluctuation in
our return will considerably decrease.
 The return on combined portfolio may fluctuate by a value
of 3.55%.
why the SD fell by combining two
assets ?
 Because when return on PIA fell, return on POL increased and vice
versa.
 The negative effect of macro-economic variable (oil prices) on
security is offset by the effect on the return of other security.
 The average return both of the securities is less volatile.
What is necessary for combining
securities to reduce risk?
 Combine such stocks the return of which are
affected in opposite direction from a change
in the same economic variable i.e. stocks in our
portfolio should have negative correlation.
Portfolio risk will not decrease
When the stocks return move in the same
direction by equal percentage (perfect positive
correlation)
i.e. If changes in economic variables have
negative effect on both of the stocks.
Why risk falls in a portfolio?
 By combining negatively correlated stocks, we can remove the individual risks
(unsystematic risk) of the stocks.
 For example : POL has the risk of falling oil prices and PIA has the risk of rising oil
prices.
 By combining these two stocks, reduction in return in one stock due to change in
oil price is compensated by increase in return of the other stock.
 However, all of market risk cannot be eliminated through diversification
(systematic risk)
Risk reduction and
diversification
Co- variance
 To calculate portfolio risk, we need to know how stocks in the portfolio
co-vary.
 Covariance is the extent to which two random variables move together
over time .(return of two stocks)
 If it is positive, it means the variables move in the same direction.
 If it is zero, it means that there is no relationship.
 Positive covariance of returns means that a change in macro economic
variable (e.g. oil prices)o causes similar change in the returns of two
stocks (e.g. POL and OGDC).
To make covariance meaningful
 To make covariance meaningful so that its
value can be compared with other values,
we make it a positive measure.
 The relative measure is correlation coefficient,
denoted by ρ (rho).
ρ (X,Y) = cov (X,Y) / σX.σY.
Correlation coefficient
 Correlation coefficient can vary from +1 to -1.
 +1 means that the return on two securities are perfectly positively
correlated. If there is 100 positive change in security A return, the
security B return will also increase by 100%.
 -1 means that If security A return increased by 100%, security B
return will decrease by 100%.
Calculating Portfolio Risk
 Risk of the portfolio is not the weighted average risk of the
individual securities.
 Rather it is determined by three factors :
1. the SD of each security
2. The covariance between the securities
3. The weights of securities in the portfolio
σ = (w1
2σ1
2 + w2
2σ2
2 + 2w1w2Cov1,2)1/2
Example
 Suppose POL gave you = 12.12% return
 And PIA gave you =15.16% return
 SD of POL =21.58 and PIA = 25.97
 Correlation coefficient = 0.29
 Weights POL = 50% and PIA = 50%
 Then what is the standard deviation of the portfolio
σ = (w1
2σ1
2 + w2
2σ2
2 + 2w1w2ρ𝑖,𝑗σ𝑖σ𝑗)1/2
=>[.52
(21.58)2
+.52
(25.97)2
+2(.5)(.5)(.29)(21.58)(25.97)]1/2
[116.42 + 168.61 + 81.26] 1/2
=19.14
.
PORTFOLIO RISK  ANALYSIS.pptx

PORTFOLIO RISK ANALYSIS.pptx

  • 2.
    PORTFOLIO A portfolio isa collection of financial investments like stocks, bonds, cash, and cash equivalents, including end funds and exchange traded funds People generally believe that stocks, bonds, and cash comprise the core of a portfolio.
  • 3.
    PORTFOLIO RISK  Portfoliorisk is a chance that the combination of assets or units, within the investments that you own, fail to meet financial objectives. Each investment within a portfolio carries its own risk, with higher potential return typically meaning higher risk.  Risk analysis seeks to identify, measure, and mitigate various risk exposures or hazards facing a business, investment, or project.  Quantitative risk analysis uses mathematical models and simulations to assign numerical values to risk.  Qualitative risk analysis relies on a person's subjective judgment to build a theoretical model of risk for a given scenario.  Risk analysis is often both an art and a science.
  • 4.
    Why risk decreasewhen we combine two or more assets  Suppose that the following table shows expected return on PIA and POL shares  SD of PIA Return = 9.2  SD of POL Return = 7.63 Scenario PIA POL Average Same oil price 10% 10% 10% Oil price fall 20% 5% 12.5% Oil price rise 2% 20% 11%
  • 5.
    Interpretation  If weinvest only in PIA our return may fluctuate by a value of 9.2%  Similarly if we invest only in POL our return may fluctuate by a value of 7.63%  However, if we invest half of our funds in POL , fluctuation in our return will considerably decrease.  The return on combined portfolio may fluctuate by a value of 3.55%.
  • 6.
    why the SDfell by combining two assets ?  Because when return on PIA fell, return on POL increased and vice versa.  The negative effect of macro-economic variable (oil prices) on security is offset by the effect on the return of other security.  The average return both of the securities is less volatile.
  • 7.
    What is necessaryfor combining securities to reduce risk?  Combine such stocks the return of which are affected in opposite direction from a change in the same economic variable i.e. stocks in our portfolio should have negative correlation.
  • 8.
    Portfolio risk willnot decrease When the stocks return move in the same direction by equal percentage (perfect positive correlation) i.e. If changes in economic variables have negative effect on both of the stocks.
  • 9.
    Why risk fallsin a portfolio?  By combining negatively correlated stocks, we can remove the individual risks (unsystematic risk) of the stocks.  For example : POL has the risk of falling oil prices and PIA has the risk of rising oil prices.  By combining these two stocks, reduction in return in one stock due to change in oil price is compensated by increase in return of the other stock.  However, all of market risk cannot be eliminated through diversification (systematic risk)
  • 10.
  • 11.
    Co- variance  Tocalculate portfolio risk, we need to know how stocks in the portfolio co-vary.  Covariance is the extent to which two random variables move together over time .(return of two stocks)  If it is positive, it means the variables move in the same direction.  If it is zero, it means that there is no relationship.  Positive covariance of returns means that a change in macro economic variable (e.g. oil prices)o causes similar change in the returns of two stocks (e.g. POL and OGDC).
  • 12.
    To make covariancemeaningful  To make covariance meaningful so that its value can be compared with other values, we make it a positive measure.  The relative measure is correlation coefficient, denoted by ρ (rho). ρ (X,Y) = cov (X,Y) / σX.σY.
  • 13.
    Correlation coefficient  Correlationcoefficient can vary from +1 to -1.  +1 means that the return on two securities are perfectly positively correlated. If there is 100 positive change in security A return, the security B return will also increase by 100%.  -1 means that If security A return increased by 100%, security B return will decrease by 100%.
  • 14.
    Calculating Portfolio Risk Risk of the portfolio is not the weighted average risk of the individual securities.  Rather it is determined by three factors : 1. the SD of each security 2. The covariance between the securities 3. The weights of securities in the portfolio σ = (w1 2σ1 2 + w2 2σ2 2 + 2w1w2Cov1,2)1/2
  • 15.
    Example  Suppose POLgave you = 12.12% return  And PIA gave you =15.16% return  SD of POL =21.58 and PIA = 25.97  Correlation coefficient = 0.29  Weights POL = 50% and PIA = 50%  Then what is the standard deviation of the portfolio σ = (w1 2σ1 2 + w2 2σ2 2 + 2w1w2ρ𝑖,𝑗σ𝑖σ𝑗)1/2 =>[.52 (21.58)2 +.52 (25.97)2 +2(.5)(.5)(.29)(21.58)(25.97)]1/2 [116.42 + 168.61 + 81.26] 1/2 =19.14 .