Downloaded 175 times
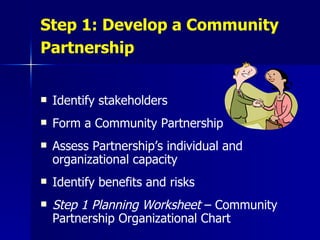
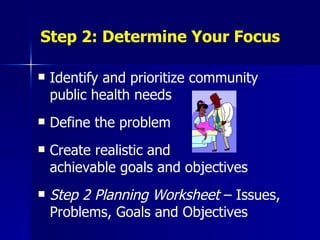
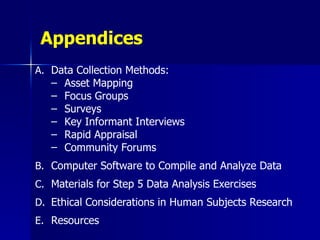
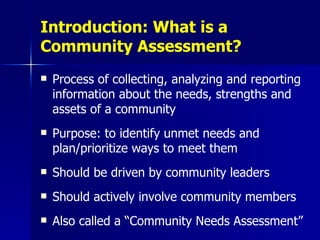


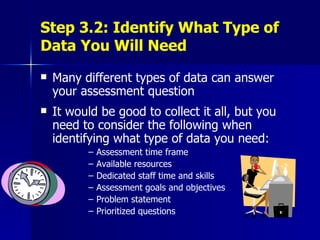


The document outlines a comprehensive curriculum for conducting a community assessment, structured in six key steps: developing community partnerships, determining focus areas, identifying data needs, collecting data, analyzing that data, and communicating results. It emphasizes collaboration with community stakeholders to prioritize public health issues, collect relevant data, and establish achievable goals. Additionally, it includes resources and ethical considerations for effective community engagement throughout the assessment process.


![ONFH[AVN HIP] -TRIPLE REGIME -A NOVAL SURGICAL CONCEPT .pptx](https://cdn.slidesharecdn.com/ss_thumbnails/onfhavnhip2026koaconcalicutdrgokuldevdrmashraf-260210064517-213ec005-thumbnail.jpg?width=640&height=640&fit=bounds)


