Download as PDF, PPTX
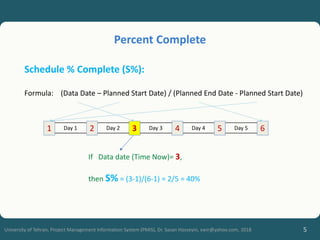
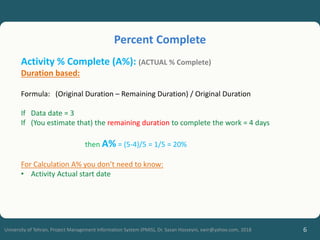
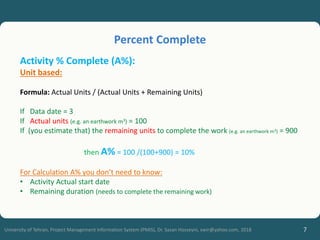

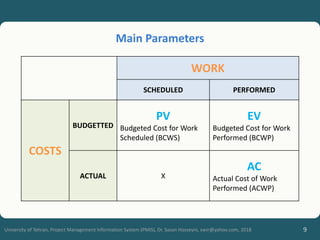
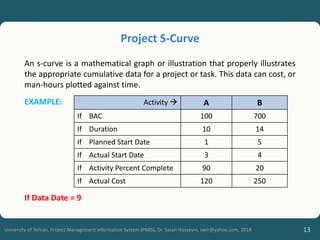

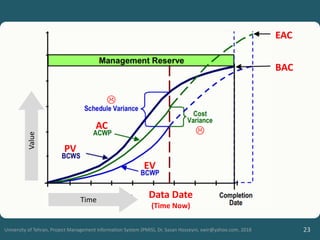
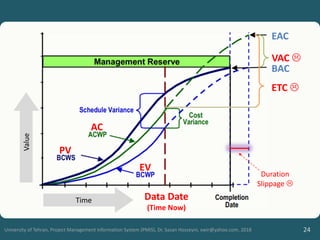
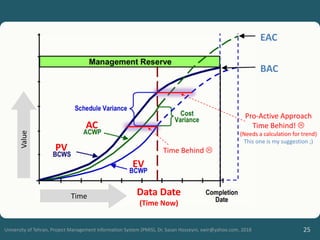
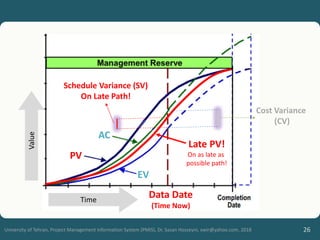
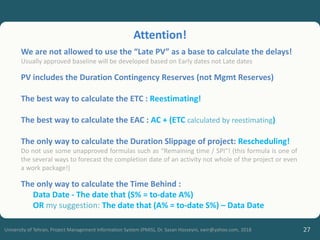
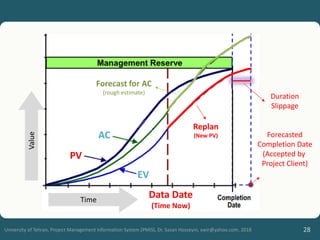
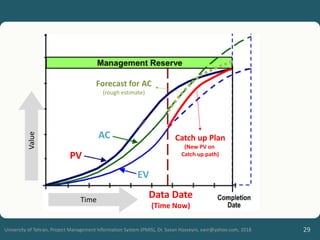

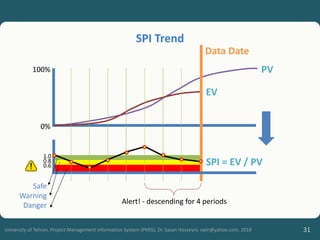

This document discusses earned value management (EVM) and provides examples of how to calculate key EVM metrics like planned value (PV), earned value (EV), and actual cost (AC). It explains how to calculate schedule and activity percentage complete and presents examples of interpreting EVM data on an S-curve graph to analyze project performance. The document is intended to teach project management students about EVM concepts and calculations.


