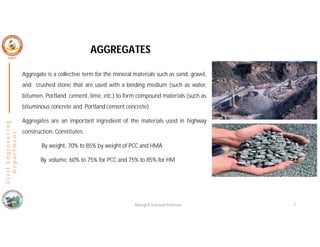
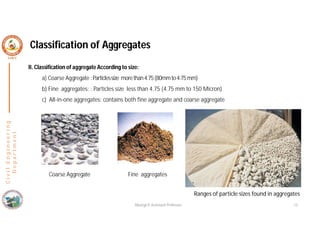
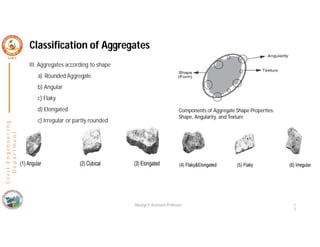
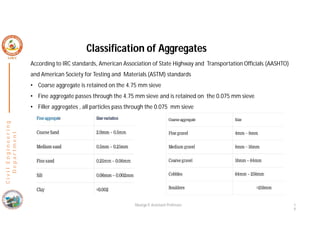
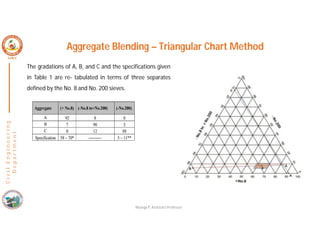
Pavement Materials
Module 1
C
i
v
i
l
E
n
g
i
n
e
e
r
i
n
g
D
e
p
a
r
t
m
e
n
t
Aggregates- Origin, Classification, Requirements, properties and tests on Road aggregates, Concepts of size
and gradation- design gradation, maximum aggregate size, aggregate blending by different methods to meet
specification.
Bitumen and Tar- Origin, Preparation, Properties and Chemical Constitution of bituminous road binders,
Requirements.
AGGREGATES
Aggregate is a collective term for the mineral materials such as sand, gravel,
and crushed stone that are used with a binding medium (such as water,
bitumen, Portland cement, lime, etc.) to form compound materials (such as
bituminous concrete and Portland cement concrete).
Aggregates are an important ingredient of the materials used in highway
construction. Constitutes:
By weight, 70% to 85% by weight of PCC and HMA
By volume, 60% to 75% for PCC and 75% to 85% for HM
C
i
v
i
l
E
n
g
i
n
e
e
r
i
n
g
D
e
p
a
r
t
m
e
n
t
Nisarga P, Assistant Professor 7
Aggregates – Origin
Most of the properties of an aggregate is derived from its parental rock chemical and mineral composition
which affects strength, stiffness, density, pore structure and permeability.
Aggregates can be classified into two main categories: Naturaland CrushedAggregates
• Natural aggregates: Rocks experience geothermal and weathering processes which can produce
granular materials in the form of natural gravels and sands, which can be used in construction works
without any modification or additional processes
• Crushed/manufactured: Granular materials produced by human related activities such as blasting,
crushing and so on, have rougher surface and more angular shapes comparing to natural sands.
C
i
v
i
l
E
n
g
i
n
e
e
r
i
n
g
D
e
p
a
r
t
m
e
n
t
Nisarga P, Assistant Professor 8
Origin and Classification of Aggregates
Natural aggregates come from rock, of which there are three broad geological classifications
1. Igneousrock: Formed by solidification of molten magma
Based on Crystallinity
a) Intrusive rocks: Solidification occurs slowly and are crystalline in nature.
Example: Granite, Gabbro
b) Extrusive rocks: cools quickly and are fine grained in nature Example: Basalt
Based on size grains
a) Acidic: Free quarts present, with Silica>66% Specific Gravity<2.75.
Example: Granite
b) Basic: Free quarts is not present, with Silica<66%, Specific Gravity>2.75.
Example: Basalt
(
C
i
v
i
l
E
n
g
i
n
e
e
r
i
n
g
D
e
p
a
r
t
m
e
n
t
Nisarga P, Assistant Professor 9
Origin and Classification of Aggregates
(
C
i
v
i
l
E
n
g
i
n
e
e
r
i
n
g
D
e
p
a
r
t
m
e
n
t
Nisarga P, Assistant Professor 1
0
2. Sedimentaryrocks: Obtained by deposition of weathered & transported pre-existing rocks or solutions
a) Calcareous: Containing calcium carbonate
Example: Limestone, Dolomite
b) Siliceous: Containing SiO2.
Example: Sandstone
c) Argillaceous: Containing clay minerals.
Example: Shale
3. Metamorphicrock: Formed under high heat & pressure alteration of either igneous & sedimentary rocks
Example: Marble - Limestone
Quartzite - Sandstone
Slate - Shale
Schist - Basalt
Gneiss - Granite
Classification of Aggregates
I. According to source or nature of formation
a) Natural Aggregate :foundinthenaturalsourcelikeseabed,slopedeposits,riverBasin.Example:sandandgravel,pitRun.
b) Crushed Rock aggregates: formed by crushing the various Rocks in quarries Example: stone aggregate.
c) Recycled aggregates: The recycled aggregate is manufactured by crushing inert construction and demolition
waste.
d) Artificial aggregates: The artificial aggregates are made up by various waste material iron ore, artificial cinders,
burnt clay, steel rivet etc.
C
i
v
i
l
E
n
g
i
n
e
e
r
i
n
g
D
e
p
a
r
t
m
e
n
t
Nisarga P, Assistant Professor 1
1
Classification of Aggregates
II. Classification of aggregate According to size:
a) Coarse Aggregate :Particlessize morethan4.75(80mmto4.75mm)
b) Fine aggregates: : Particles size less than 4.75 (4.75 mm to 150 Micron)
c) All-in-one aggregates: contains both fine aggregate and coarse aggregate
C
i
v
i
l
E
n
g
i
n
e
e
r
i
n
g
D
e
p
a
r
t
m
e
n
t
Nisarga P, Assistant Professor 12
Coarse Aggregate Fine aggregates
Ranges of particle sizes found in aggregates
Classification of Aggregates
C
i
v
i
l
E
n
g
i
n
e
e
r
i
n
g
D
e
p
a
r
t
m
e
n
t
III. Aggregates according to shape
a) Rounded Aggregate
b) Angular
c) Flaky
d) Elongated
c) Irregular or partly rounded
Nisarga P, Assistant Professor 1
3
Components of Aggregate Shape Properties:
Shape, Angularity, and Texture
Classification of Aggregates
C
i
v
i
l
E
n
g
i
n
e
e
r
i
n
g
D
e
p
a
r
t
m
e
n
t
Nisarga P, Assistant Professor 1
4
According to IRC standards, American Association of State Highway and Transportation Officials (AASHTO)
and American Society for Testing and Materials (ASTM) standards
• Coarse aggregate is retained on the 4.75 mm sieve
• Fine aggregate passes through the 4.75 mm sieve and is retained on the 0.075 mm sieve
• Filler aggregates , all particles pass through the 0.075 mm sieve
Desirable Properties or Requirements of aggregates
Nisarga P, Assistant Professor 13
• Strength
• Hardness
• Toughness
• Shape of aggregates
• Adhesion with bitumen
• Durability
• Free from deleterious particles
C
i
v
i
l
E
n
g
i
n
e
e
r
i
n
g
D
e
p
a
r
t
m
e
n
t
Aggregate tests
In order to decide the suitability of the aggregate for use in pavement construction, following tests are carried out:
• Crushing test
• Abrasion test
• Impact test
• Soundness test
• Shape test
• Specific gravity and water absorption test
• Bitumen adhesion test
C
i
v
i
l
E
n
g
i
n
e
e
r
i
n
g
D
e
p
a
r
t
m
e
n
t
Tests on Aggregates
Nisarga P, Assistant Professor
Specific gravity and water absorption of aggregates:
1. Crushingtest: Aggregate Crushing Value by IRC & MoRTH
A value less than 10% signifies an exceptionally strong aggregate, while
above 35% would normally be regarded as weak aggregates and not
recommended for pavement construction works.
2. Impact test: Aggregate Impact Value recommended by IRC & MoRTH
Wearing course - shouldn't exceed 30%
Bituminous macadam - shouldn't exceed 35%.
Water bound macadam base courses - shouldn't exceed 40%.
C
i
v
i
l
E
n
g
i
n
e
e
r
i
n
g
D
e
p
a
r
t
m
e
n
t
Tests on Aggregates
Nisarga P, Assistant Professor
3. Abrasiontest: Aggregate Abrasion Value by IRC & MoRTH
WBM base course - shouldn't exceed 40%
Bituminous concrete - - shouldn't exceed 35%
C
i
v
i
l
E
n
g
i
n
e
e
r
i
n
g
D
e
p
a
r
t
m
e
n
t
Tests on Aggregates
Nisarga P, Assistant Professor
4. Shape Test
Flakiness Index(FI) & Elongation Index(EI) of aggregates
Bituminous concrete and surface dressing: should not exceed 25%;
Water Bound Macadam should not exceed 15%.
Combined Index (CI) = FI+EI
Wet Mix Macadam (WMM, Dense Bituminous Macadam (DBM) and Bituminous Concrete (BC) surface, the
value : should not exceed 30%
C
i
v
i
l
E
n
g
i
n
e
e
r
i
n
g
D
e
p
a
r
t
m
e
n
t
Tests on Aggregates
Nisarga P, Assistant Professor
Flakiness Index- Thickness Gauge
Elongation Index- Length Gauge
5. Specific gravity and water absorptiontest
• The specific gravity value for rocks generally varies between 2.6 to 2.9.
• Rocks with more than 0.6% water absorption are considered unsatisfactory unless found acceptable
based on strength
6. Bitumen adhesion test
• Adhesion problem occurs when the aggregate is wet and cold. The presence of water causes stripping of
binder from the coated aggregates.
• Static immersion test is one specified by IRC and is quite simple
• The principle of the test is by immersing aggregate fully coated with binder in water maintained at
temperature 40°C for 24 hours
• IRC has specified maximum stripping value of aggregates should not exceed 5%
C
i
v
i
l
E
n
g
i
n
e
e
r
i
n
g
D
e
p
a
r
t
m
e
n
t
Tests on Aggregates
Nisarga P, Assistant Professor
Specific gravity and water absorption of aggregates:
Soundness test:
• Determined using accelerated weathering test cycles. Porous aggregates subjected to freezing and thawing are
likely to disintegrate prematurely.
• Aggregates are subjected to cycles of alternate wetting in a saturated solution of either sodiumsulphate or
magnesiumsulphate for 16 - 18 hours and then driedin ovento a constant weight
• After five cycles, the loss in weight of aggregates is determined by sieving out all undersized particles and
weighingShape test
• The loss in weight should not exceed:
12 % when tested with sodium sulphate & 18 % with magnesium sulphate solution.
C
i
v
i
l
E
n
g
i
n
e
e
r
i
n
g
D
e
p
a
r
t
m
e
n
t
Tests on Aggregates
Nisarga P, Assistant Professor
The particle size distribution of an aggregate as determined by sieve analysis is termed as gradation of
aggregates.
 The particle size distribution of a mass of aggregate should be such that the smaller particles fill the voids
between the larger particles.
 The proper grading of an aggregate produces dense mix. Therefore, it is essential that coarse and
fine aggregates be well graded to produce quality concrete.
Types of Grading of Aggregates
1. Dense-or well-graded aggregate
2. Gap-graded aggregate
3. Uniformly graded aggregate
4. Open-graded aggregate
C
i
v
i
l
E
n
g
i
n
e
e
r
i
n
g
D
e
p
a
r
t
m
e
n
t
Gradation of Aggregates
Grading Curve
Nisarga P, Assistant Professor
C
i
v
i
l
E
n
g
i
n
e
e
r
i
n
g
D
e
p
a
r
t
m
e
n
t
Gradation of Aggregates
DENSE GRADED GAP GRADED
UNIFORM GRADED OPEN GRADED
Nisarga P, Assistant Professor
C
i
v
i
l
E
n
g
i
n
e
e
r
i
n
g
D
e
p
a
r
t
m
e
n
t
Gradation of Aggregates
 The gradation and size test is used to determine aggregate
particle size distribution.
 In a gradation and size analysis, a sample of dry aggregate
of known weight is separated through a series of sieves
with progressively smaller openings. Once separated, the
weight of particles retained on each sieve is measured and
compared to the total sample weight.
 Particle size distribution is then expressed as a percent
retained by weight on each sieve size.
 Results are usually expressed in tabular or graphical format.
Stacked sieves used for a
gradation and size test
Nisarga P, Assistant Professor
C
i
v
i
l
E
n
g
i
n
e
e
r
i
n
g
D
e
p
a
r
t
m
e
n
t
Gradation of Aggregates
IS Sieve
In mm
Weight
retained
Individual % Cumulativ
e %
% Passing
4.75 0 0 0 0
2.36 0.31 (0.31/5.21)x100=
5.97
(0+5.97) 5.97 (100-5.97)
94.03
1.18 2.08 40.07 (0+5.97+40.07)
46.04
53.96
600µ 1.27 24.47 70.51 29.49
300µ 1.04 20.03 90.54 9.46
75µ 0.36 6.93 97.47 2.53
Pan 0.13 2.50 99.97 0.03
Cumulative % wt retained up to 75µ 310.53
Initial Sample Weight = 5.19kg
Determination of fineness Modulus (FM).
Sand shall be well graded from coarse to fine within
the limits or shall conform to the specified fineness
Modulus (FM).
Fineness Modulus = Σ Cumulative % retained up to sieve 75 μ / 100
= 310.53/100
= 3.1
Nisarga P, Assistant Professor
C
i
v
i
l
E
n
g
i
n
e
e
r
i
n
g
D
e
p
a
r
t
m
e
n
t
Nisarga P, Assistant Professor
Important Terminologies
Maximum Size: One size larger than the nominal maximum aggregate size (NMAS)
NMAS: One sieve size larger than the first sieve to retain more than 10% material
Sieve size
(mm)
Avg. weight
retained
Percentage
Weight Retained
45 0
37.5 30
26.5 70
13.2 500
4.75 700
Sieve size
(mm)
Avg. weight
retained
Percentage
Weight Retained
45 0 0
37.5 30 2.3
26.5 70 5.39
13.2 500 38.46
4.75 700 53.84
NMAS: 26.5mm
Maximum size: 37.5m
C
i
v
i
l
E
n
g
i
n
e
e
r
i
n
g
D
e
p
a
r
t
m
e
n
t
Gradation of Aggregates
FM =?
Nisarga P, Assistant Professor
• FM of coarse aggregate varies from 5.5 to 8.0.
• For all in aggregates or combined aggregates
fineness modulus varies from 3.5 to 6.5
C
i
v
i
l
E
n
g
i
n
e
e
r
i
n
g
D
e
p
a
r
t
m
e
n
t
Aggregate blending by different methods to meet specification
• The properties of the bituminous mix including the density and stability are very much dependent on
the aggregates and their grain size distribution.
• The best gradation produces maximum density.
• Provides more particle-to-particle contact, which in bituminous pavements would increase stability and reduce
water infiltration.
• However, some minimum amount of void space is necessary to:
a) provide adequate volume for the binder to occupy,
b) promote rapid drainage, and
c) provide resistance to frost action for base and sub base courses.
Nisarga P, Assistant Professor
C
i
v
i
l
E
n
g
i
n
e
e
r
i
n
g
D
e
p
a
r
t
m
e
n
t
Aggregate blending by different methods to meet specification
A dense mixture may be obtained when this particle size distribution follows Fuller law which is expressed as:
where, p = percent by weight of the total mixture
passing any given sieve sized,
D = size of the largest particle in that mixture
n = parameter depending on the shape of the
aggregate (0.5 – 0.3 depending on shape
of aggregate)
Based on this law Fuller-Thompson gradation charts were developed by adjusting the parameter n for
fineness or coarseness of aggregates.
Nisarga P, Assistant Professor
C
i
v
i
l
E
n
g
i
n
e
e
r
i
n
g
D
e
p
a
r
t
m
e
n
t
Aggregate blending by different methods to meet specification
For example: Table: 1 provides a Typical gradation for bituminous concrete for a thickness of 40 mm
Nisarga P, Assistant Professor
C
i
v
i
l
E
n
g
i
n
e
e
r
i
n
g
D
e
p
a
r
t
m
e
n
t
Aggregate blending by different methods to meet specification
A good asphalt concrete pavement requires more than asphalt, aggregates and equipment. It also requires
knowledge, skill, and workmanship. Part of this knowledge and skill is the ability to blend aggregates to meet a
specified target, known as the job-mix formula.
Definition of a Job-Mix Formula
In its simplest form, a job-mix formula consists of two parts:
1. The Combined Gradation of the aggregates to be used in the production of the asphalt concrete mixture.
2. The Asphalt Content necessary to produce a satisfactory mix meeting all the specification requirements.
Nisarga P, Assistant Professor
C
i
v
i
l
E
n
g
i
n
e
e
r
i
n
g
D
e
p
a
r
t
m
e
n
t
Aggregate blending by different methods to meet specification
After selecting the aggregates and their gradation, proportioning of aggregates has to be done and following are the
common methods of proportioning of aggregates:
I. Trial and error procedure: Vary the proportion of materials until the required aggregate gradation is achieved.
II. Graphical Methods: Two graphical methods in common use for proportioning of aggregates are
Triangular chart method
Rothfutch’s method
III. Analytical Method: In this method a system of equations are developed based on the gradation of each
aggregates, required gradation, and solved by numerical methods.
Nisarga P, Assistant Professor
C
i
v
i
l
E
n
g
i
n
e
e
r
i
n
g
D
e
p
a
r
t
m
e
n
t
Aggregate blending - Trial and Error Method
Step 1 - Obtain the required data.
a. The gradation of each material must be determined.
b. The design limits for the type of mix must be obtained.
Step 2 - Select a target value for trial blend.
The target value for the combined gradation must be within the design limits of the specifications. This
value now becomes the target for the combined gradation.
Step 3 - Estimate the proportions.
Estimate the correct percentage of each aggregate needed to get a combined gradation near the target value.
For example, if aggregates are combined, a possible combination may be 30% of Aggregate 1 and 70% of
Aggregate 2.
Nisarga P, Assistant Professor
C
i
v
i
l
E
n
g
i
n
e
e
r
i
n
g
D
e
p
a
r
t
m
e
n
t
Aggregate blending - Trial and Error Method
Step 4 - Calculate the combined gradation.
This calculation will show the results of the estimate from Step 3.
Step 5 - Compare the result with the target value.
• If the calculated gradation is close to the target value, no further adjustments need to be made; if not, an
adjustment in the proportions must be made and the calculations repeated.
• The second trial should be closer due to the “experience” received from the first.
• The trials are continued until the proportions of each aggregate are found that will come close to the
target value.
• If the aggregates will not combine within the design range, it may be necessary to use or add different
materials.
Nisarga P, Assistant Professor
C
i
v
i
l
E
n
g
i
n
e
e
r
i
n
g
D
e
p
a
r
t
m
e
n
t
Trial and Error Method
General Math Conversion:
Convert a percent (%)to a decimal, divide by 100
Example: 75%: 75/100 = 0.75
BLENDING WORKSHEET
Use this worksheet to mathematically blend aggregates by hand.
Aggregate blending - Trial and Error Method
Nisarga P, Assistant Professor
C
i
v
i
l
E
n
g
i
n
e
e
r
i
n
g
D
e
p
a
r
t
m
e
n
t
Aggregate Blending - Trial and Error Method
Example Problem No. 1
Trial and Error Combination of Two Aggregates: Aggregate 1 and Aggregate 2
Nisarga P, Assistant Professor
C
i
v
i
l
E
n
g
i
n
e
e
r
i
n
g
D
e
p
a
r
t
m
e
n
t
Step 2 - Determine the target value
Target Value must be within design range.
The Target Value is provided by Mix Design Technician.
Step 1 - Enter the data (aggregate gradations and design
limits) in appropriate columns.
Aggregate Blending - Trial and Error Method
Nisarga P, Assistant Professor
C
i
v
i
l
E
n
g
i
n
e
e
r
i
n
g
D
e
p
a
r
t
m
e
n
t
Step 3 - Estimate the proportions.
The first estimate might be 50% of Aggregate 1 and 50% of Aggregate 2.
Enter these figures on the line marked “% Used”.
Aggregate Blending - Trial and Error Method
Nisarga P, Assistant Professor
C
i
v
i
l
E
n
g
i
n
e
e
r
i
n
g
D
e
p
a
r
t
m
e
n
t
Step 4 - Calculate the individual proportions on each sieve for each of the two aggregates and enter in
the column “% blend”.
Add the two columns for each sieve and enter in the column “Total Blend”.
Aggregate Blending - Trial and Error Method
Nisarga P, Assistant Professor
C
i
v
i
l
E
n
g
i
n
e
e
r
i
n
g
D
e
p
a
r
t
m
e
n
t
Step 5 - Compare this combined gradation Compare the Total Blend with the Target Value.
Observations:
Sieves No. 3/8 and No. 8 are not close to target value, therefore an adjustment needs to be made.
Make adjustment to the Aggregate Percentage being used.
For adjustment:
Use one sieve to make adjustment before recalculating all sieve. This example will use 3/8 sieve
Aggregate Blending - Trial and Error Method
C
i
v
i
l
E
n
g
i
n
e
e
r
i
n
g
D
e
p
a
r
t
m
e
n
t
Calculate the individual proportions on each sieve for each of the two aggregates with proportions 75% and 25%
Aggregate Blending - Trial and Error Method
Nisarga P, Assistant Professor
C
i
v
i
l
E
n
g
i
n
e
e
r
i
n
g
D
e
p
a
r
t
m
e
n
t
Aggregate Blending – Triangular Chart Method
• This is convenient when three materials of different gradations,
consisting of fractions— gravel, sand and silt-clay
• They are represented on a triangular chart on each side of an
equilateral triangle representing the percentages of the three
fractions (0 to 100%, below figure)
• Let the three materials available be represented on the triangular
chart by points A, B and C, based on their constituent fractions-
sand, gravel and silt-clay.
• Let D represent the gradation desired of the material to be
obtained by blending the materials A, B and C.
• Join C and D and extrapolate the line to meet the line AB at E.
• Required proportions of A, B and C can be calculated as:
Nisarga P, Assistant Professor
C
i
v
i
l
E
n
g
i
n
e
e
r
i
n
g
D
e
p
a
r
t
m
e
n
t
Aggregate Blending – Triangular Chart Method
Example:
Let us consider three aggregates are to be blend using the triangular-chart method. The gradations of A, B,
and C and the specifications given in table:
Nisarga P, Assistant Professor
C
i
v
i
l
E
n
g
i
n
e
e
r
i
n
g
D
e
p
a
r
t
m
e
n
t
Aggregate Blending – Triangular Chart Method
Nisarga P, Assistant Professor
The gradations of A, B, and C and the specifications given
in Table 1 are re- tabulated in terms of three separates
defined by the No. 8 and No. 200 sieves.
C
i
v
i
l
E
n
g
i
n
e
e
r
i
n
g
D
e
p
a
r
t
m
e
n
t
Aggregate Blending – Triangular Chart Method
Nisarga P, Assistant Professor
A = × × 100
B = × 100
C = × 100
C
i
v
i
l
E
n
g
i
n
e
e
r
i
n
g
D
e
p
a
r
t
m
e
n
t
Aggregate Blending – Rectangular-Chart or Straight-Line Method
Nisarga P, Assistant Professor
C
i
v
i
l
E
n
g
i
n
e
e
r
i
n
g
D
e
p
a
r
t
m
e
n
t
Rectangular-Chart or Straight-Line Method
Nisarga P, Assistant Professor
Step 1
Step 2
C
i
v
i
l
E
n
g
i
n
e
e
r
i
n
g
D
e
p
a
r
t
m
e
n
t
Rectangular-Chart or Straight-Line Method
Nisarga P, Assistant Professor
Step 3
C
i
v
i
l
E
n
g
i
n
e
e
r
i
n
g
D
e
p
a
r
t
m
e
n
t
Rectangular-Chart or Straight-Line Method
Nisarga P, Assistant Professor
C
i
v
i
l
E
n
g
i
n
e
e
r
i
n
g
D
e
p
a
r
t
m
e
n
t
Rectangular-Chart or Straight-Line Method
Nisarga P, Assistant Professor
Step 4
C
i
v
i
l
E
n
g
i
n
e
e
r
i
n
g
D
e
p
a
r
t
m
e
n
t
Rectangular-Chart or Straight-Line Method
Nisarga P, Assistant Professor
Blending Proportion
Aggregate A = 57%
Aggregate B = 43%
Aggregate
/ sieve
size
19mm 12.5mm 9.5mm 4.75mm 2.36mm 0.60mm 0.30mm 0.15mm 0.075m
m
A (blend %
- 57%)
100x .57 =
57
100x .57 =
57
100x .57 =
57
79x .57 =
45.03
66x .57 =
37.62
41 x .57 =
23.37
38 x .57 =
21.66
21 x .57 =
11.97
12 x .57 =
6.84
B (blend %
- 43%)
43 39.56 23.22 10.32 1.29 0.43 0 0 0
Total blend 100 96.56 80.22 55.35 38.91 23.8 21.66 11.97 6.84
C
i
v
i
l
E
n
g
i
n
e
e
r
i
n
g
D
e
p
a
r
t
m
e
n
t
Bitumen and Tar- Origin
Bitumen is a solid or semisolid, black, sticky,
ductile substance, obtained as an important
byproduct from the distillation of crude petroleum.
Bitumenimplies a group of oftenmixed with
some organic hydrocarbon matter. It is known as
petroleum in the fluid state and asphalt in the solid
state. Bitumen will be dissolved in petroleum oils.
Formation of Bitumen
Bitumen usually forms in environments with abundant algae, plants, and other organic matter. Because of this,
it typically forms under the same conditions as coal, namely in lakes, marshes, and areas of high vegetation
where plant matter can be preserved in mud deposits which become altered due to heat and pressure as they
get buried. The main geological source for bitumen is organic shale.
Nisarga P, Assistant Professor
C
i
v
i
l
E
n
g
i
n
e
e
r
i
n
g
D
e
p
a
r
t
m
e
n
t
Bitumen and Tar- Origin
Tar is a black solid mass that is formed during the destructive
distillation of coal, peat, wood, or other organic material.
It contains 75 to 95% of bituminous contents. It has higher
percentage of carbon and is soluble in carbon disulphide.
Formation of Tar
Tar can form in a variety of ways and tar will have different properties depending on how it forms. Two common types
are coal tar and wood tar. Coal tar is distilled from petroleum and coal sources while wood tar is obtained from
vegetation through a similar destructive distillation process.
Nisarga P, Assistant Professor
3
5
C
i
v
i
l
E
n
g
i
n
e
e
r
i
n
g
D
e
p
a
r
t
m
e
n
t
Difference between Bitumen and Tar
Sl No Bitumen Tar
1 Bitumen is found in black to brown in colour Tar is usually found in brown colour
2 Bitumen is obtained from fractional distillation of
crude oil
Tar is obtained by destructive distillation of coal or
wood
3 Bitumen is soluble in carbon disulphide and
carbon tetra chloride
Tar is soluble in toluene
4 Molecular weight range for road bitumen is 400
to 5000
Molecular weight range for road tar is 150to 3000
5 Bitumen consists of large amount of aromatic
hydrocarbon
Tar consist of large amount of oily matter with
lower molecular weight
6 Bitumen show resistance to coating road
aggregate and also does not retain in presence of
water
Tar coats more easily and retain it better in
presence of water
7 Free carbon content is less Free carbon content is more
8 It shows more resistance to weathering action It shows less resistance to weathering action
9 Less temperature susceptibility More temperature susceptibility
Nisarga P, Assistant Professor
C
i
v
i
l
E
n
g
i
n
e
e
r
i
n
g
D
e
p
a
r
t
m
e
n
t
Bitumen Manufacturing Process
C
i
v
i
l
E
n
g
i
n
e
e
r
i
n
g
D
e
p
a
r
t
m
e
n
t
Bitumen Manufacturing Process
Nisarga P, Assistant Professor
C
i
v
i
l
E
n
g
i
n
e
e
r
i
n
g
D
e
p
a
r
t
m
e
n
t
Chemical Constitution of bituminous road binders
Nisarga P, Assistant Professor
40
C
i
v
i
l
E
n
g
i
n
e
e
r
i
n
g
D
e
p
a
r
t
m
e
n
t
Properties of Bitumen
Adhesion: It should bind materials together properly without affecting the properties of other materials.
Resistance to Water: Bitumen should be highly resistive towards the water Lower water-resistive property leads
to lower durability and lower strength of bitumen. It also leads to low adhesion
Strength: Binding material should also have sufficient strength to resist different live & dead loads (like self-
weight and wheel load)
Viscosity and Flow: Viscosity should not be very low as well as very high because high viscosity leads to
difficulties in the application of bitumen and low viscosity leads to improper binding of materials as it flows fast.
Softening point: Higher the softening point value, lower will be the temperature susceptibility. So, bitumen with
high softening value is preferred for hot climates
Nisarga P, Assistant Professor
40
C
i
v
i
l
E
n
g
i
n
e
e
r
i
n
g
D
e
p
a
r
t
m
e
n
t
Properties of Bitumen
Ductility: Ductility is the property of bitumen that permits it to undergo great deformation or elongation.
Specific Gravity: The property is determined at 27 °C and varies from 0.97 to 1.02.
Durability: Bitumen durability refers to the long-term resistance to oxidative hardening of the material in the field.
Versatility: Bitumen should show a versatile nature. It must be workable during the construction phase and must
be rigid in the operation phase.
Economical: The cost of bitumen depends upon its grade but should be economical to use.
Chemical Resistive: Bitumen has to tackle with different chemicals directly or indirectly (Eg: It has to tackle with
acids in the form of acid rain). So, it should be highly resistive against chemicals.
Nisarga P, Assistant Professor
C
i
v
i
l
E
n
g
i
n
e
e
r
i
n
g
D
e
p
a
r
t
m
e
n
t
Requirements of Bitumen
The desirable properties of bitumen depend on the mix type and construction.
a) Mixing: type of materials used, construction method, temperature during mixing, etc.
b) Attainment of desired stability of the mix
c) To maintain the stability under adverse weather conditions
d) To maintain sufficient flexibility and thus avoid cracking of bituminous surface
e) To have sufficient adhesion with the aggregates in the mix in presence of
Bitumen should posses following desirable properties.
• Viscosity
• Susceptibility
• Adhesion Property
Nisarga P, Assistant Professor
• http://mynotetransengg.blogspot.com/2014/12/blending-of-
aggregates.html
• https://www.civil.iitb.ac.in/tvm/1100_LnTse/406_lnTse/plain/plain.ht
ml#Grade

PMC_Module 1.pdf

  • 1.
    Pavement Materials Module 1 C i v i l E n g i n e e r i n g D e p a r t m e n t Aggregates-Origin, Classification, Requirements, properties and tests on Road aggregates, Concepts of size and gradation- design gradation, maximum aggregate size, aggregate blending by different methods to meet specification. Bitumen and Tar- Origin, Preparation, Properties and Chemical Constitution of bituminous road binders, Requirements.
  • 2.
    AGGREGATES Aggregate is acollective term for the mineral materials such as sand, gravel, and crushed stone that are used with a binding medium (such as water, bitumen, Portland cement, lime, etc.) to form compound materials (such as bituminous concrete and Portland cement concrete). Aggregates are an important ingredient of the materials used in highway construction. Constitutes: By weight, 70% to 85% by weight of PCC and HMA By volume, 60% to 75% for PCC and 75% to 85% for HM C i v i l E n g i n e e r i n g D e p a r t m e n t Nisarga P, Assistant Professor 7
  • 3.
    Aggregates – Origin Mostof the properties of an aggregate is derived from its parental rock chemical and mineral composition which affects strength, stiffness, density, pore structure and permeability. Aggregates can be classified into two main categories: Naturaland CrushedAggregates • Natural aggregates: Rocks experience geothermal and weathering processes which can produce granular materials in the form of natural gravels and sands, which can be used in construction works without any modification or additional processes • Crushed/manufactured: Granular materials produced by human related activities such as blasting, crushing and so on, have rougher surface and more angular shapes comparing to natural sands. C i v i l E n g i n e e r i n g D e p a r t m e n t Nisarga P, Assistant Professor 8
  • 4.
    Origin and Classificationof Aggregates Natural aggregates come from rock, of which there are three broad geological classifications 1. Igneousrock: Formed by solidification of molten magma Based on Crystallinity a) Intrusive rocks: Solidification occurs slowly and are crystalline in nature. Example: Granite, Gabbro b) Extrusive rocks: cools quickly and are fine grained in nature Example: Basalt Based on size grains a) Acidic: Free quarts present, with Silica>66% Specific Gravity<2.75. Example: Granite b) Basic: Free quarts is not present, with Silica<66%, Specific Gravity>2.75. Example: Basalt ( C i v i l E n g i n e e r i n g D e p a r t m e n t Nisarga P, Assistant Professor 9
  • 5.
    Origin and Classificationof Aggregates ( C i v i l E n g i n e e r i n g D e p a r t m e n t Nisarga P, Assistant Professor 1 0 2. Sedimentaryrocks: Obtained by deposition of weathered & transported pre-existing rocks or solutions a) Calcareous: Containing calcium carbonate Example: Limestone, Dolomite b) Siliceous: Containing SiO2. Example: Sandstone c) Argillaceous: Containing clay minerals. Example: Shale 3. Metamorphicrock: Formed under high heat & pressure alteration of either igneous & sedimentary rocks Example: Marble - Limestone Quartzite - Sandstone Slate - Shale Schist - Basalt Gneiss - Granite
  • 6.
    Classification of Aggregates I.According to source or nature of formation a) Natural Aggregate :foundinthenaturalsourcelikeseabed,slopedeposits,riverBasin.Example:sandandgravel,pitRun. b) Crushed Rock aggregates: formed by crushing the various Rocks in quarries Example: stone aggregate. c) Recycled aggregates: The recycled aggregate is manufactured by crushing inert construction and demolition waste. d) Artificial aggregates: The artificial aggregates are made up by various waste material iron ore, artificial cinders, burnt clay, steel rivet etc. C i v i l E n g i n e e r i n g D e p a r t m e n t Nisarga P, Assistant Professor 1 1
  • 7.
    Classification of Aggregates II.Classification of aggregate According to size: a) Coarse Aggregate :Particlessize morethan4.75(80mmto4.75mm) b) Fine aggregates: : Particles size less than 4.75 (4.75 mm to 150 Micron) c) All-in-one aggregates: contains both fine aggregate and coarse aggregate C i v i l E n g i n e e r i n g D e p a r t m e n t Nisarga P, Assistant Professor 12 Coarse Aggregate Fine aggregates Ranges of particle sizes found in aggregates
  • 8.
    Classification of Aggregates C i v i l E n g i n e e r i n g D e p a r t m e n t III.Aggregates according to shape a) Rounded Aggregate b) Angular c) Flaky d) Elongated c) Irregular or partly rounded Nisarga P, Assistant Professor 1 3 Components of Aggregate Shape Properties: Shape, Angularity, and Texture
  • 9.
    Classification of Aggregates C i v i l E n g i n e e r i n g D e p a r t m e n t NisargaP, Assistant Professor 1 4 According to IRC standards, American Association of State Highway and Transportation Officials (AASHTO) and American Society for Testing and Materials (ASTM) standards • Coarse aggregate is retained on the 4.75 mm sieve • Fine aggregate passes through the 4.75 mm sieve and is retained on the 0.075 mm sieve • Filler aggregates , all particles pass through the 0.075 mm sieve
  • 10.
    Desirable Properties orRequirements of aggregates Nisarga P, Assistant Professor 13 • Strength • Hardness • Toughness • Shape of aggregates • Adhesion with bitumen • Durability • Free from deleterious particles C i v i l E n g i n e e r i n g D e p a r t m e n t
  • 11.
    Aggregate tests In orderto decide the suitability of the aggregate for use in pavement construction, following tests are carried out: • Crushing test • Abrasion test • Impact test • Soundness test • Shape test • Specific gravity and water absorption test • Bitumen adhesion test C i v i l E n g i n e e r i n g D e p a r t m e n t Tests on Aggregates Nisarga P, Assistant Professor
  • 12.
    Specific gravity andwater absorption of aggregates: 1. Crushingtest: Aggregate Crushing Value by IRC & MoRTH A value less than 10% signifies an exceptionally strong aggregate, while above 35% would normally be regarded as weak aggregates and not recommended for pavement construction works. 2. Impact test: Aggregate Impact Value recommended by IRC & MoRTH Wearing course - shouldn't exceed 30% Bituminous macadam - shouldn't exceed 35%. Water bound macadam base courses - shouldn't exceed 40%. C i v i l E n g i n e e r i n g D e p a r t m e n t Tests on Aggregates Nisarga P, Assistant Professor
  • 13.
    3. Abrasiontest: AggregateAbrasion Value by IRC & MoRTH WBM base course - shouldn't exceed 40% Bituminous concrete - - shouldn't exceed 35% C i v i l E n g i n e e r i n g D e p a r t m e n t Tests on Aggregates Nisarga P, Assistant Professor
  • 14.
    4. Shape Test FlakinessIndex(FI) & Elongation Index(EI) of aggregates Bituminous concrete and surface dressing: should not exceed 25%; Water Bound Macadam should not exceed 15%. Combined Index (CI) = FI+EI Wet Mix Macadam (WMM, Dense Bituminous Macadam (DBM) and Bituminous Concrete (BC) surface, the value : should not exceed 30% C i v i l E n g i n e e r i n g D e p a r t m e n t Tests on Aggregates Nisarga P, Assistant Professor Flakiness Index- Thickness Gauge Elongation Index- Length Gauge
  • 15.
    5. Specific gravityand water absorptiontest • The specific gravity value for rocks generally varies between 2.6 to 2.9. • Rocks with more than 0.6% water absorption are considered unsatisfactory unless found acceptable based on strength 6. Bitumen adhesion test • Adhesion problem occurs when the aggregate is wet and cold. The presence of water causes stripping of binder from the coated aggregates. • Static immersion test is one specified by IRC and is quite simple • The principle of the test is by immersing aggregate fully coated with binder in water maintained at temperature 40°C for 24 hours • IRC has specified maximum stripping value of aggregates should not exceed 5% C i v i l E n g i n e e r i n g D e p a r t m e n t Tests on Aggregates Nisarga P, Assistant Professor
  • 16.
    Specific gravity andwater absorption of aggregates: Soundness test: • Determined using accelerated weathering test cycles. Porous aggregates subjected to freezing and thawing are likely to disintegrate prematurely. • Aggregates are subjected to cycles of alternate wetting in a saturated solution of either sodiumsulphate or magnesiumsulphate for 16 - 18 hours and then driedin ovento a constant weight • After five cycles, the loss in weight of aggregates is determined by sieving out all undersized particles and weighingShape test • The loss in weight should not exceed: 12 % when tested with sodium sulphate & 18 % with magnesium sulphate solution. C i v i l E n g i n e e r i n g D e p a r t m e n t Tests on Aggregates Nisarga P, Assistant Professor
  • 17.
    The particle sizedistribution of an aggregate as determined by sieve analysis is termed as gradation of aggregates.  The particle size distribution of a mass of aggregate should be such that the smaller particles fill the voids between the larger particles.  The proper grading of an aggregate produces dense mix. Therefore, it is essential that coarse and fine aggregates be well graded to produce quality concrete. Types of Grading of Aggregates 1. Dense-or well-graded aggregate 2. Gap-graded aggregate 3. Uniformly graded aggregate 4. Open-graded aggregate C i v i l E n g i n e e r i n g D e p a r t m e n t Gradation of Aggregates Grading Curve Nisarga P, Assistant Professor
  • 18.
    C i v i l E n g i n e e r i n g D e p a r t m e n t Gradation of Aggregates DENSEGRADED GAP GRADED UNIFORM GRADED OPEN GRADED Nisarga P, Assistant Professor
  • 19.
    C i v i l E n g i n e e r i n g D e p a r t m e n t Gradation of Aggregates The gradation and size test is used to determine aggregate particle size distribution.  In a gradation and size analysis, a sample of dry aggregate of known weight is separated through a series of sieves with progressively smaller openings. Once separated, the weight of particles retained on each sieve is measured and compared to the total sample weight.  Particle size distribution is then expressed as a percent retained by weight on each sieve size.  Results are usually expressed in tabular or graphical format. Stacked sieves used for a gradation and size test Nisarga P, Assistant Professor
  • 20.
    C i v i l E n g i n e e r i n g D e p a r t m e n t Gradation of Aggregates ISSieve In mm Weight retained Individual % Cumulativ e % % Passing 4.75 0 0 0 0 2.36 0.31 (0.31/5.21)x100= 5.97 (0+5.97) 5.97 (100-5.97) 94.03 1.18 2.08 40.07 (0+5.97+40.07) 46.04 53.96 600µ 1.27 24.47 70.51 29.49 300µ 1.04 20.03 90.54 9.46 75µ 0.36 6.93 97.47 2.53 Pan 0.13 2.50 99.97 0.03 Cumulative % wt retained up to 75µ 310.53 Initial Sample Weight = 5.19kg Determination of fineness Modulus (FM). Sand shall be well graded from coarse to fine within the limits or shall conform to the specified fineness Modulus (FM). Fineness Modulus = Σ Cumulative % retained up to sieve 75 μ / 100 = 310.53/100 = 3.1 Nisarga P, Assistant Professor
  • 21.
    C i v i l E n g i n e e r i n g D e p a r t m e n t Nisarga P, AssistantProfessor Important Terminologies Maximum Size: One size larger than the nominal maximum aggregate size (NMAS) NMAS: One sieve size larger than the first sieve to retain more than 10% material Sieve size (mm) Avg. weight retained Percentage Weight Retained 45 0 37.5 30 26.5 70 13.2 500 4.75 700 Sieve size (mm) Avg. weight retained Percentage Weight Retained 45 0 0 37.5 30 2.3 26.5 70 5.39 13.2 500 38.46 4.75 700 53.84 NMAS: 26.5mm Maximum size: 37.5m
  • 22.
    C i v i l E n g i n e e r i n g D e p a r t m e n t Gradation of Aggregates FM=? Nisarga P, Assistant Professor • FM of coarse aggregate varies from 5.5 to 8.0. • For all in aggregates or combined aggregates fineness modulus varies from 3.5 to 6.5
  • 23.
    C i v i l E n g i n e e r i n g D e p a r t m e n t Aggregate blending bydifferent methods to meet specification • The properties of the bituminous mix including the density and stability are very much dependent on the aggregates and their grain size distribution. • The best gradation produces maximum density. • Provides more particle-to-particle contact, which in bituminous pavements would increase stability and reduce water infiltration. • However, some minimum amount of void space is necessary to: a) provide adequate volume for the binder to occupy, b) promote rapid drainage, and c) provide resistance to frost action for base and sub base courses. Nisarga P, Assistant Professor
  • 24.
    C i v i l E n g i n e e r i n g D e p a r t m e n t Aggregate blending bydifferent methods to meet specification A dense mixture may be obtained when this particle size distribution follows Fuller law which is expressed as: where, p = percent by weight of the total mixture passing any given sieve sized, D = size of the largest particle in that mixture n = parameter depending on the shape of the aggregate (0.5 – 0.3 depending on shape of aggregate) Based on this law Fuller-Thompson gradation charts were developed by adjusting the parameter n for fineness or coarseness of aggregates. Nisarga P, Assistant Professor
  • 25.
    C i v i l E n g i n e e r i n g D e p a r t m e n t Aggregate blending bydifferent methods to meet specification For example: Table: 1 provides a Typical gradation for bituminous concrete for a thickness of 40 mm Nisarga P, Assistant Professor
  • 26.
    C i v i l E n g i n e e r i n g D e p a r t m e n t Aggregate blending bydifferent methods to meet specification A good asphalt concrete pavement requires more than asphalt, aggregates and equipment. It also requires knowledge, skill, and workmanship. Part of this knowledge and skill is the ability to blend aggregates to meet a specified target, known as the job-mix formula. Definition of a Job-Mix Formula In its simplest form, a job-mix formula consists of two parts: 1. The Combined Gradation of the aggregates to be used in the production of the asphalt concrete mixture. 2. The Asphalt Content necessary to produce a satisfactory mix meeting all the specification requirements. Nisarga P, Assistant Professor
  • 27.
    C i v i l E n g i n e e r i n g D e p a r t m e n t Aggregate blending bydifferent methods to meet specification After selecting the aggregates and their gradation, proportioning of aggregates has to be done and following are the common methods of proportioning of aggregates: I. Trial and error procedure: Vary the proportion of materials until the required aggregate gradation is achieved. II. Graphical Methods: Two graphical methods in common use for proportioning of aggregates are Triangular chart method Rothfutch’s method III. Analytical Method: In this method a system of equations are developed based on the gradation of each aggregates, required gradation, and solved by numerical methods. Nisarga P, Assistant Professor
  • 28.
    C i v i l E n g i n e e r i n g D e p a r t m e n t Aggregate blending -Trial and Error Method Step 1 - Obtain the required data. a. The gradation of each material must be determined. b. The design limits for the type of mix must be obtained. Step 2 - Select a target value for trial blend. The target value for the combined gradation must be within the design limits of the specifications. This value now becomes the target for the combined gradation. Step 3 - Estimate the proportions. Estimate the correct percentage of each aggregate needed to get a combined gradation near the target value. For example, if aggregates are combined, a possible combination may be 30% of Aggregate 1 and 70% of Aggregate 2. Nisarga P, Assistant Professor
  • 29.
    C i v i l E n g i n e e r i n g D e p a r t m e n t Aggregate blending -Trial and Error Method Step 4 - Calculate the combined gradation. This calculation will show the results of the estimate from Step 3. Step 5 - Compare the result with the target value. • If the calculated gradation is close to the target value, no further adjustments need to be made; if not, an adjustment in the proportions must be made and the calculations repeated. • The second trial should be closer due to the “experience” received from the first. • The trials are continued until the proportions of each aggregate are found that will come close to the target value. • If the aggregates will not combine within the design range, it may be necessary to use or add different materials. Nisarga P, Assistant Professor
  • 30.
    C i v i l E n g i n e e r i n g D e p a r t m e n t Trial and ErrorMethod General Math Conversion: Convert a percent (%)to a decimal, divide by 100 Example: 75%: 75/100 = 0.75 BLENDING WORKSHEET Use this worksheet to mathematically blend aggregates by hand. Aggregate blending - Trial and Error Method Nisarga P, Assistant Professor
  • 31.
    C i v i l E n g i n e e r i n g D e p a r t m e n t Aggregate Blending -Trial and Error Method Example Problem No. 1 Trial and Error Combination of Two Aggregates: Aggregate 1 and Aggregate 2 Nisarga P, Assistant Professor
  • 32.
    C i v i l E n g i n e e r i n g D e p a r t m e n t Step 2 -Determine the target value Target Value must be within design range. The Target Value is provided by Mix Design Technician. Step 1 - Enter the data (aggregate gradations and design limits) in appropriate columns. Aggregate Blending - Trial and Error Method Nisarga P, Assistant Professor
  • 33.
    C i v i l E n g i n e e r i n g D e p a r t m e n t Step 3 -Estimate the proportions. The first estimate might be 50% of Aggregate 1 and 50% of Aggregate 2. Enter these figures on the line marked “% Used”. Aggregate Blending - Trial and Error Method Nisarga P, Assistant Professor
  • 34.
    Nisarga P, AssistantProfessor C i v i l E n g i n e e r i n g D e p a r t m e n t Step 4 - Calculate the individual proportions on each sieve for each of the two aggregates and enter in the column “% blend”. Add the two columns for each sieve and enter in the column “Total Blend”. Aggregate Blending - Trial and Error Method
  • 35.
    Nisarga P, AssistantProfessor C i v i l E n g i n e e r i n g D e p a r t m e n t Step 5 - Compare this combined gradation Compare the Total Blend with the Target Value. Observations: Sieves No. 3/8 and No. 8 are not close to target value, therefore an adjustment needs to be made. Make adjustment to the Aggregate Percentage being used. For adjustment: Use one sieve to make adjustment before recalculating all sieve. This example will use 3/8 sieve Aggregate Blending - Trial and Error Method
  • 36.
    C i v i l E n g i n e e r i n g D e p a r t m e n t Calculate the individualproportions on each sieve for each of the two aggregates with proportions 75% and 25% Aggregate Blending - Trial and Error Method Nisarga P, Assistant Professor
  • 37.
    C i v i l E n g i n e e r i n g D e p a r t m e n t Aggregate Blending –Triangular Chart Method • This is convenient when three materials of different gradations, consisting of fractions— gravel, sand and silt-clay • They are represented on a triangular chart on each side of an equilateral triangle representing the percentages of the three fractions (0 to 100%, below figure) • Let the three materials available be represented on the triangular chart by points A, B and C, based on their constituent fractions- sand, gravel and silt-clay. • Let D represent the gradation desired of the material to be obtained by blending the materials A, B and C. • Join C and D and extrapolate the line to meet the line AB at E. • Required proportions of A, B and C can be calculated as: Nisarga P, Assistant Professor
  • 38.
    C i v i l E n g i n e e r i n g D e p a r t m e n t Aggregate Blending –Triangular Chart Method Example: Let us consider three aggregates are to be blend using the triangular-chart method. The gradations of A, B, and C and the specifications given in table: Nisarga P, Assistant Professor
  • 39.
    C i v i l E n g i n e e r i n g D e p a r t m e n t Aggregate Blending –Triangular Chart Method Nisarga P, Assistant Professor The gradations of A, B, and C and the specifications given in Table 1 are re- tabulated in terms of three separates defined by the No. 8 and No. 200 sieves.
  • 40.
    C i v i l E n g i n e e r i n g D e p a r t m e n t Aggregate Blending –Triangular Chart Method Nisarga P, Assistant Professor A = × × 100 B = × 100 C = × 100
  • 41.
    C i v i l E n g i n e e r i n g D e p a r t m e n t Aggregate Blending –Rectangular-Chart or Straight-Line Method Nisarga P, Assistant Professor
  • 42.
  • 43.
  • 44.
  • 45.
  • 46.
    C i v i l E n g i n e e r i n g D e p a r t m e n t Rectangular-Chart or Straight-LineMethod Nisarga P, Assistant Professor Blending Proportion Aggregate A = 57% Aggregate B = 43% Aggregate / sieve size 19mm 12.5mm 9.5mm 4.75mm 2.36mm 0.60mm 0.30mm 0.15mm 0.075m m A (blend % - 57%) 100x .57 = 57 100x .57 = 57 100x .57 = 57 79x .57 = 45.03 66x .57 = 37.62 41 x .57 = 23.37 38 x .57 = 21.66 21 x .57 = 11.97 12 x .57 = 6.84 B (blend % - 43%) 43 39.56 23.22 10.32 1.29 0.43 0 0 0 Total blend 100 96.56 80.22 55.35 38.91 23.8 21.66 11.97 6.84
  • 47.
    C i v i l E n g i n e e r i n g D e p a r t m e n t Bitumen and Tar-Origin Bitumen is a solid or semisolid, black, sticky, ductile substance, obtained as an important byproduct from the distillation of crude petroleum. Bitumenimplies a group of oftenmixed with some organic hydrocarbon matter. It is known as petroleum in the fluid state and asphalt in the solid state. Bitumen will be dissolved in petroleum oils. Formation of Bitumen Bitumen usually forms in environments with abundant algae, plants, and other organic matter. Because of this, it typically forms under the same conditions as coal, namely in lakes, marshes, and areas of high vegetation where plant matter can be preserved in mud deposits which become altered due to heat and pressure as they get buried. The main geological source for bitumen is organic shale. Nisarga P, Assistant Professor
  • 48.
    C i v i l E n g i n e e r i n g D e p a r t m e n t Bitumen and Tar-Origin Tar is a black solid mass that is formed during the destructive distillation of coal, peat, wood, or other organic material. It contains 75 to 95% of bituminous contents. It has higher percentage of carbon and is soluble in carbon disulphide. Formation of Tar Tar can form in a variety of ways and tar will have different properties depending on how it forms. Two common types are coal tar and wood tar. Coal tar is distilled from petroleum and coal sources while wood tar is obtained from vegetation through a similar destructive distillation process. Nisarga P, Assistant Professor
  • 49.
    3 5 C i v i l E n g i n e e r i n g D e p a r t m e n t Difference between Bitumenand Tar Sl No Bitumen Tar 1 Bitumen is found in black to brown in colour Tar is usually found in brown colour 2 Bitumen is obtained from fractional distillation of crude oil Tar is obtained by destructive distillation of coal or wood 3 Bitumen is soluble in carbon disulphide and carbon tetra chloride Tar is soluble in toluene 4 Molecular weight range for road bitumen is 400 to 5000 Molecular weight range for road tar is 150to 3000 5 Bitumen consists of large amount of aromatic hydrocarbon Tar consist of large amount of oily matter with lower molecular weight 6 Bitumen show resistance to coating road aggregate and also does not retain in presence of water Tar coats more easily and retain it better in presence of water 7 Free carbon content is less Free carbon content is more 8 It shows more resistance to weathering action It shows less resistance to weathering action 9 Less temperature susceptibility More temperature susceptibility Nisarga P, Assistant Professor
  • 50.
  • 51.
  • 52.
    C i v i l E n g i n e e r i n g D e p a r t m e n t Chemical Constitution ofbituminous road binders Nisarga P, Assistant Professor
  • 53.
    40 C i v i l E n g i n e e r i n g D e p a r t m e n t Properties of Bitumen Adhesion:It should bind materials together properly without affecting the properties of other materials. Resistance to Water: Bitumen should be highly resistive towards the water Lower water-resistive property leads to lower durability and lower strength of bitumen. It also leads to low adhesion Strength: Binding material should also have sufficient strength to resist different live & dead loads (like self- weight and wheel load) Viscosity and Flow: Viscosity should not be very low as well as very high because high viscosity leads to difficulties in the application of bitumen and low viscosity leads to improper binding of materials as it flows fast. Softening point: Higher the softening point value, lower will be the temperature susceptibility. So, bitumen with high softening value is preferred for hot climates Nisarga P, Assistant Professor
  • 54.
    40 C i v i l E n g i n e e r i n g D e p a r t m e n t Properties of Bitumen Ductility:Ductility is the property of bitumen that permits it to undergo great deformation or elongation. Specific Gravity: The property is determined at 27 °C and varies from 0.97 to 1.02. Durability: Bitumen durability refers to the long-term resistance to oxidative hardening of the material in the field. Versatility: Bitumen should show a versatile nature. It must be workable during the construction phase and must be rigid in the operation phase. Economical: The cost of bitumen depends upon its grade but should be economical to use. Chemical Resistive: Bitumen has to tackle with different chemicals directly or indirectly (Eg: It has to tackle with acids in the form of acid rain). So, it should be highly resistive against chemicals. Nisarga P, Assistant Professor
  • 55.
    C i v i l E n g i n e e r i n g D e p a r t m e n t Requirements of Bitumen Thedesirable properties of bitumen depend on the mix type and construction. a) Mixing: type of materials used, construction method, temperature during mixing, etc. b) Attainment of desired stability of the mix c) To maintain the stability under adverse weather conditions d) To maintain sufficient flexibility and thus avoid cracking of bituminous surface e) To have sufficient adhesion with the aggregates in the mix in presence of Bitumen should posses following desirable properties. • Viscosity • Susceptibility • Adhesion Property Nisarga P, Assistant Professor
  • 56.