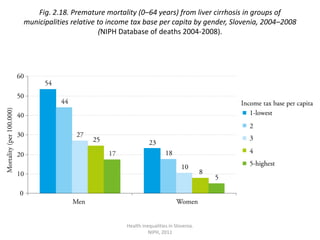
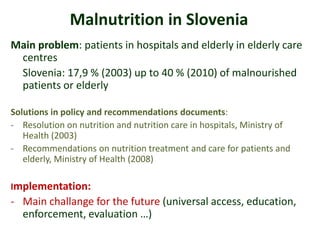
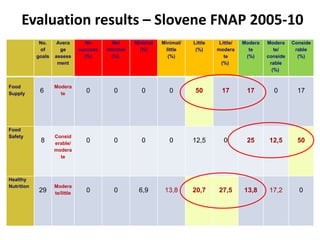
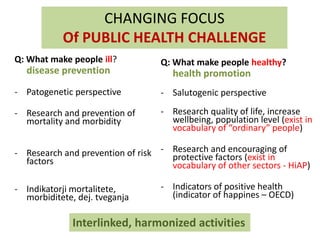
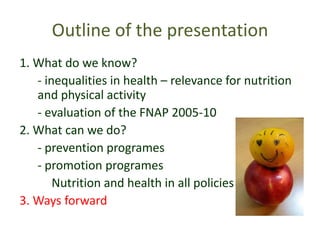
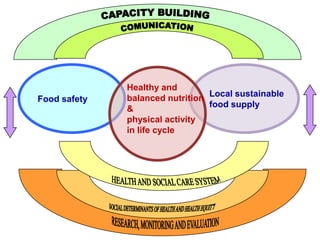
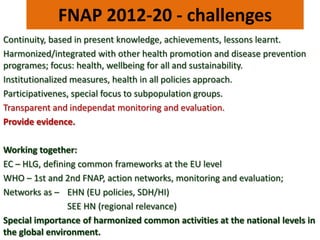
Food and nutrition action plan – lessons learnt and ways forwardMojca Gabrijelčič BlenkušNational Institute of Public Health of the R of SloveniaPREVACT - ACTION FOR PREVENTION Conference on Member States’ Activities on Nutrition, Physical Activity and Smoking related health issuesBudapest, 30th – 31st May 2011
Outline of the presentation1. What do weknow?	- inequalities in health – relevancefornutritionandphysicalactivity	- evaluationofthe FNAP 2005-102. Whatcanwe do?	- preventionprogrames	- promotionprogramesNutritionandhealth in allpolicies3. Waysforward
Health inequalities in Slovenia.NIPH, 2011Fig. 2.2 Infant mortality in the EU and Slovenia per 1000 live births, 2006 (WHO, HFA 2010; NIPH Database of deaths 2004-2008).
Health inequalities in Slovenia.NIPH, 2011Fig. 2.5. Percentage of children by the number of hours of physical activity during a week relative to the family’s socioeconomic status, Slovenia, 2006 (HBSC, 2006).
Health inequalities in Slovenia.NIPH, 2011Fig. 2.6. Percentage of overweight and obese individuals relative to socioeconomic status, Slovenia, 1997 and 2008(Koch, 1997; Gabrijelčič et al., 2009).
Health inequalities in Slovenia.NIPH, 2011Fig. 2.8. Percentage of inhabitants with good or very good self-assessed general health status relative to education and age, Slovenia, 2007 (NIPH EHIS, 2007).
Health inequalities in Slovenia.NIPH, 2011Fig. 2.9. Prevalence of cardiovascular disease relative to social class, population group aged 45–64 years, Slovenia, 2008(CINDI Slovenia, 2008).
Health inequalities in Slovenia.NIPH, 2011Fig. 2.18. Premature mortality (0–64 years) from liver cirrhosis in groups of municipalities relative to income tax base per capita by gender, Slovenia, 2004–2008 (NIPH Database of deaths 2004-2008).
Foods and food groups in daily nutrition in adult population in Slovenia, by self-estimated SESSouce: Gabrijelčič Blenkuš et all, 2009
Foods and food groups in daily nutrition in adult population in Slovenia, by age groupsSouce: Gabrijelčič Blenkuš et all, 2009
Analytical data“Milk slices”: sugars: 25,8 – 35,7 g/100 g
totalfats: 22,9 – 36,2 g/100gTrans fats in products: - 	savouryshacks: 38,5%, 24,8%chocolatecake: 15,2 %
rolles: 7,1 %Brekfastcerealssugars: 23% up to 48 % E in differentsamplesMalnutrition in SloveniaMain problem: patients in hospitalsandelderly in elderlycarecentresSlovenia: 17,9 % (2003) up to 40 % (2010) ofmalnourishedpatients or elderlySolutions in policyandrecommendationsdocuments: Resolution on nutritionandnutritioncare in hospitals, MinistryofHealth (2003)
Recommendations on nutritiontreatmentandcareforpatientsandelderly, MinistryofHealth (2008)Implementation:Mainchallangeforthefuture(universalaccess, education, enforcement, evaluation …)BATON (2008)Comparison of frequencies of reported activities in different target populations, for the past and future period
Evaluationresults – Slovene FNAP 2005-10
Outline of the presentation1. What do weknow?	- inequalities in health – relevancefornutritionandphysicalactivity	- evaluationofthe FNAP 2005-102. Whatcanwe do?	- preventionprogrames	- promotionprogramesNutritionandhealth in allpolicies3. Waysforward
CHANGING FOCUS Of PUBLIC HEALTH CHALLENGEQ: What make peopleill?diseasepreventionPatogeneticperspective
Researchandpreventionofmortalityandmorbidity
Researchandpreventionofriskfactors
Indikatorji mortalitete, morbiditete, dej. tveganjaQ: What make peoplehealthy?healthpromotionSalutogenicperspective
Researchqualityoflife, increasewellbeing, populationlevel (exist in vocabularyof “ordinary” people)
Researchandencouragingofprotectivefactors (exist in vocabularyofothersectors - HiAP)
Indicatorsofpositivehealth (indicatorofhappines – OECD)Interlinked, harmonizedactivities
Diseasepreventionprogrames, with HP componentsNationaldiseasepreventionprogrames in SloveniaDiabetesCancer, includingcancerscreeningCardiovasculardiseasesHolisticapproach to thepatient at theprimaryhealthlevelChronicdiseasesstrategyforSloveniaJointactionforcancer at EU level – outcomeofSlovenepresidency 2008Healthcaresystem
SchoolenvironmentNationalNutritionandphysicalactivity are part of a regularcuriculla in schools
Nationalschoolnutrition programeEU levelESF used by Mo Education, developmentof a model “Healthylifestyle in schoolenvironment”
CAP SchoolfruitschemeWHO- 2nd FNAP andactionnetworks (marketing: ban on vendingmachines, May 2010)- SlovenehealthyschoolsnetworkNutritionfriendlyschoolinitiative (as a pilot) ALCOHOL AndTOBACOMENTAL HEALTHPHYSICAL ACTIVITYNUTRITION(SuportingCAP SFS)

Plenary3 m gabrijelcic

  • 1.
    Food and nutritionaction plan – lessons learnt and ways forwardMojca Gabrijelčič BlenkušNational Institute of Public Health of the R of SloveniaPREVACT - ACTION FOR PREVENTION Conference on Member States’ Activities on Nutrition, Physical Activity and Smoking related health issuesBudapest, 30th – 31st May 2011
  • 2.
    Outline of thepresentation1. What do weknow? - inequalities in health – relevancefornutritionandphysicalactivity - evaluationofthe FNAP 2005-102. Whatcanwe do? - preventionprogrames - promotionprogramesNutritionandhealth in allpolicies3. Waysforward
  • 3.
    Outline of thepresentation1. What do weknow? - inequalities in health – relevancefornutritionandphysicalactivity - evaluationofthe FNAP 2005-102. Whatcanwe do? - preventionprogrames - promotionprogramesNutritionandhealth in allpolicies3. Waysforward
  • 4.
    Health inequalities inSlovenia.NIPH, 2011Fig. 2.2 Infant mortality in the EU and Slovenia per 1000 live births, 2006 (WHO, HFA 2010; NIPH Database of deaths 2004-2008).
  • 5.
    Health inequalities inSlovenia.NIPH, 2011Fig. 2.5. Percentage of children by the number of hours of physical activity during a week relative to the family’s socioeconomic status, Slovenia, 2006 (HBSC, 2006).
  • 6.
    Health inequalities inSlovenia.NIPH, 2011Fig. 2.6. Percentage of overweight and obese individuals relative to socioeconomic status, Slovenia, 1997 and 2008(Koch, 1997; Gabrijelčič et al., 2009).
  • 7.
    Health inequalities inSlovenia.NIPH, 2011Fig. 2.8. Percentage of inhabitants with good or very good self-assessed general health status relative to education and age, Slovenia, 2007 (NIPH EHIS, 2007).
  • 8.
    Health inequalities inSlovenia.NIPH, 2011Fig. 2.9. Prevalence of cardiovascular disease relative to social class, population group aged 45–64 years, Slovenia, 2008(CINDI Slovenia, 2008).
  • 9.
    Health inequalities inSlovenia.NIPH, 2011Fig. 2.18. Premature mortality (0–64 years) from liver cirrhosis in groups of municipalities relative to income tax base per capita by gender, Slovenia, 2004–2008 (NIPH Database of deaths 2004-2008).
  • 10.
    Foods and foodgroups in daily nutrition in adult population in Slovenia, by self-estimated SESSouce: Gabrijelčič Blenkuš et all, 2009
  • 11.
    Foods and foodgroups in daily nutrition in adult population in Slovenia, by age groupsSouce: Gabrijelčič Blenkuš et all, 2009
  • 12.
    Analytical data“Milk slices”:sugars: 25,8 – 35,7 g/100 g
  • 13.
    totalfats: 22,9 –36,2 g/100gTrans fats in products: - savouryshacks: 38,5%, 24,8%chocolatecake: 15,2 %
  • 14.
    rolles: 7,1 %Brekfastcerealssugars:23% up to 48 % E in differentsamplesMalnutrition in SloveniaMain problem: patients in hospitalsandelderly in elderlycarecentresSlovenia: 17,9 % (2003) up to 40 % (2010) ofmalnourishedpatients or elderlySolutions in policyandrecommendationsdocuments: Resolution on nutritionandnutritioncare in hospitals, MinistryofHealth (2003)
  • 15.
    Recommendations on nutritiontreatmentandcareforpatientsandelderly,MinistryofHealth (2008)Implementation:Mainchallangeforthefuture(universalaccess, education, enforcement, evaluation …)BATON (2008)Comparison of frequencies of reported activities in different target populations, for the past and future period
  • 16.
  • 17.
    Outline of thepresentation1. What do weknow? - inequalities in health – relevancefornutritionandphysicalactivity - evaluationofthe FNAP 2005-102. Whatcanwe do? - preventionprogrames - promotionprogramesNutritionandhealth in allpolicies3. Waysforward
  • 18.
    CHANGING FOCUS OfPUBLIC HEALTH CHALLENGEQ: What make peopleill?diseasepreventionPatogeneticperspective
  • 19.
  • 20.
  • 21.
    Indikatorji mortalitete, morbiditete,dej. tveganjaQ: What make peoplehealthy?healthpromotionSalutogenicperspective
  • 22.
    Researchqualityoflife, increasewellbeing, populationlevel(exist in vocabularyof “ordinary” people)
  • 23.
  • 24.
    Indicatorsofpositivehealth (indicatorofhappines –OECD)Interlinked, harmonizedactivities
  • 25.
    Diseasepreventionprogrames, with HPcomponentsNationaldiseasepreventionprogrames in SloveniaDiabetesCancer, includingcancerscreeningCardiovasculardiseasesHolisticapproach to thepatient at theprimaryhealthlevelChronicdiseasesstrategyforSloveniaJointactionforcancer at EU level – outcomeofSlovenepresidency 2008Healthcaresystem
  • 26.
  • 27.
    Nationalschoolnutrition programeEU levelESFused by Mo Education, developmentof a model “Healthylifestyle in schoolenvironment”
  • 28.
    CAP SchoolfruitschemeWHO- 2ndFNAP andactionnetworks (marketing: ban on vendingmachines, May 2010)- SlovenehealthyschoolsnetworkNutritionfriendlyschoolinitiative (as a pilot) ALCOHOL AndTOBACOMENTAL HEALTHPHYSICAL ACTIVITYNUTRITION(SuportingCAP SFS)