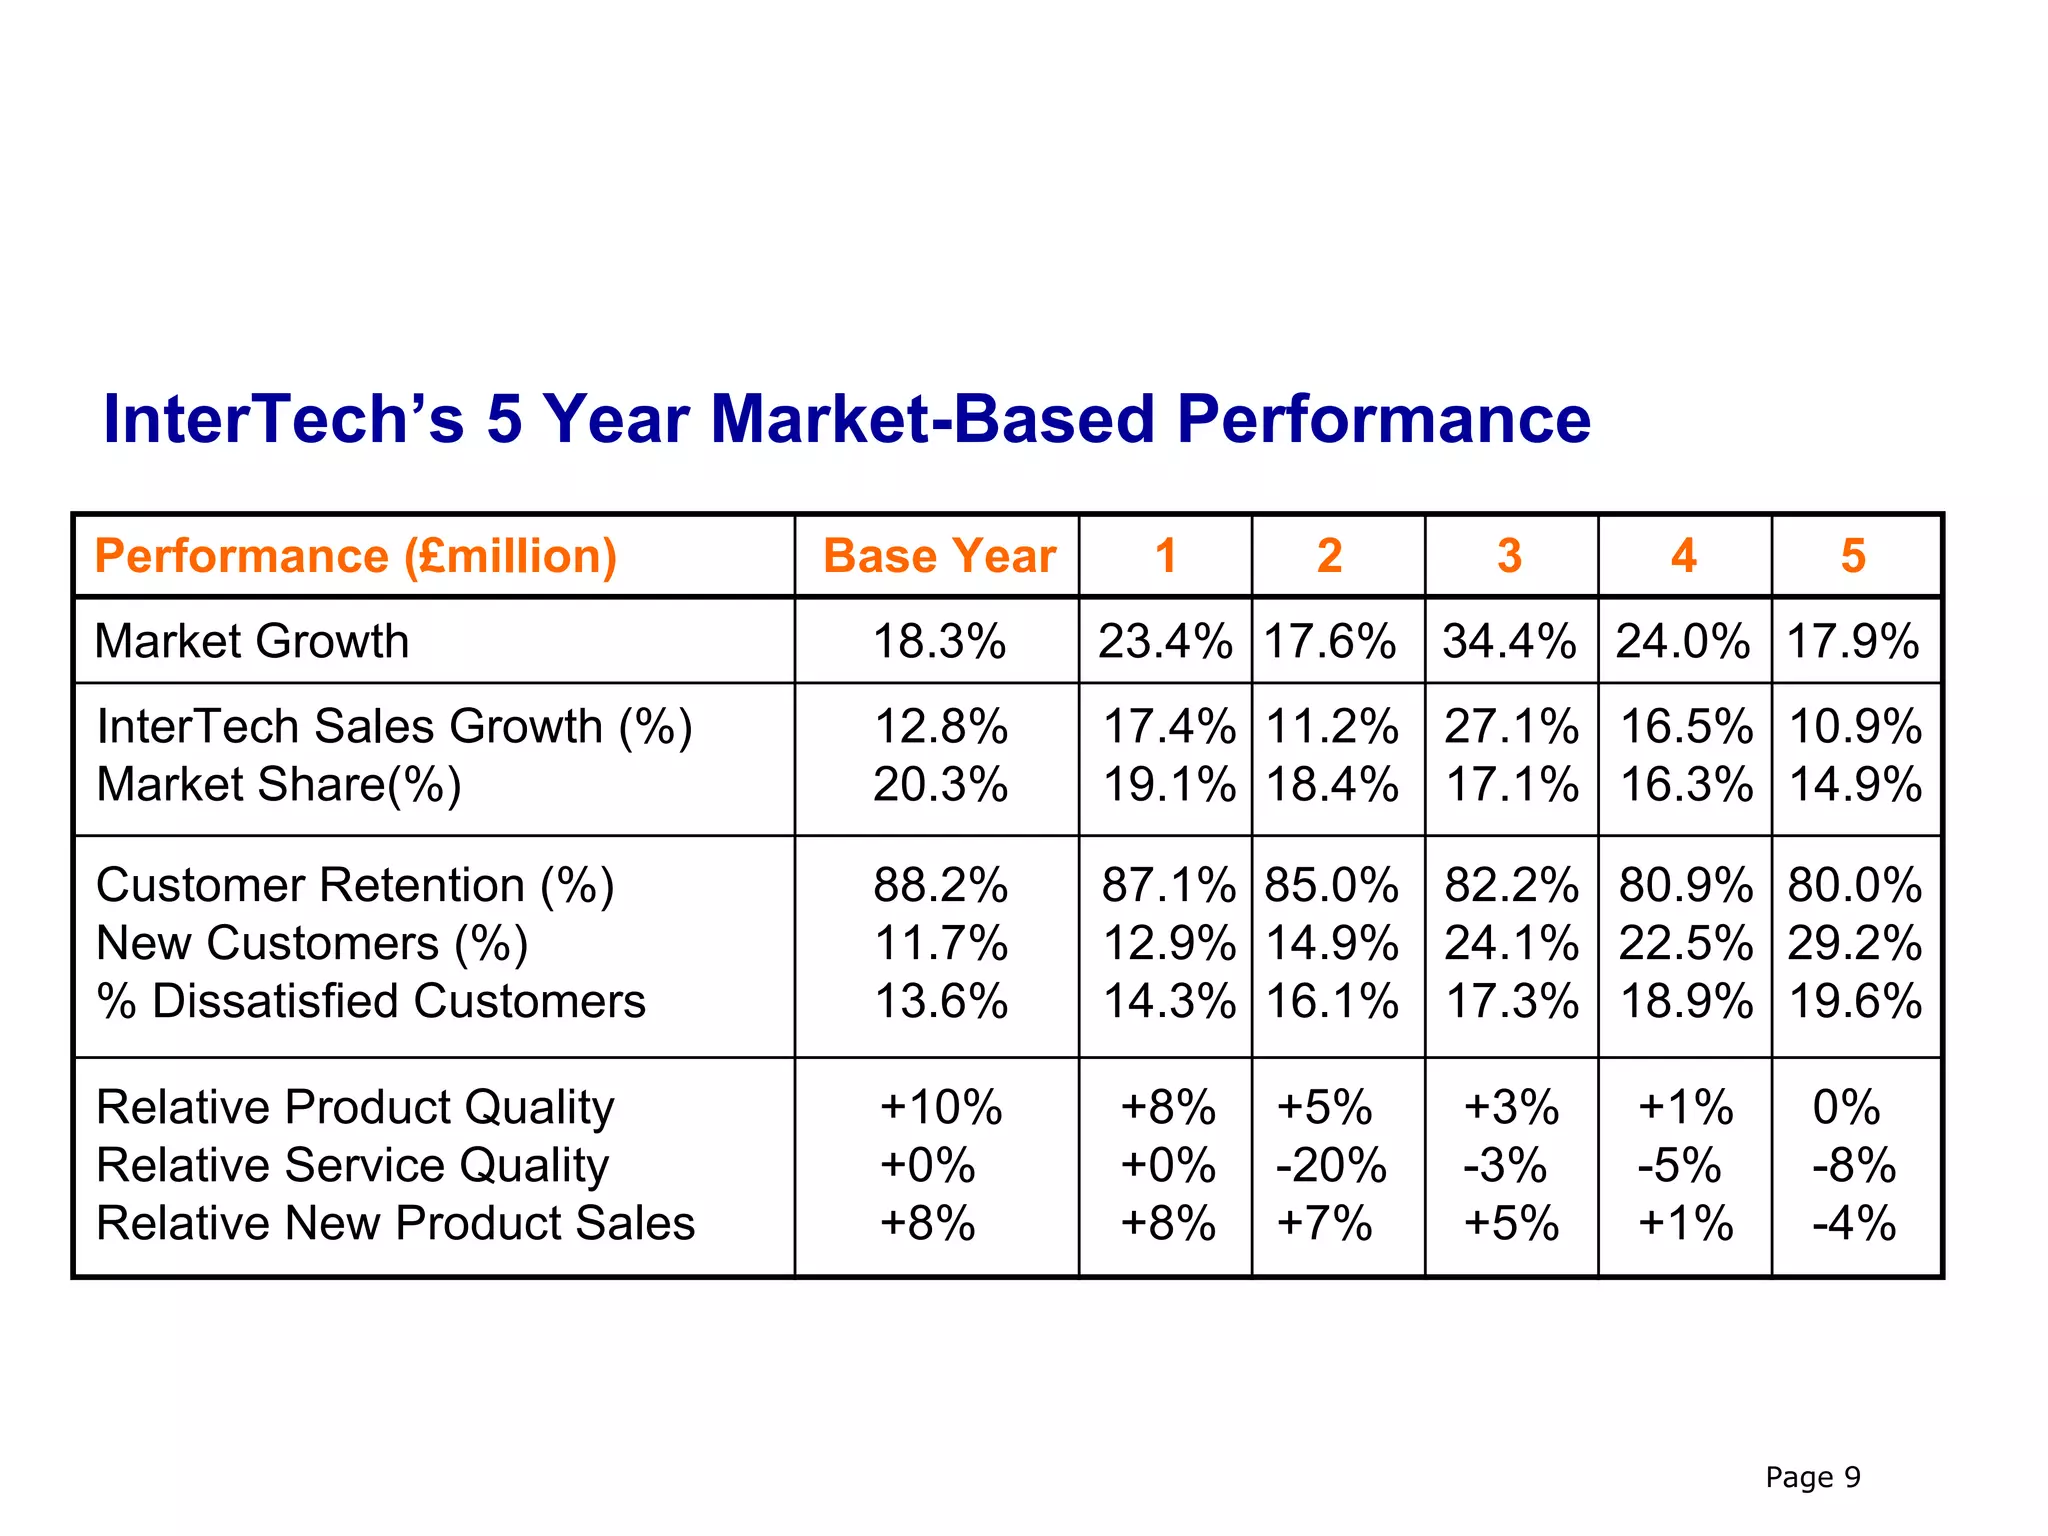
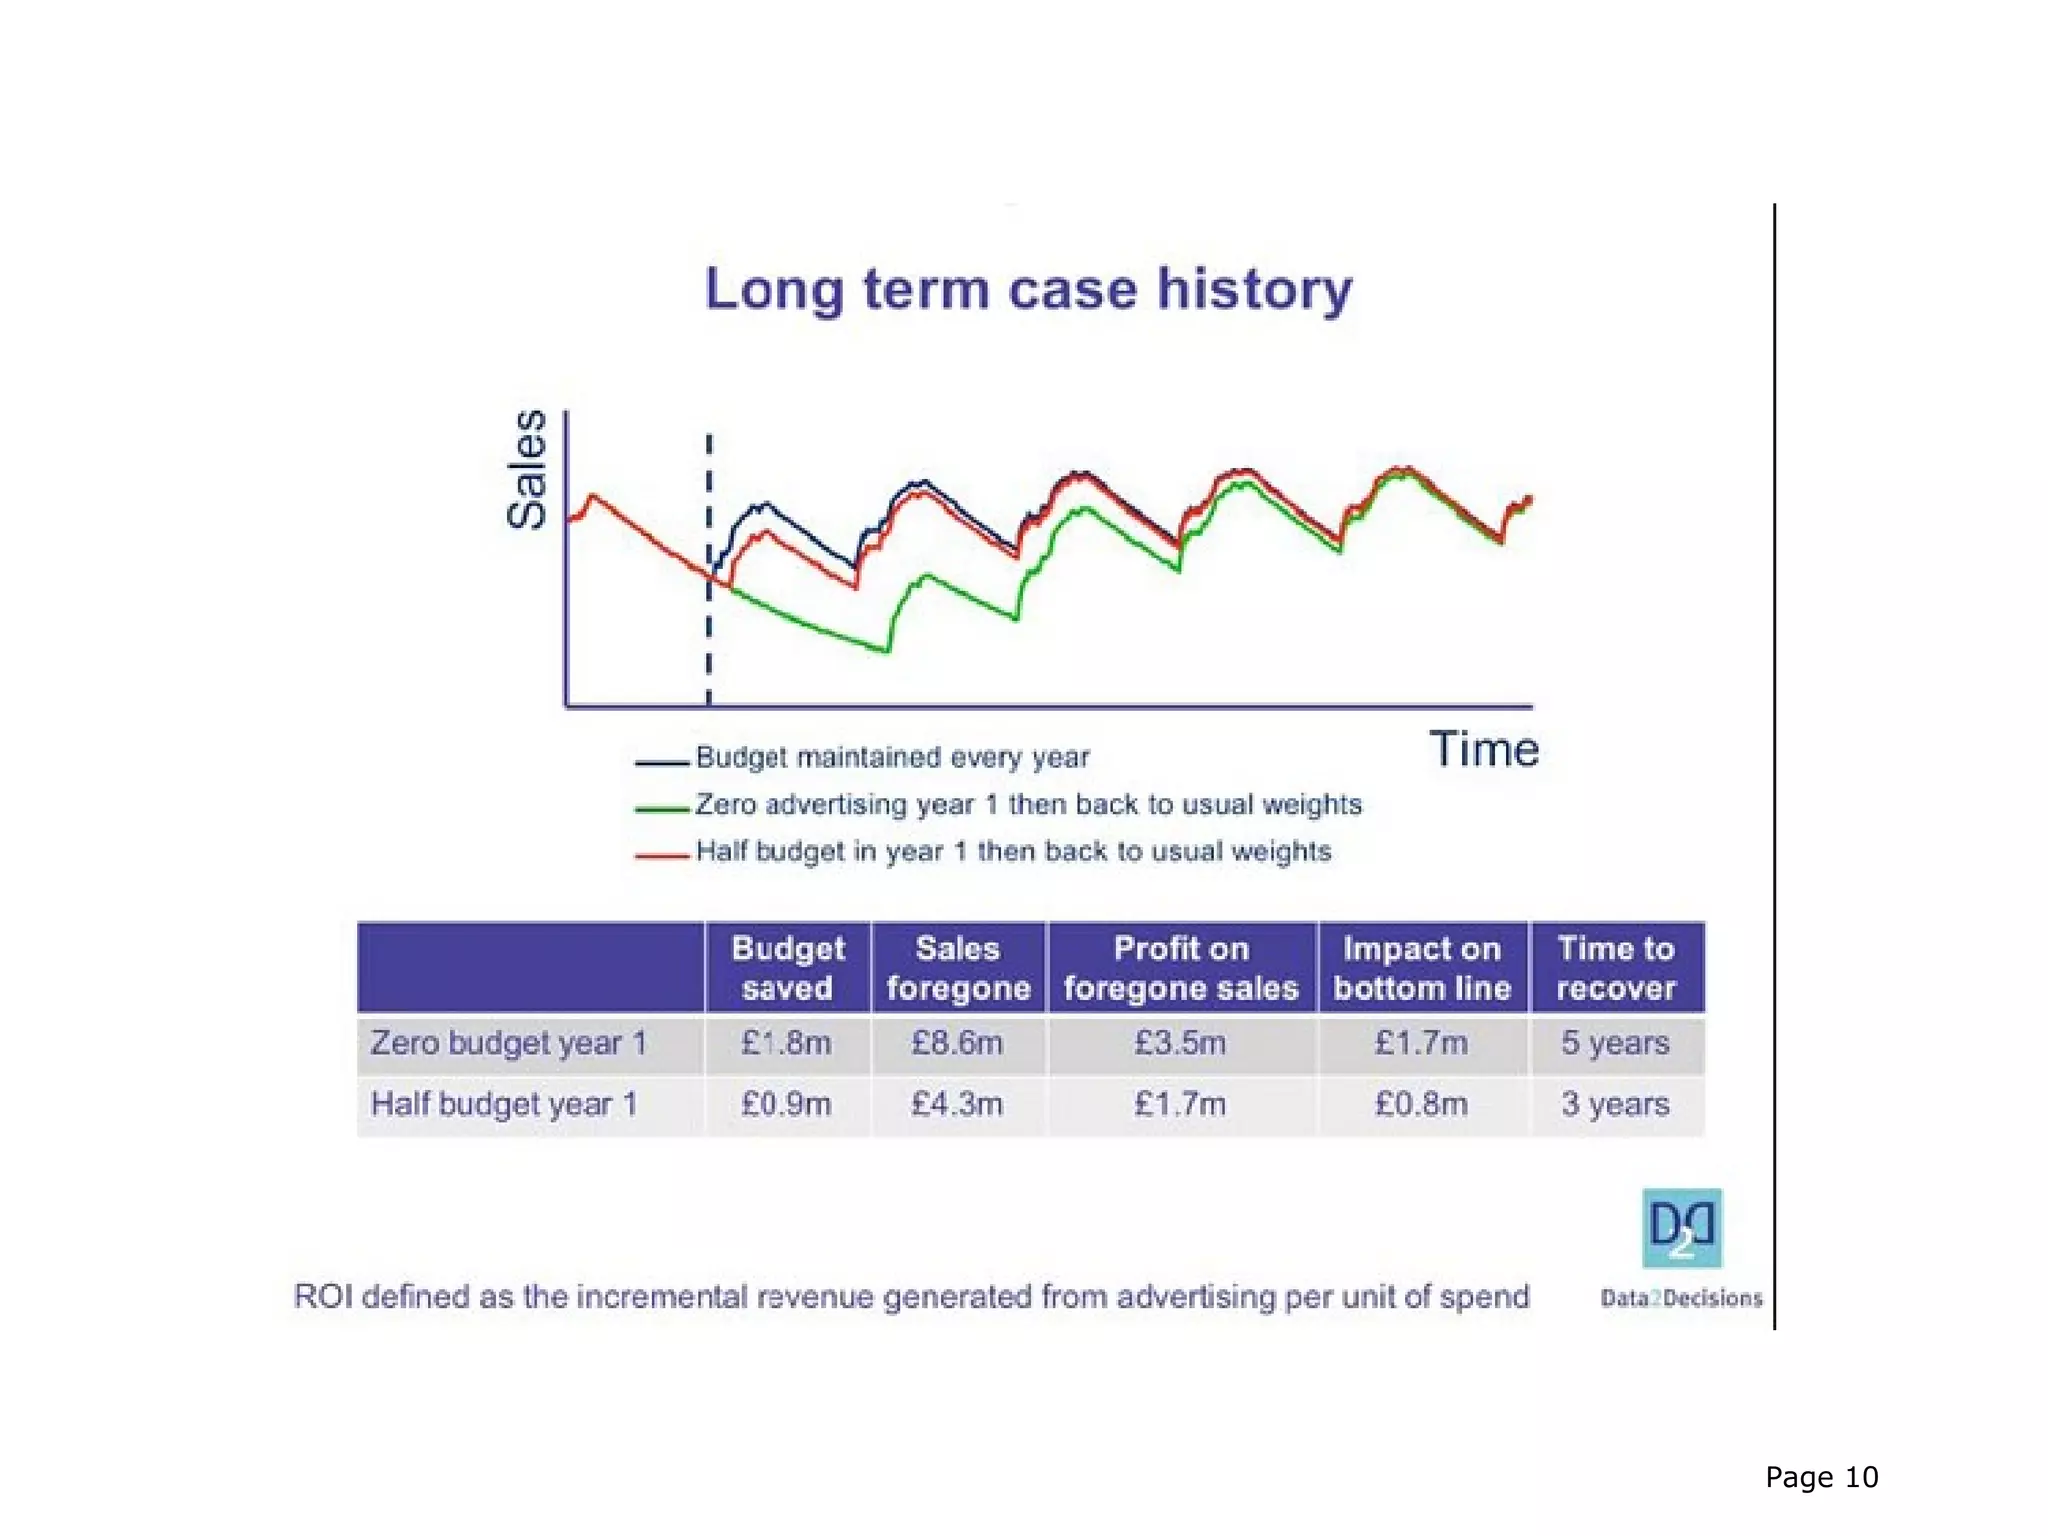
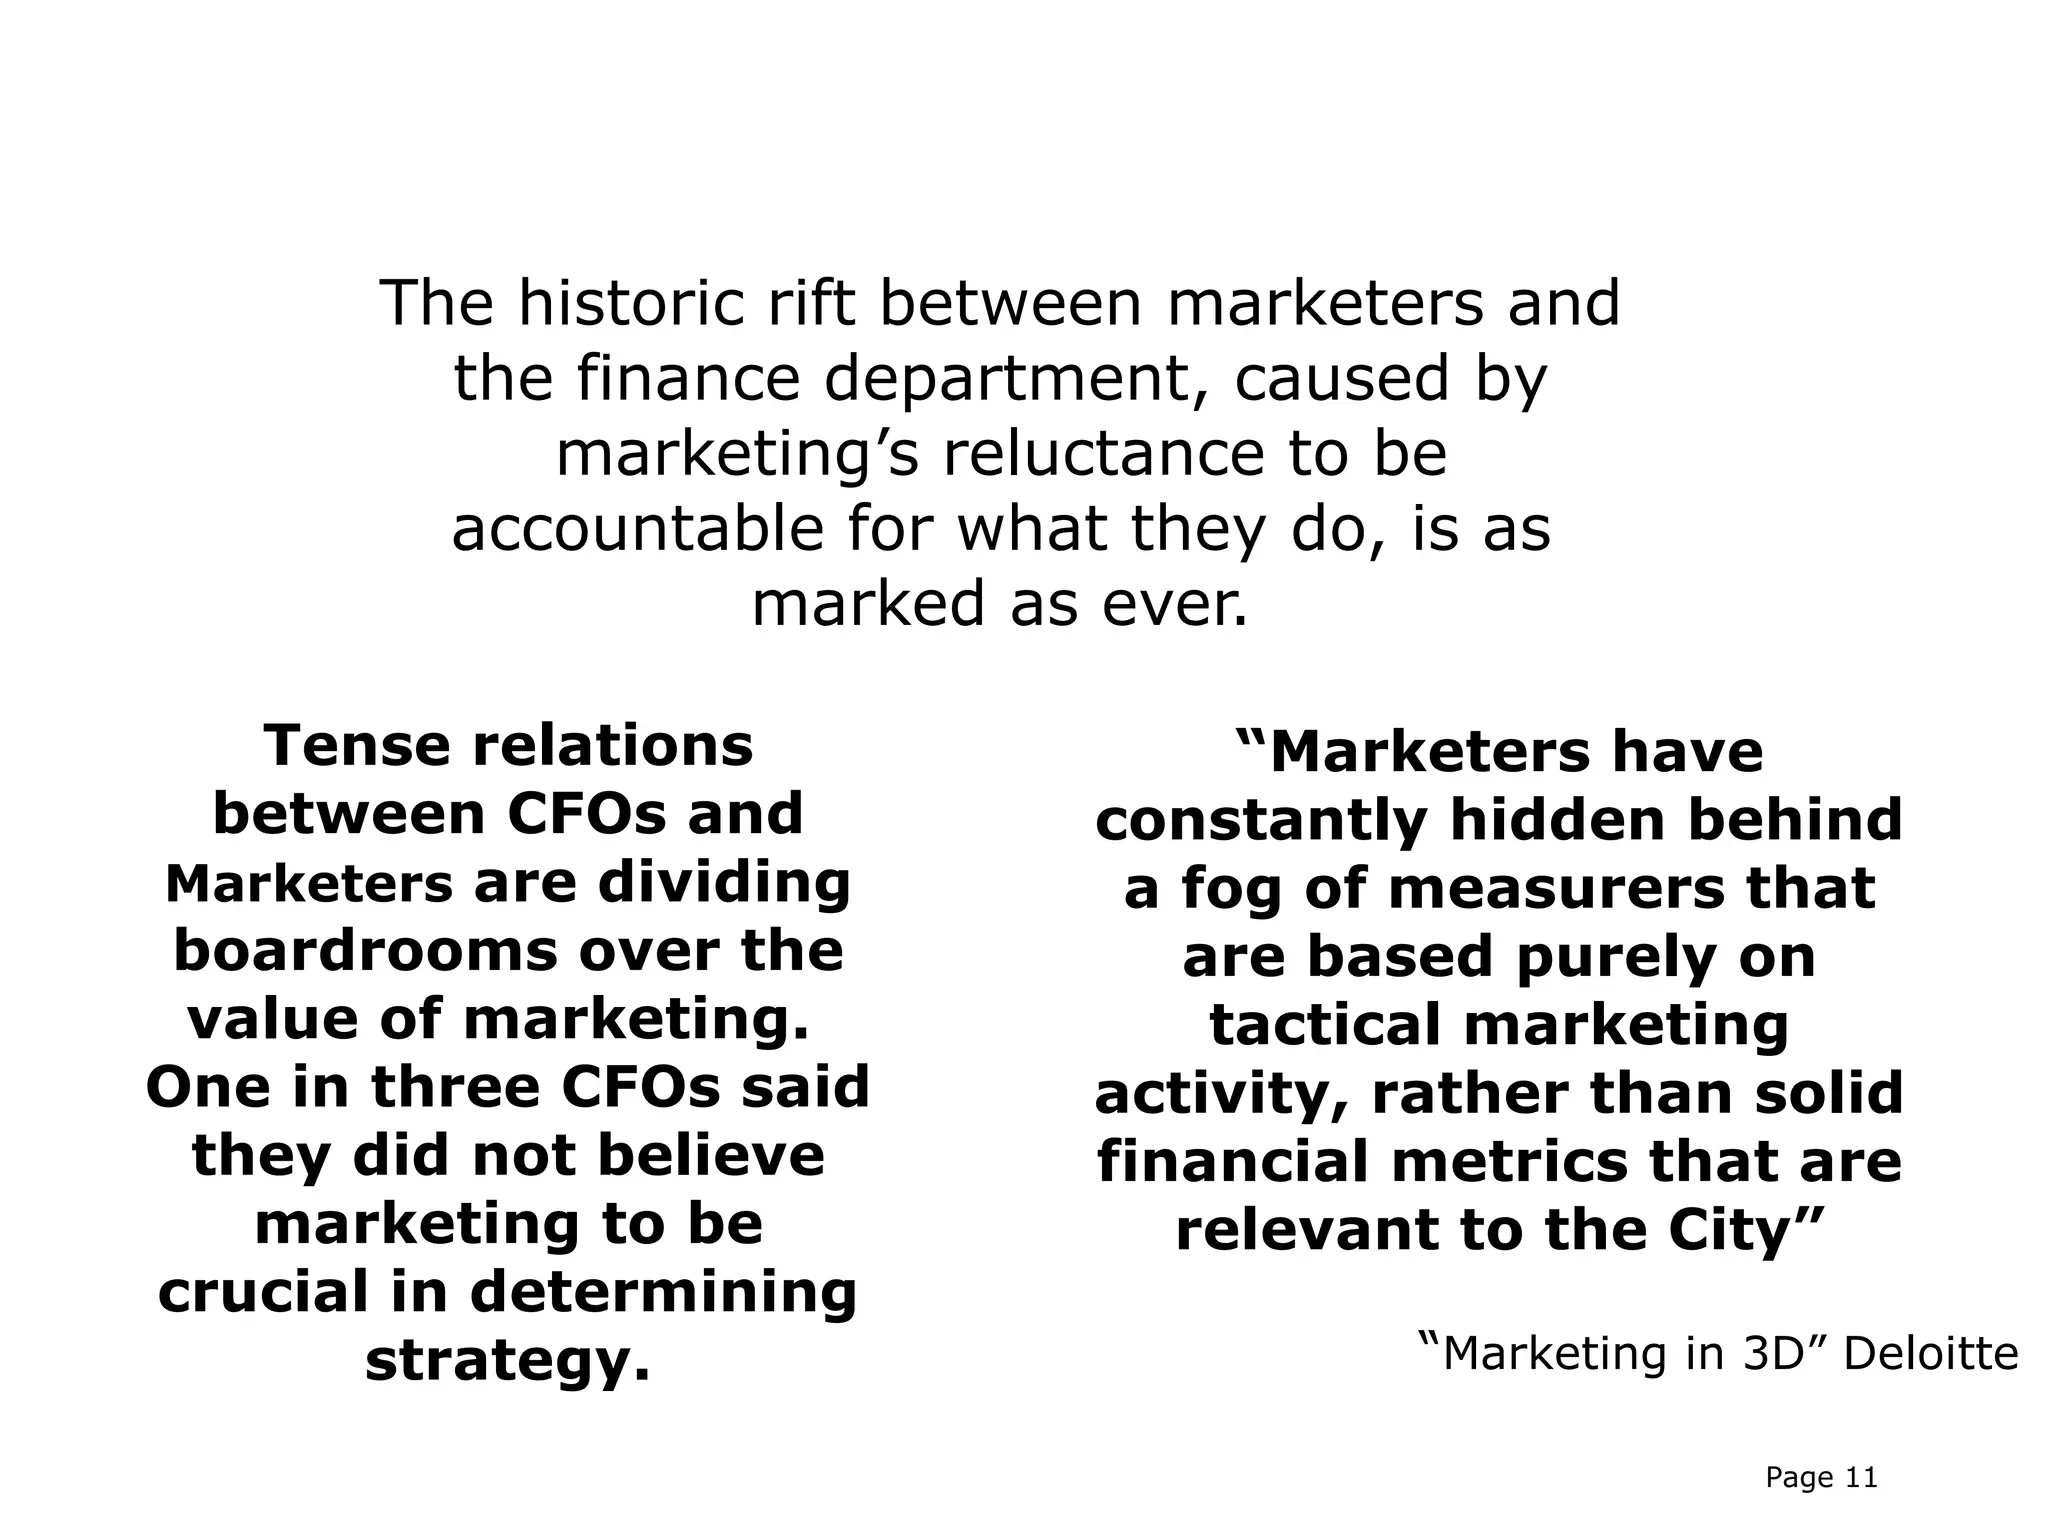
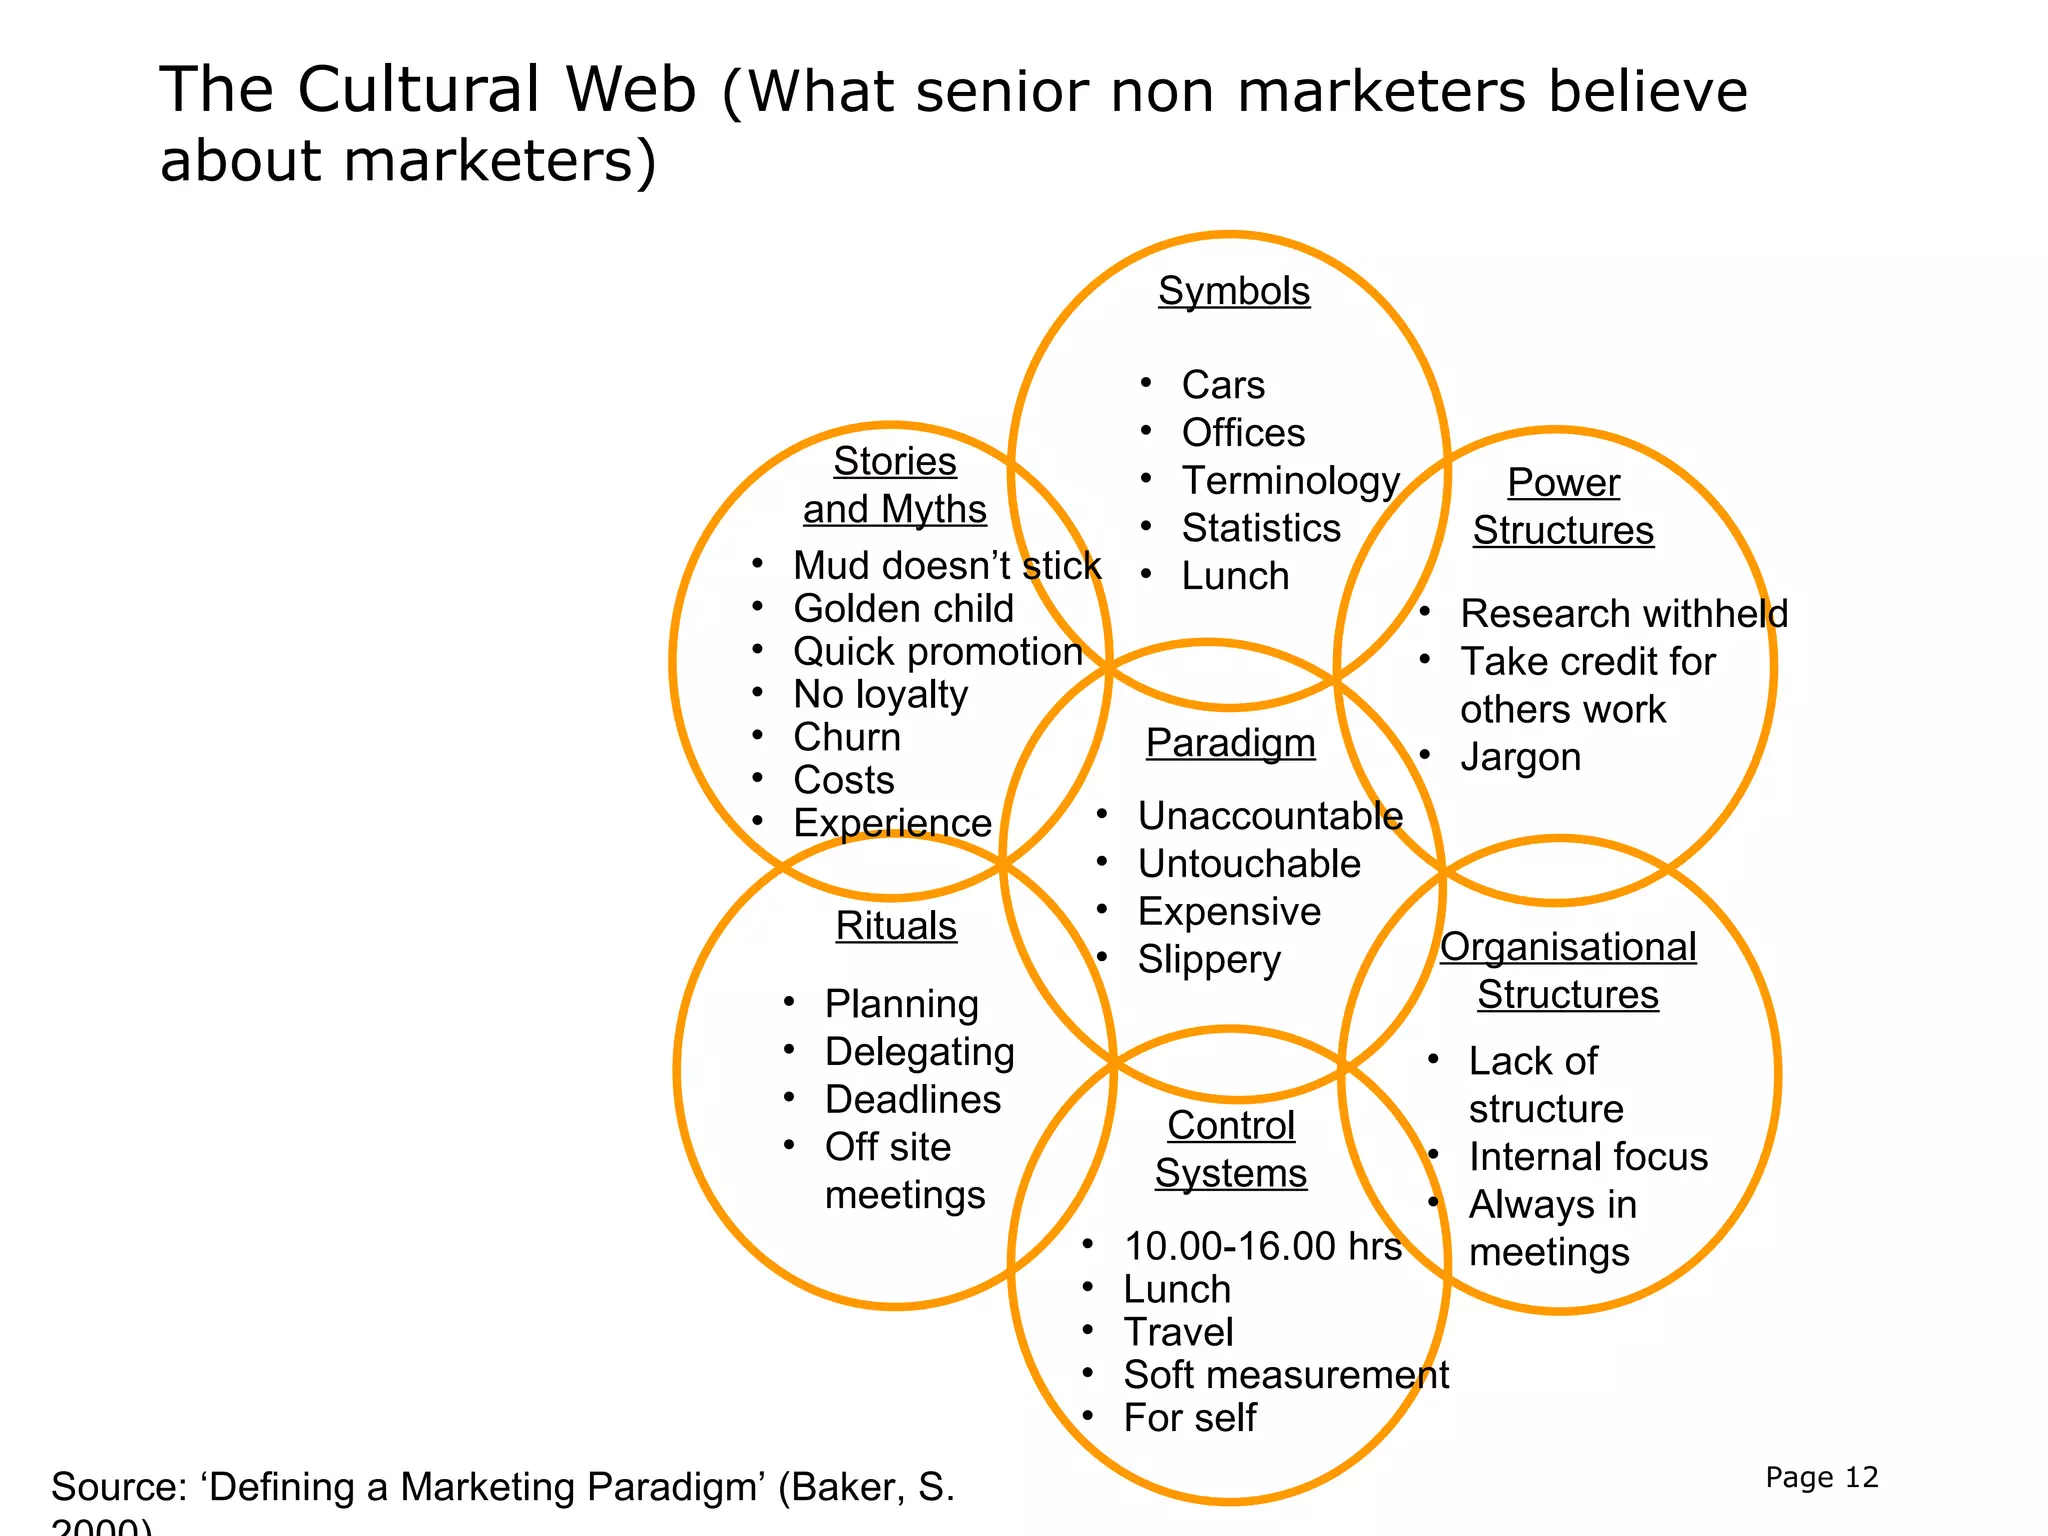
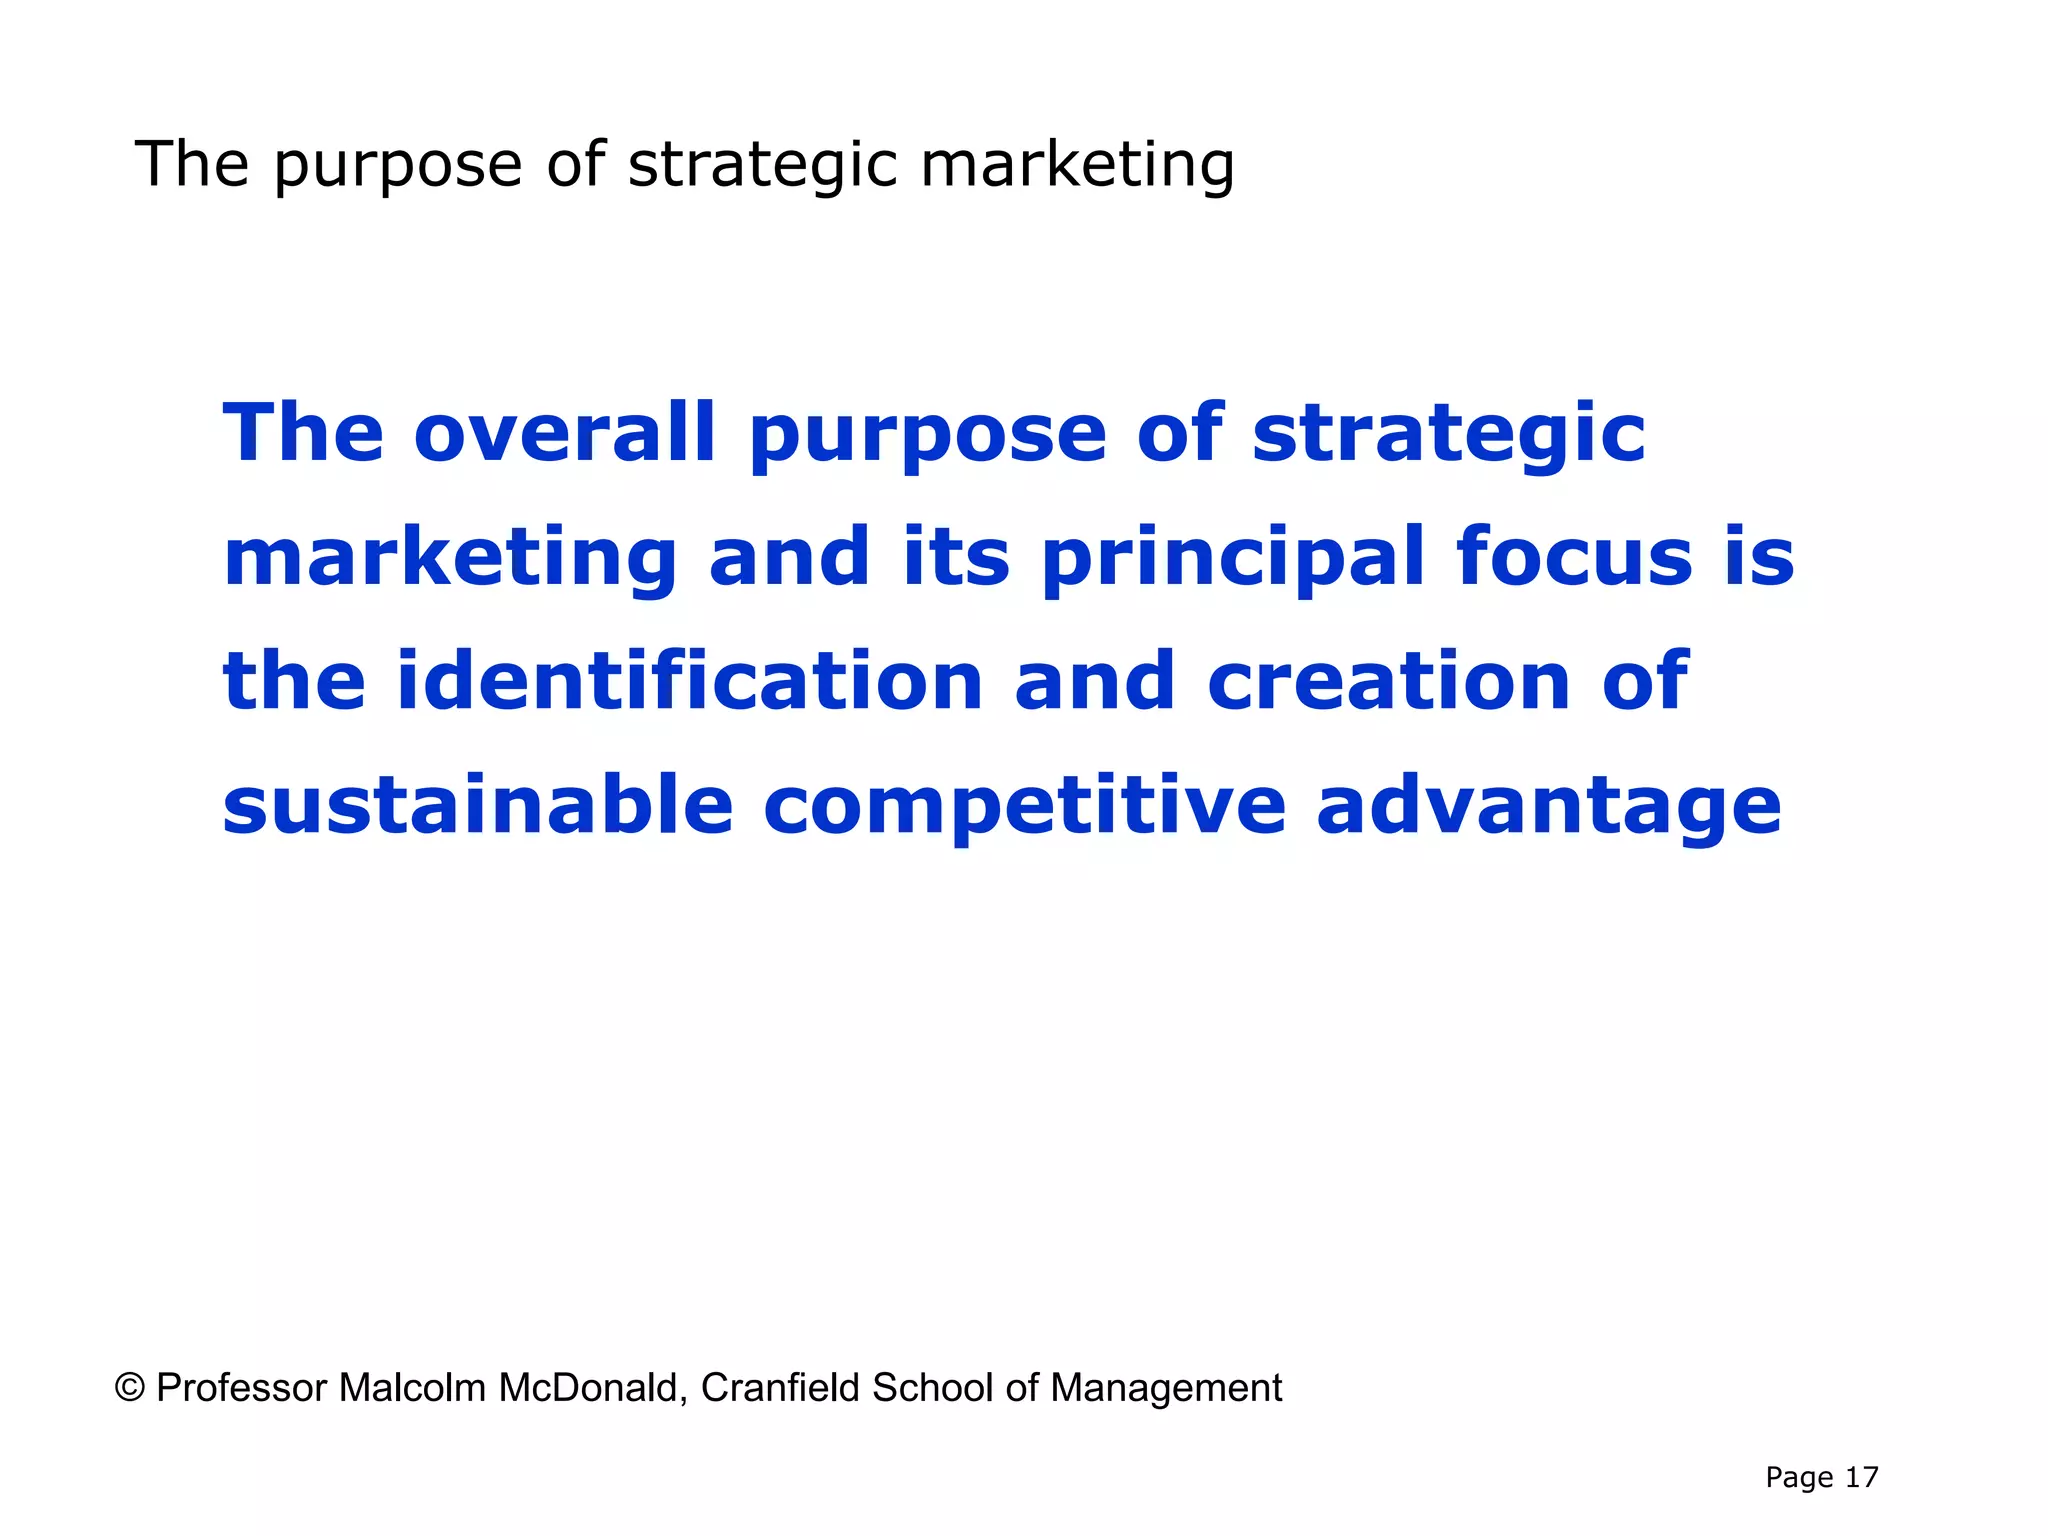
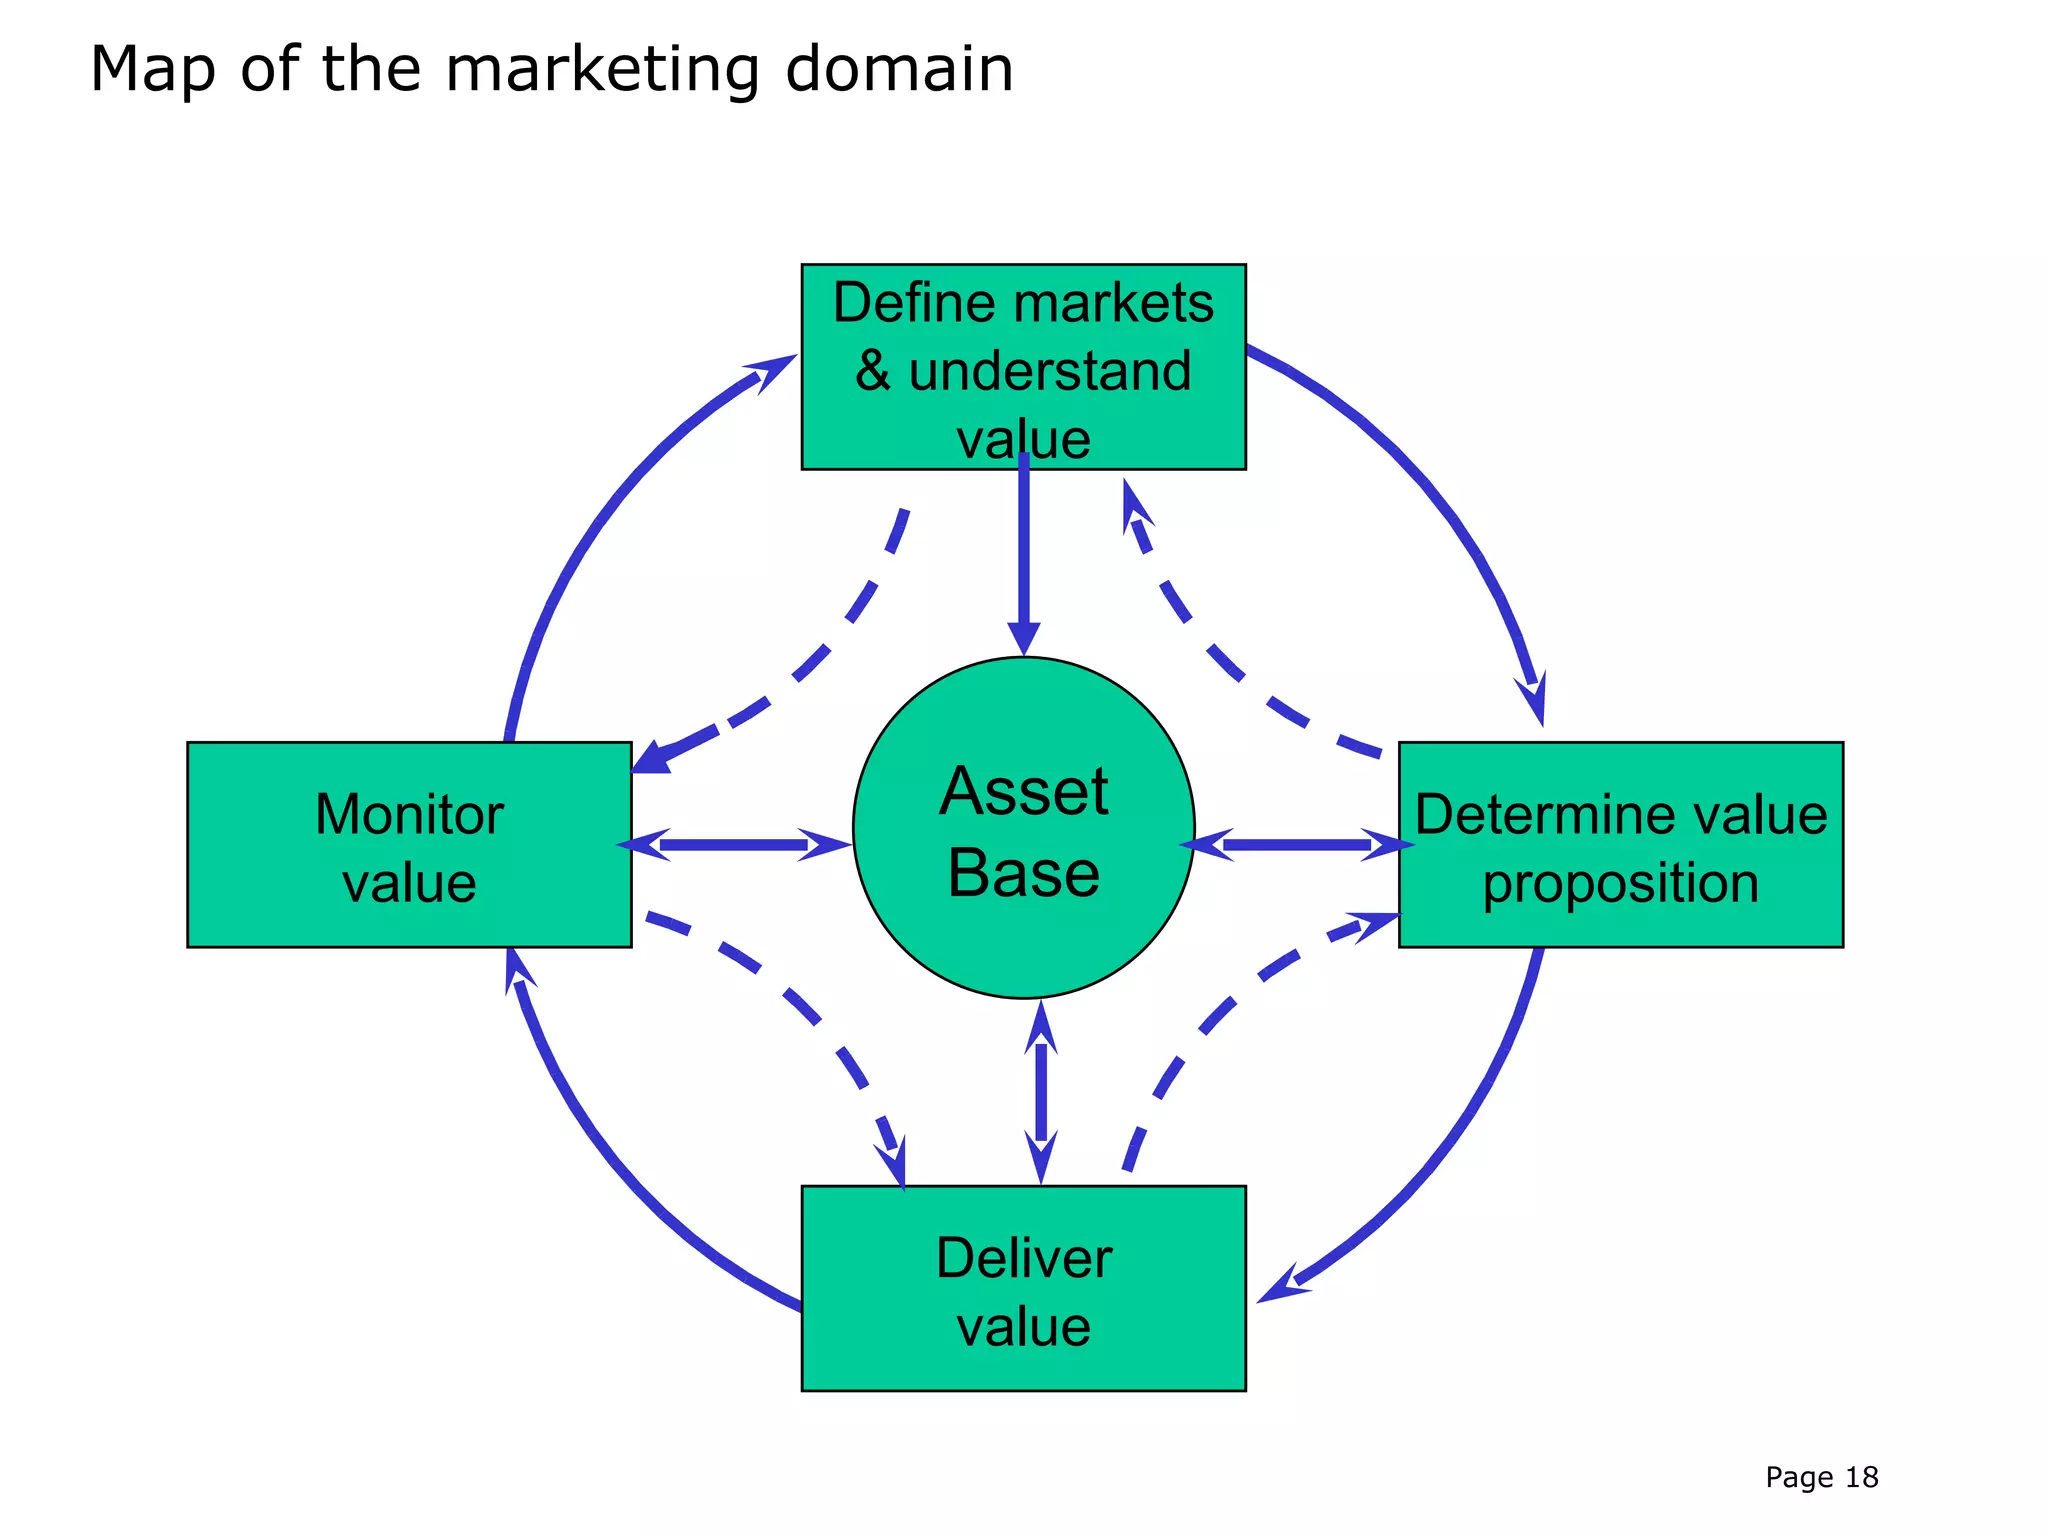
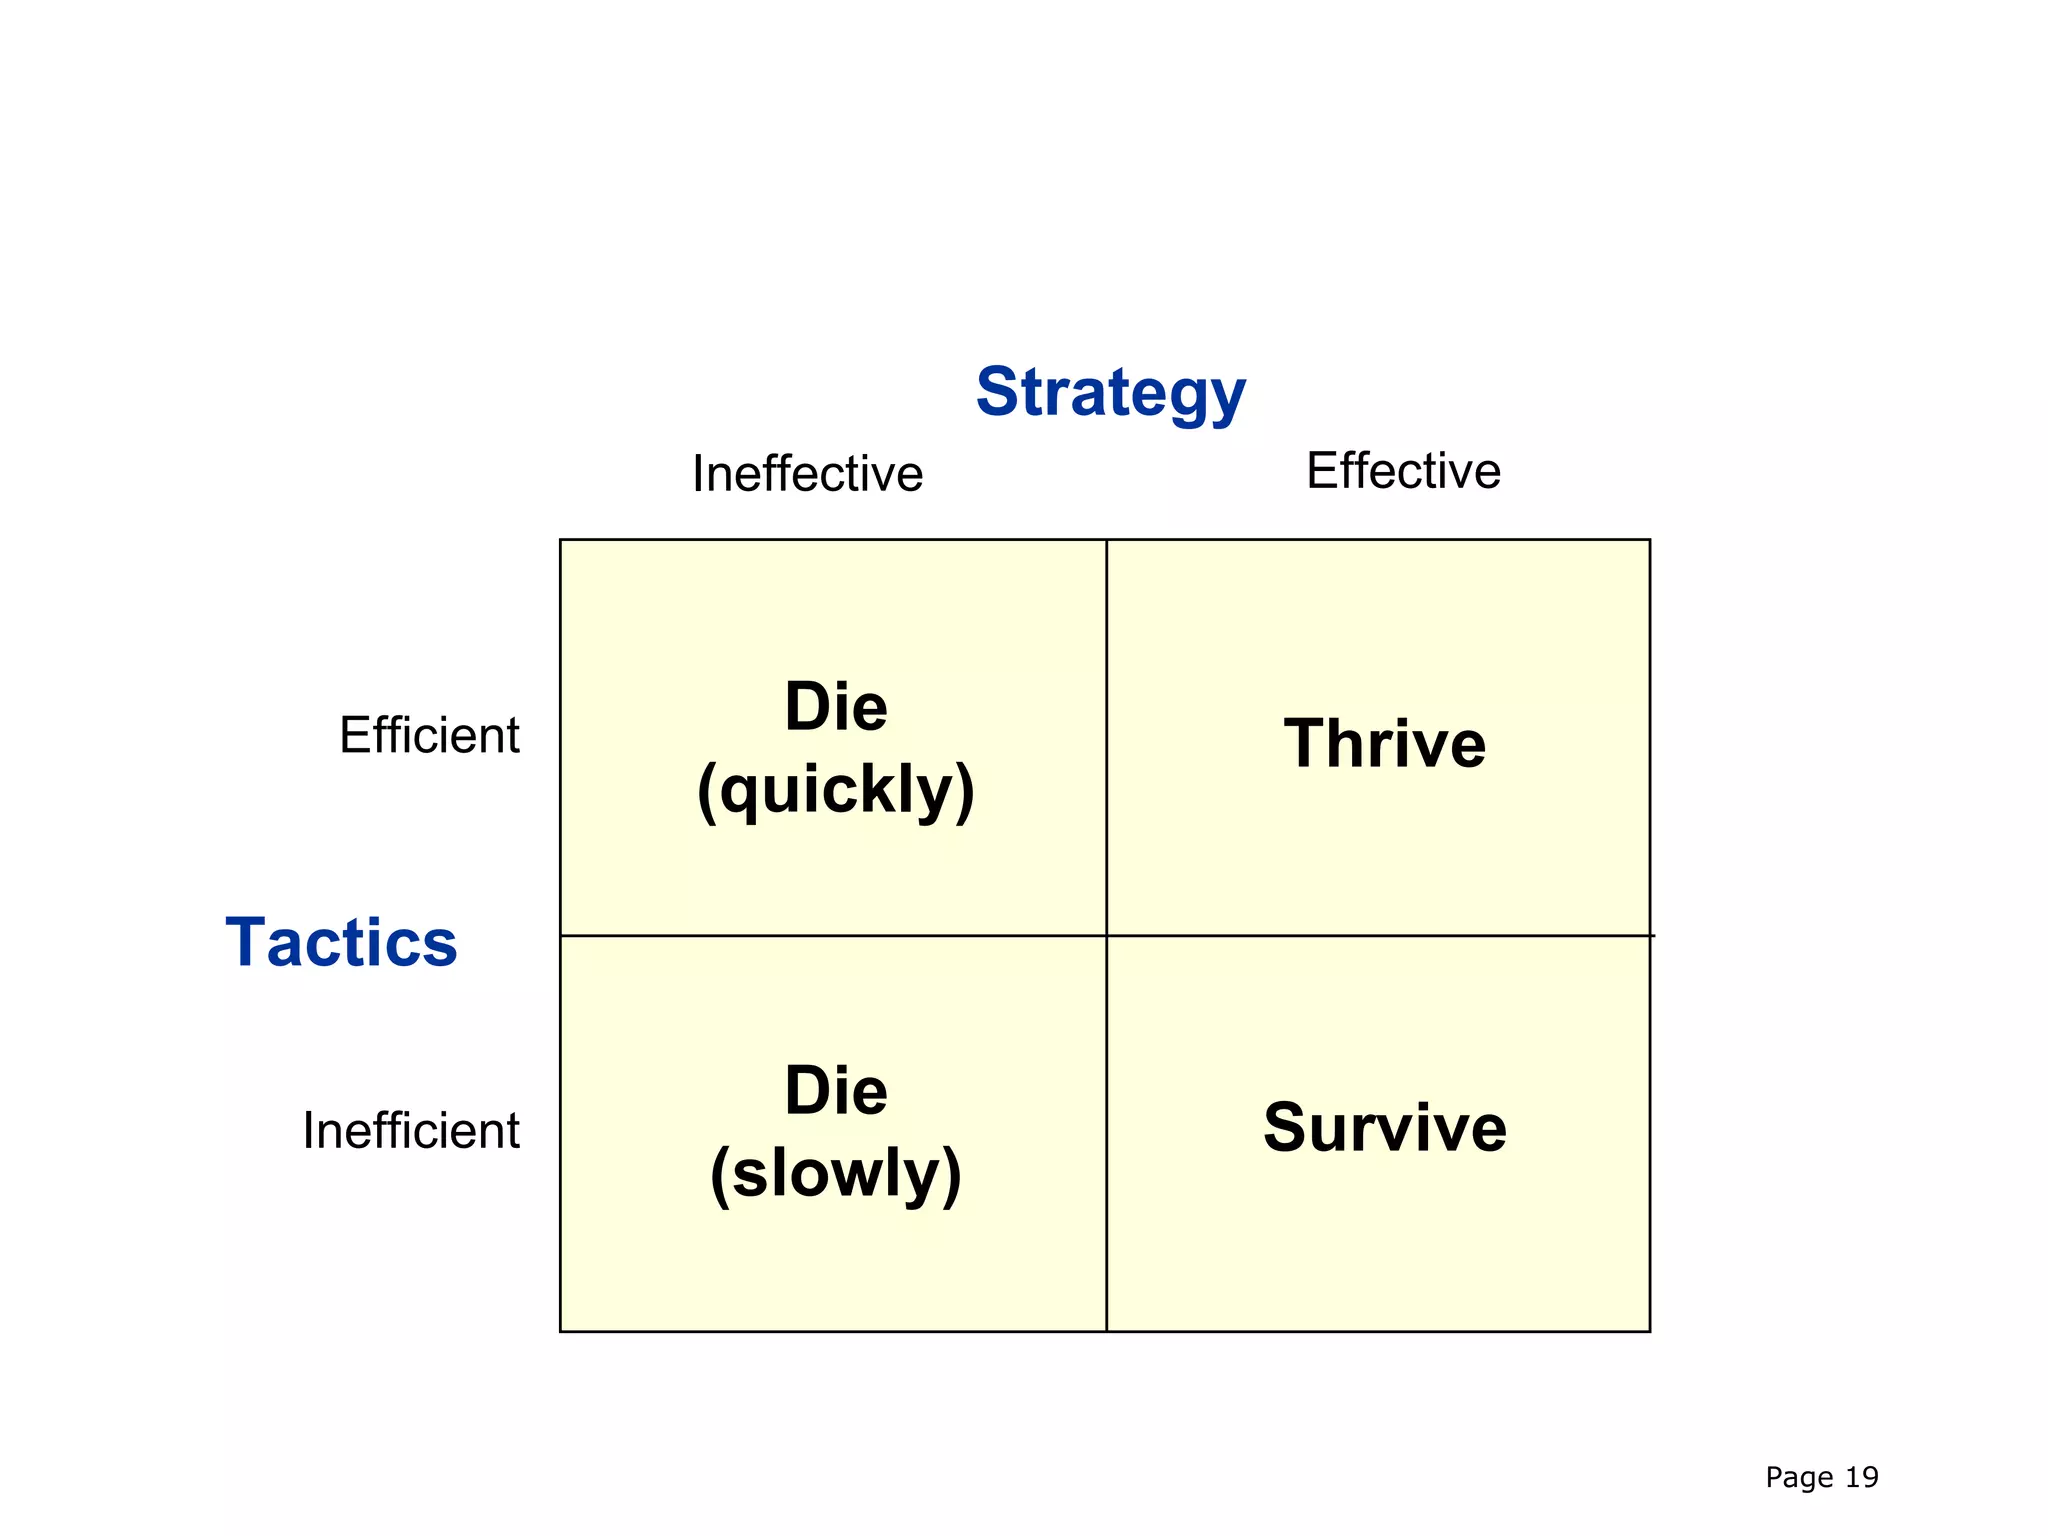
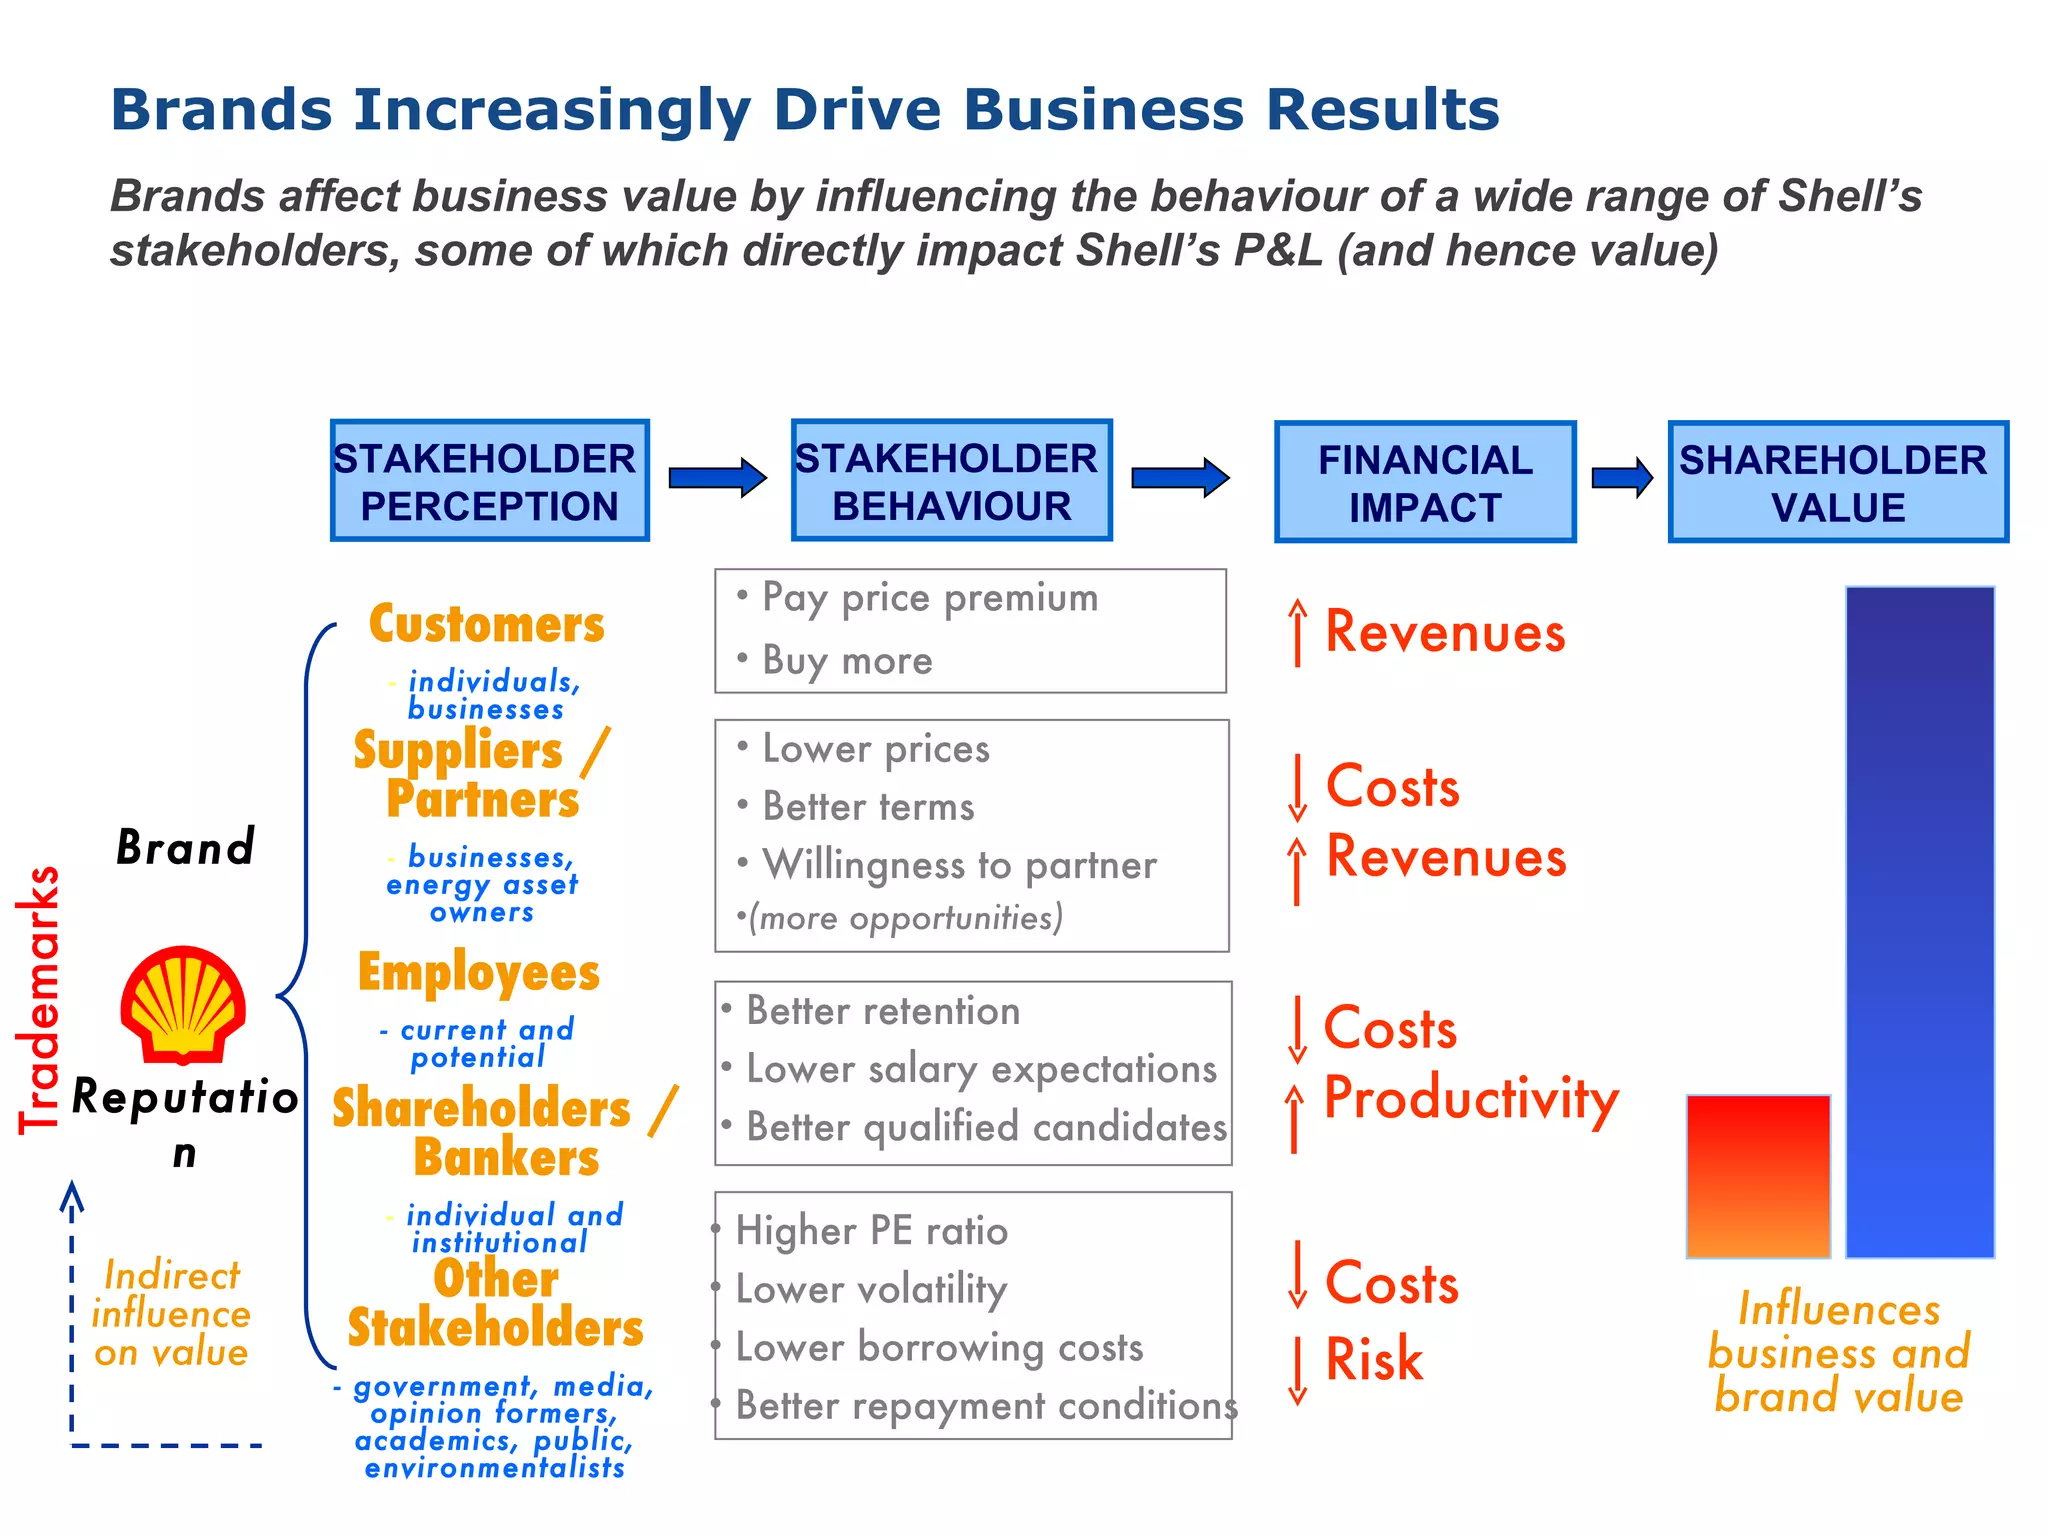
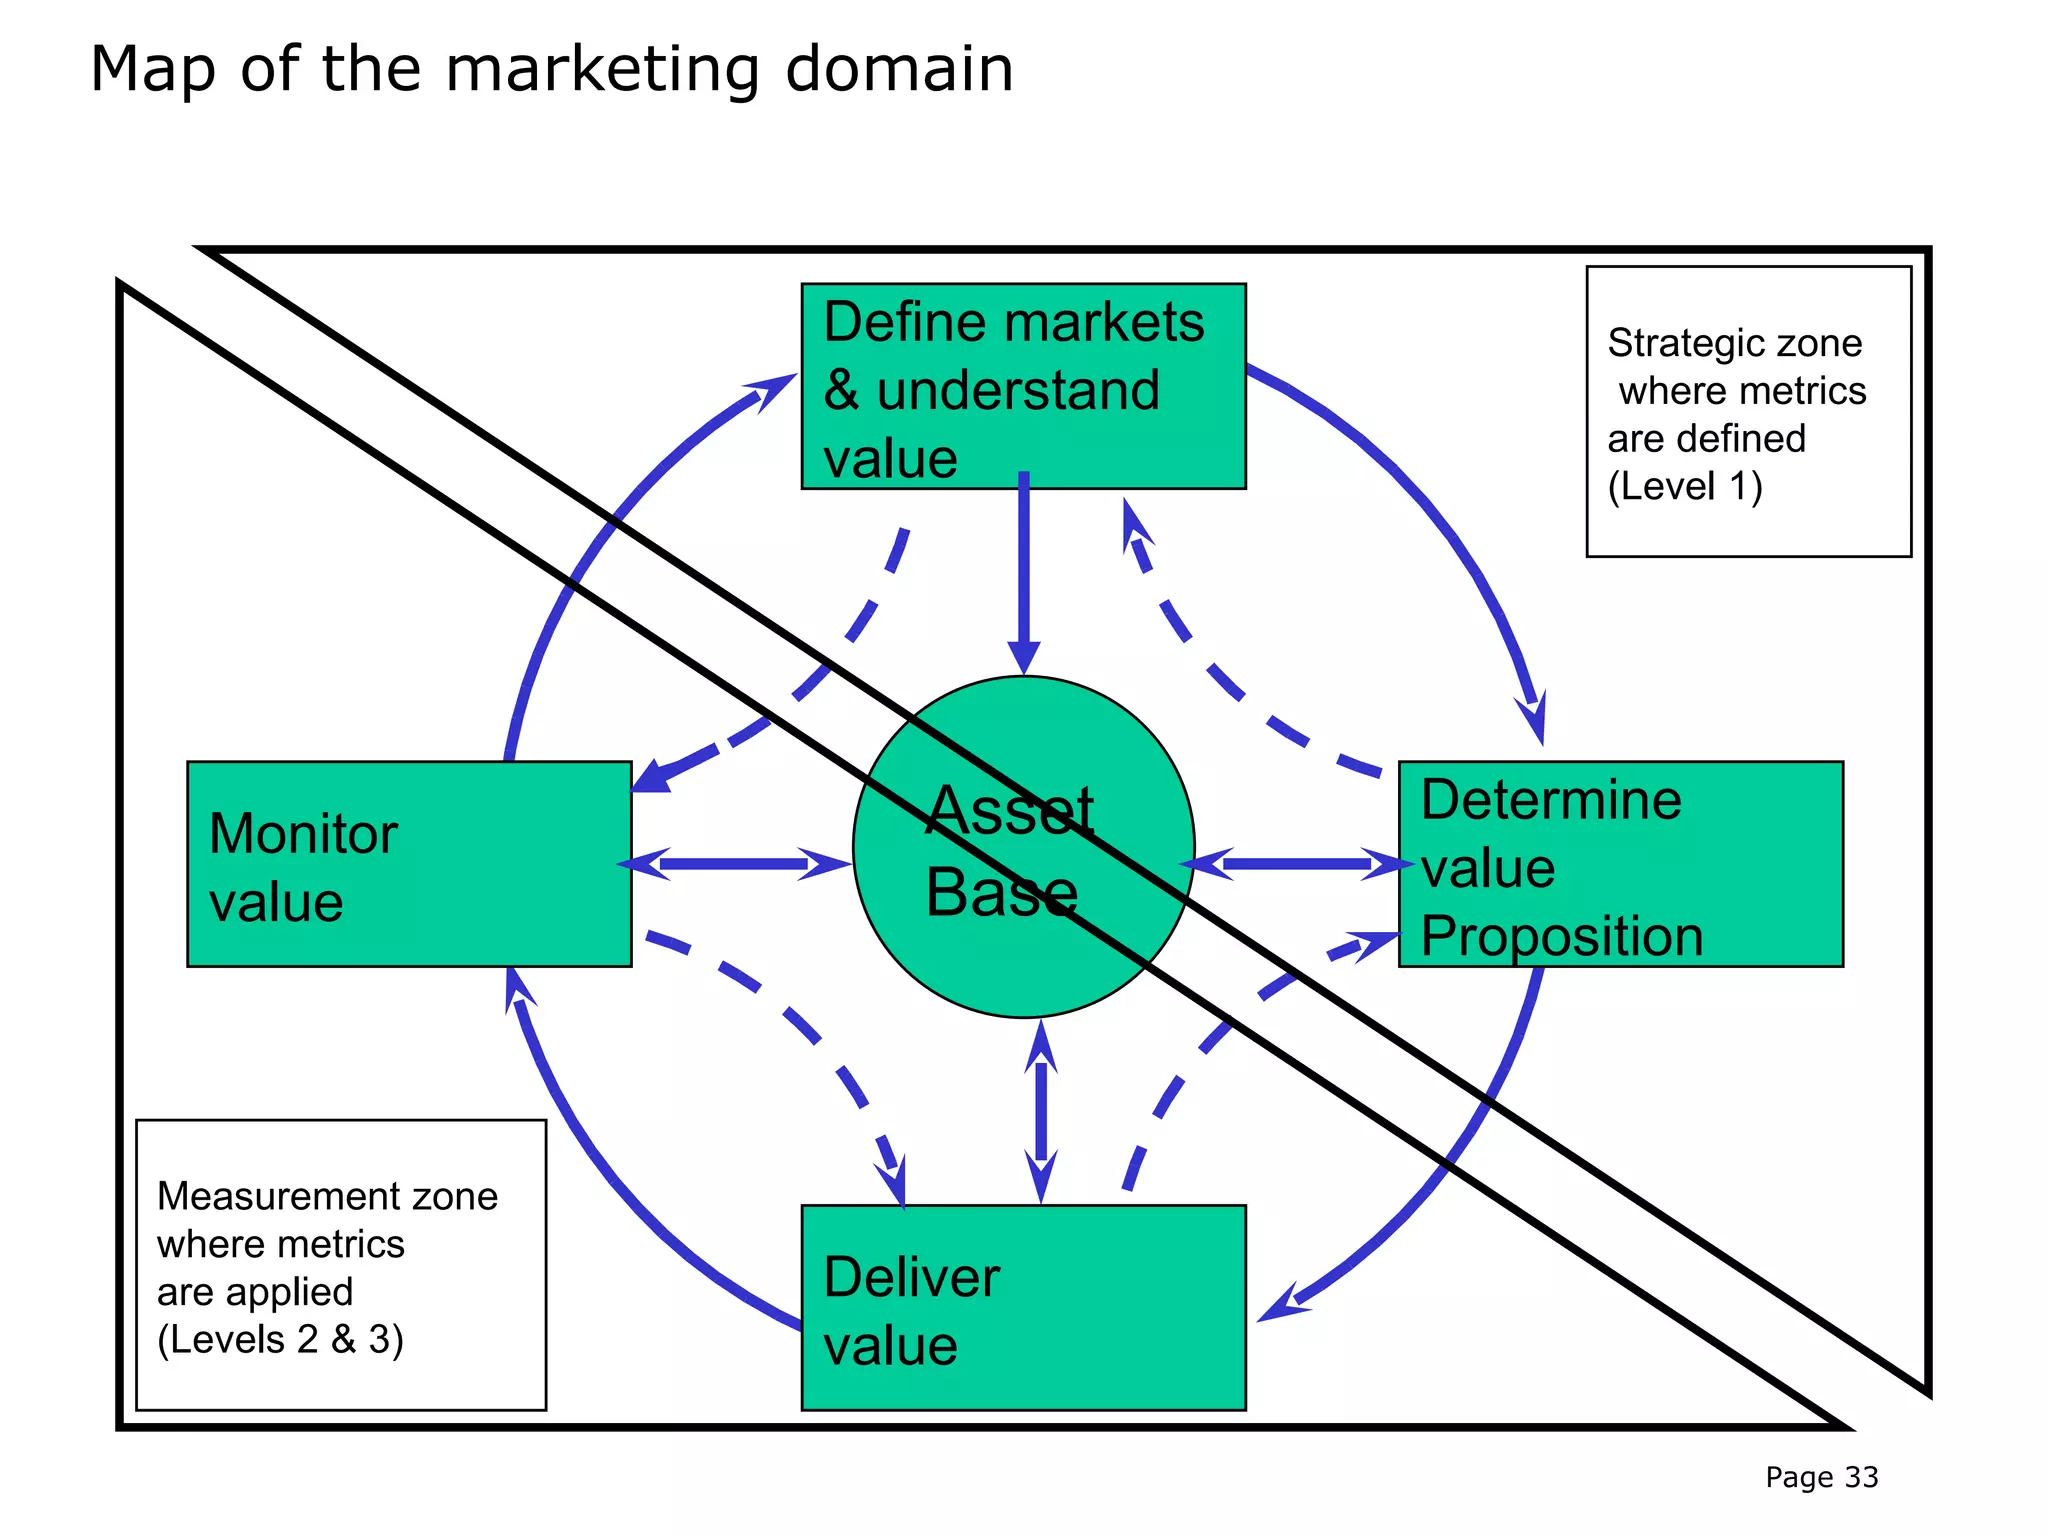
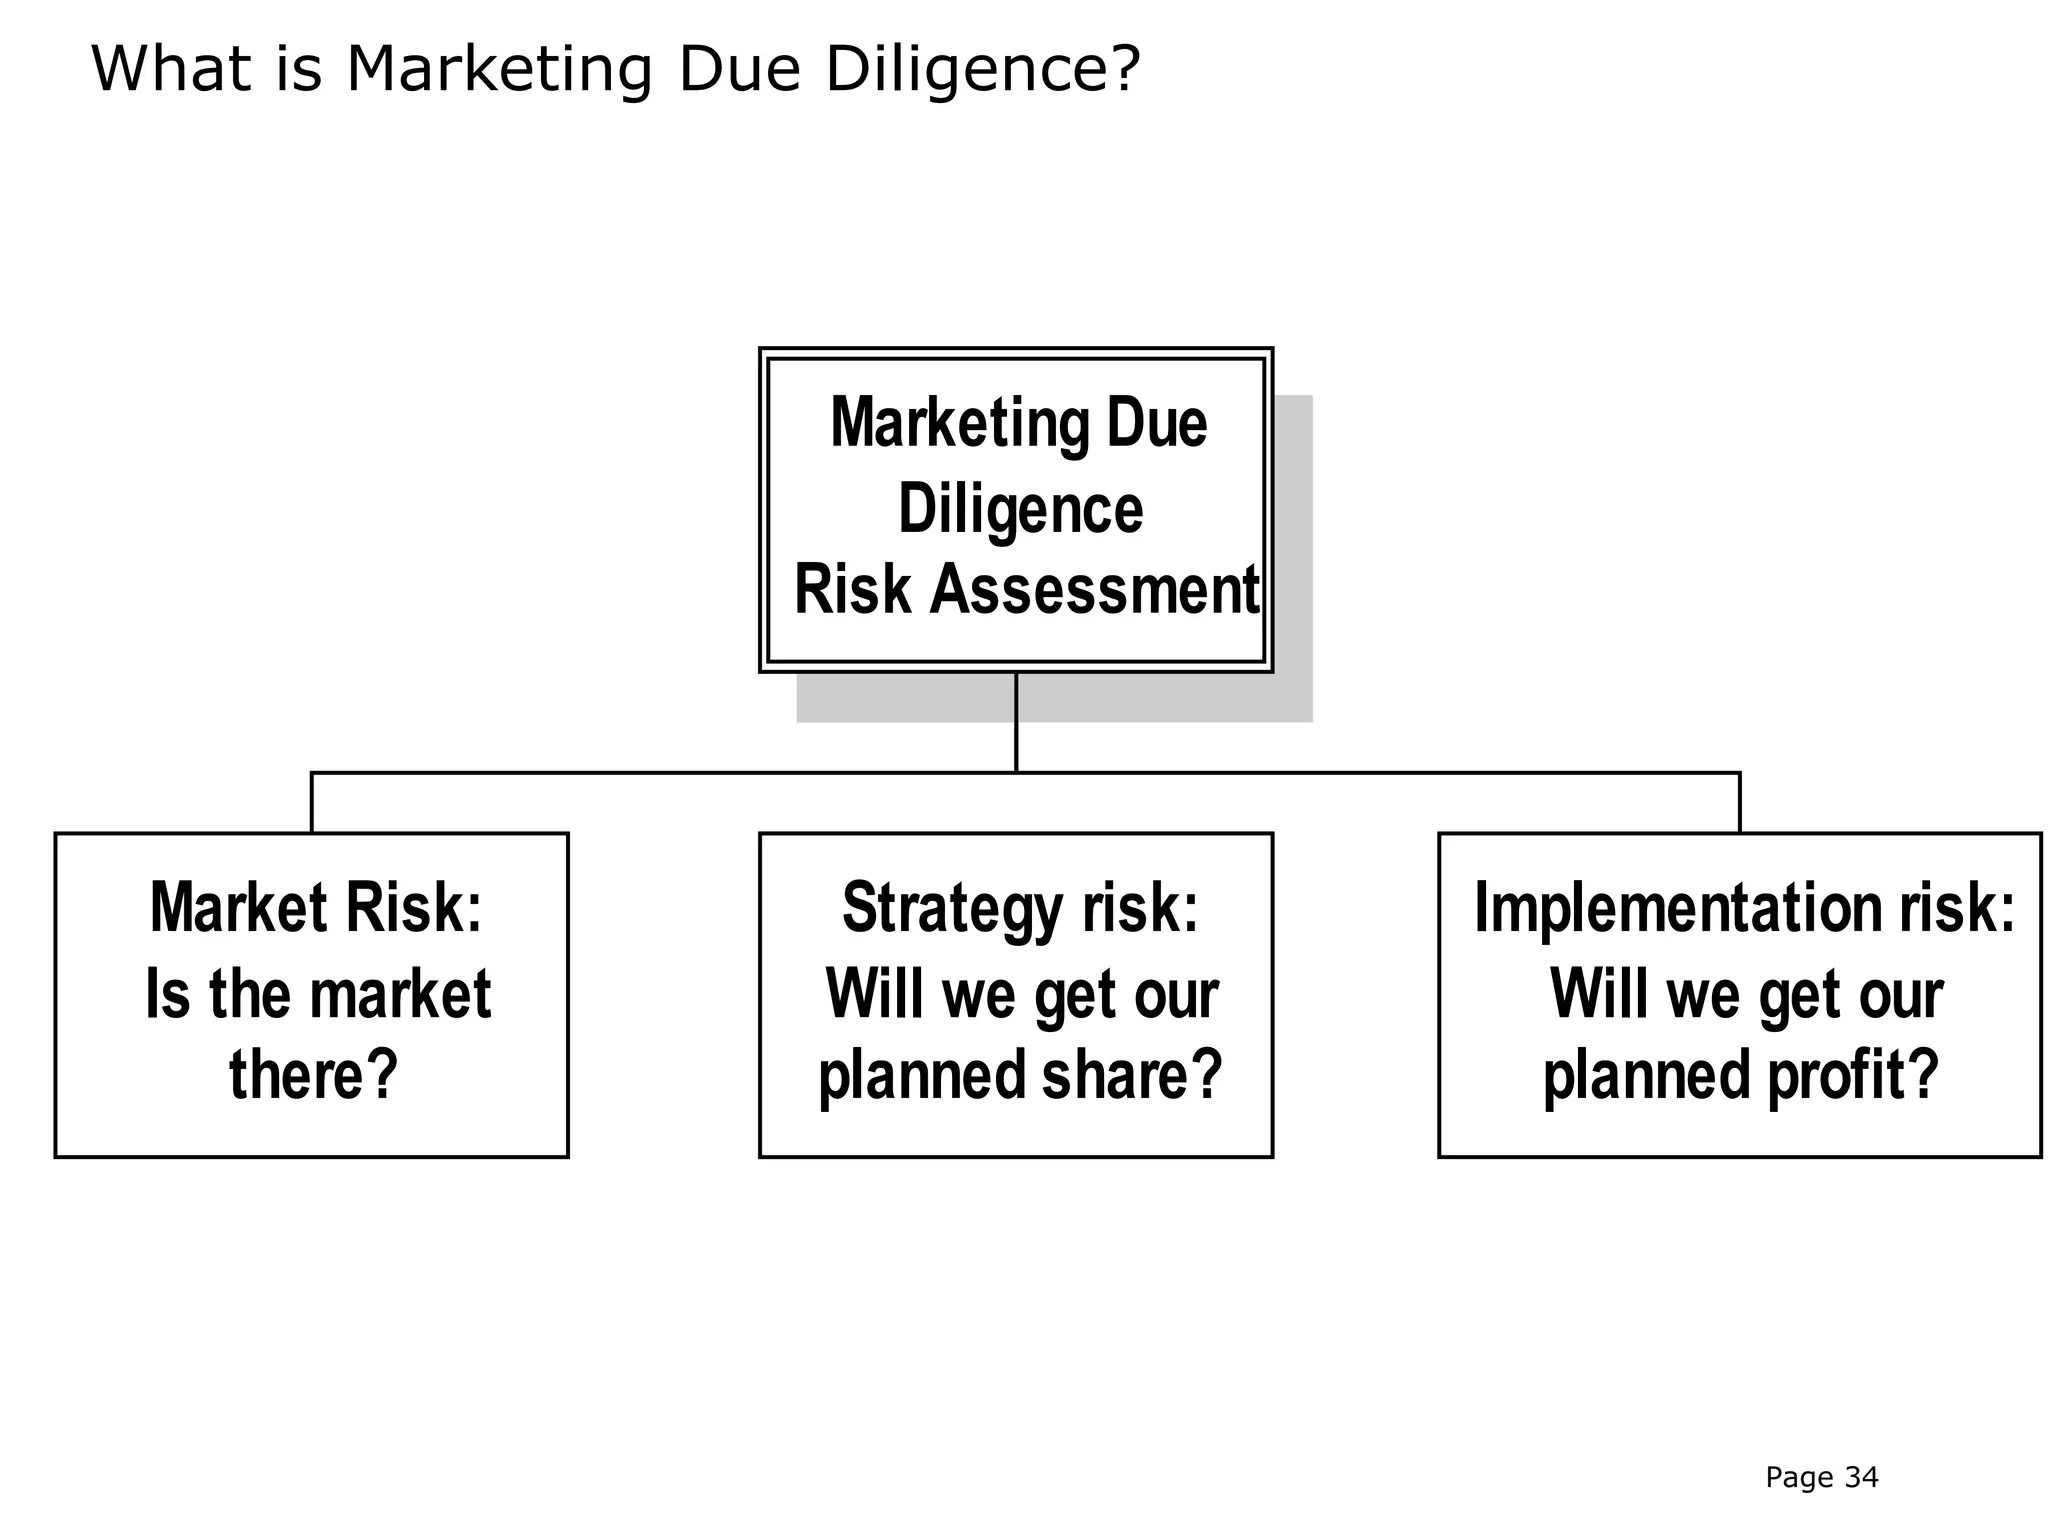
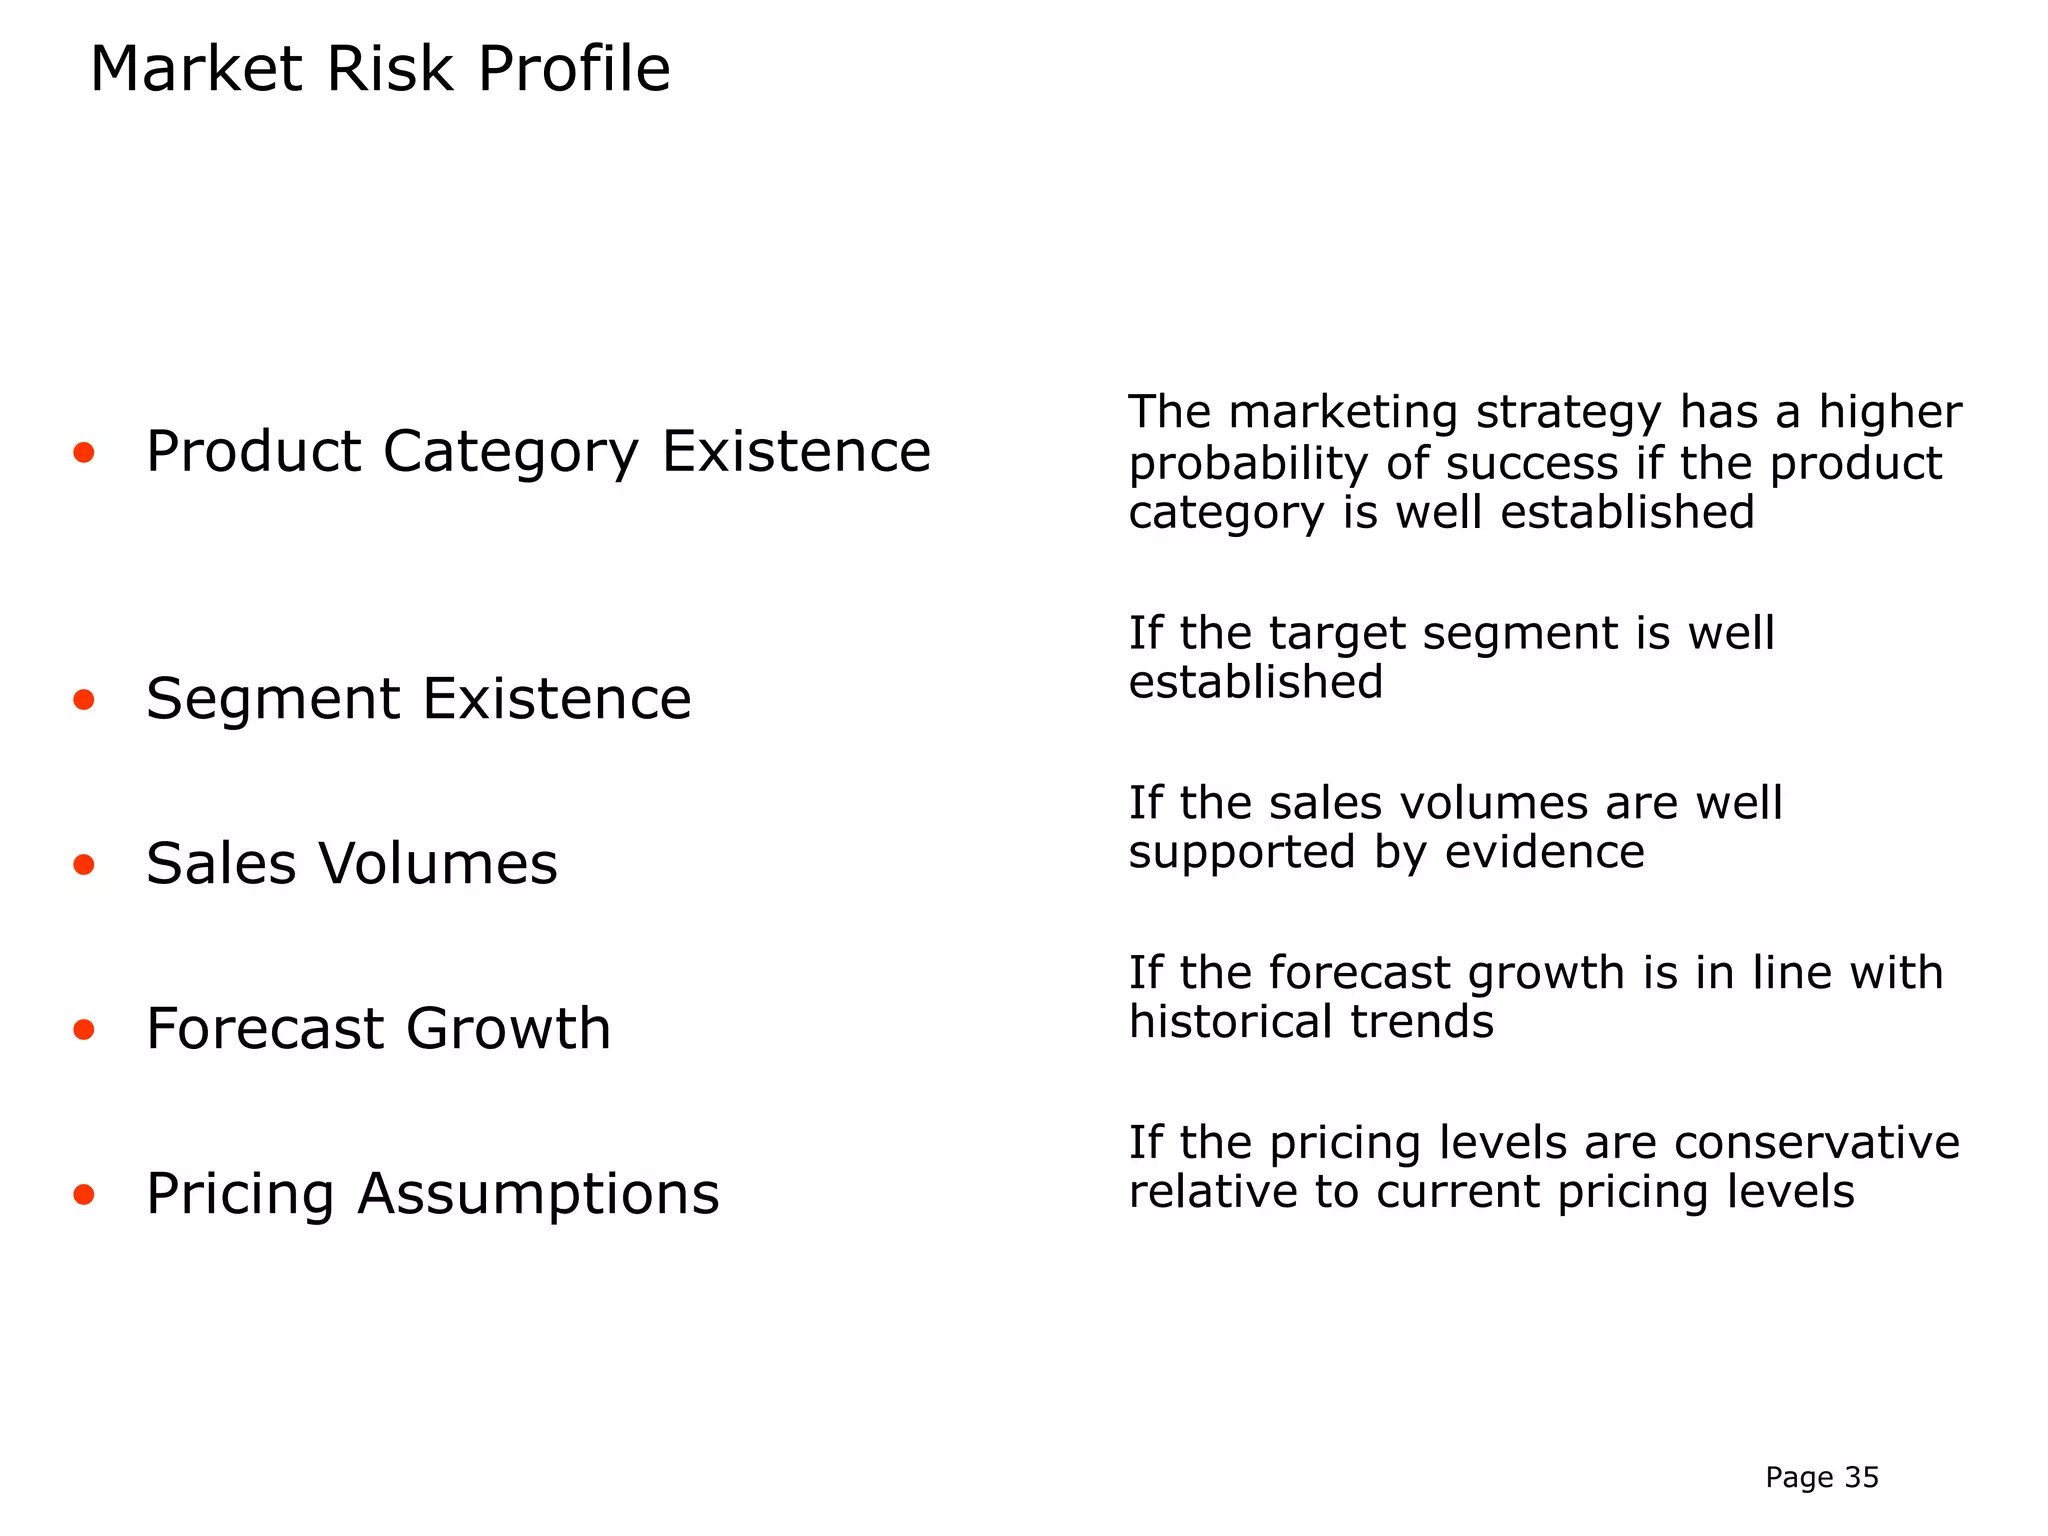
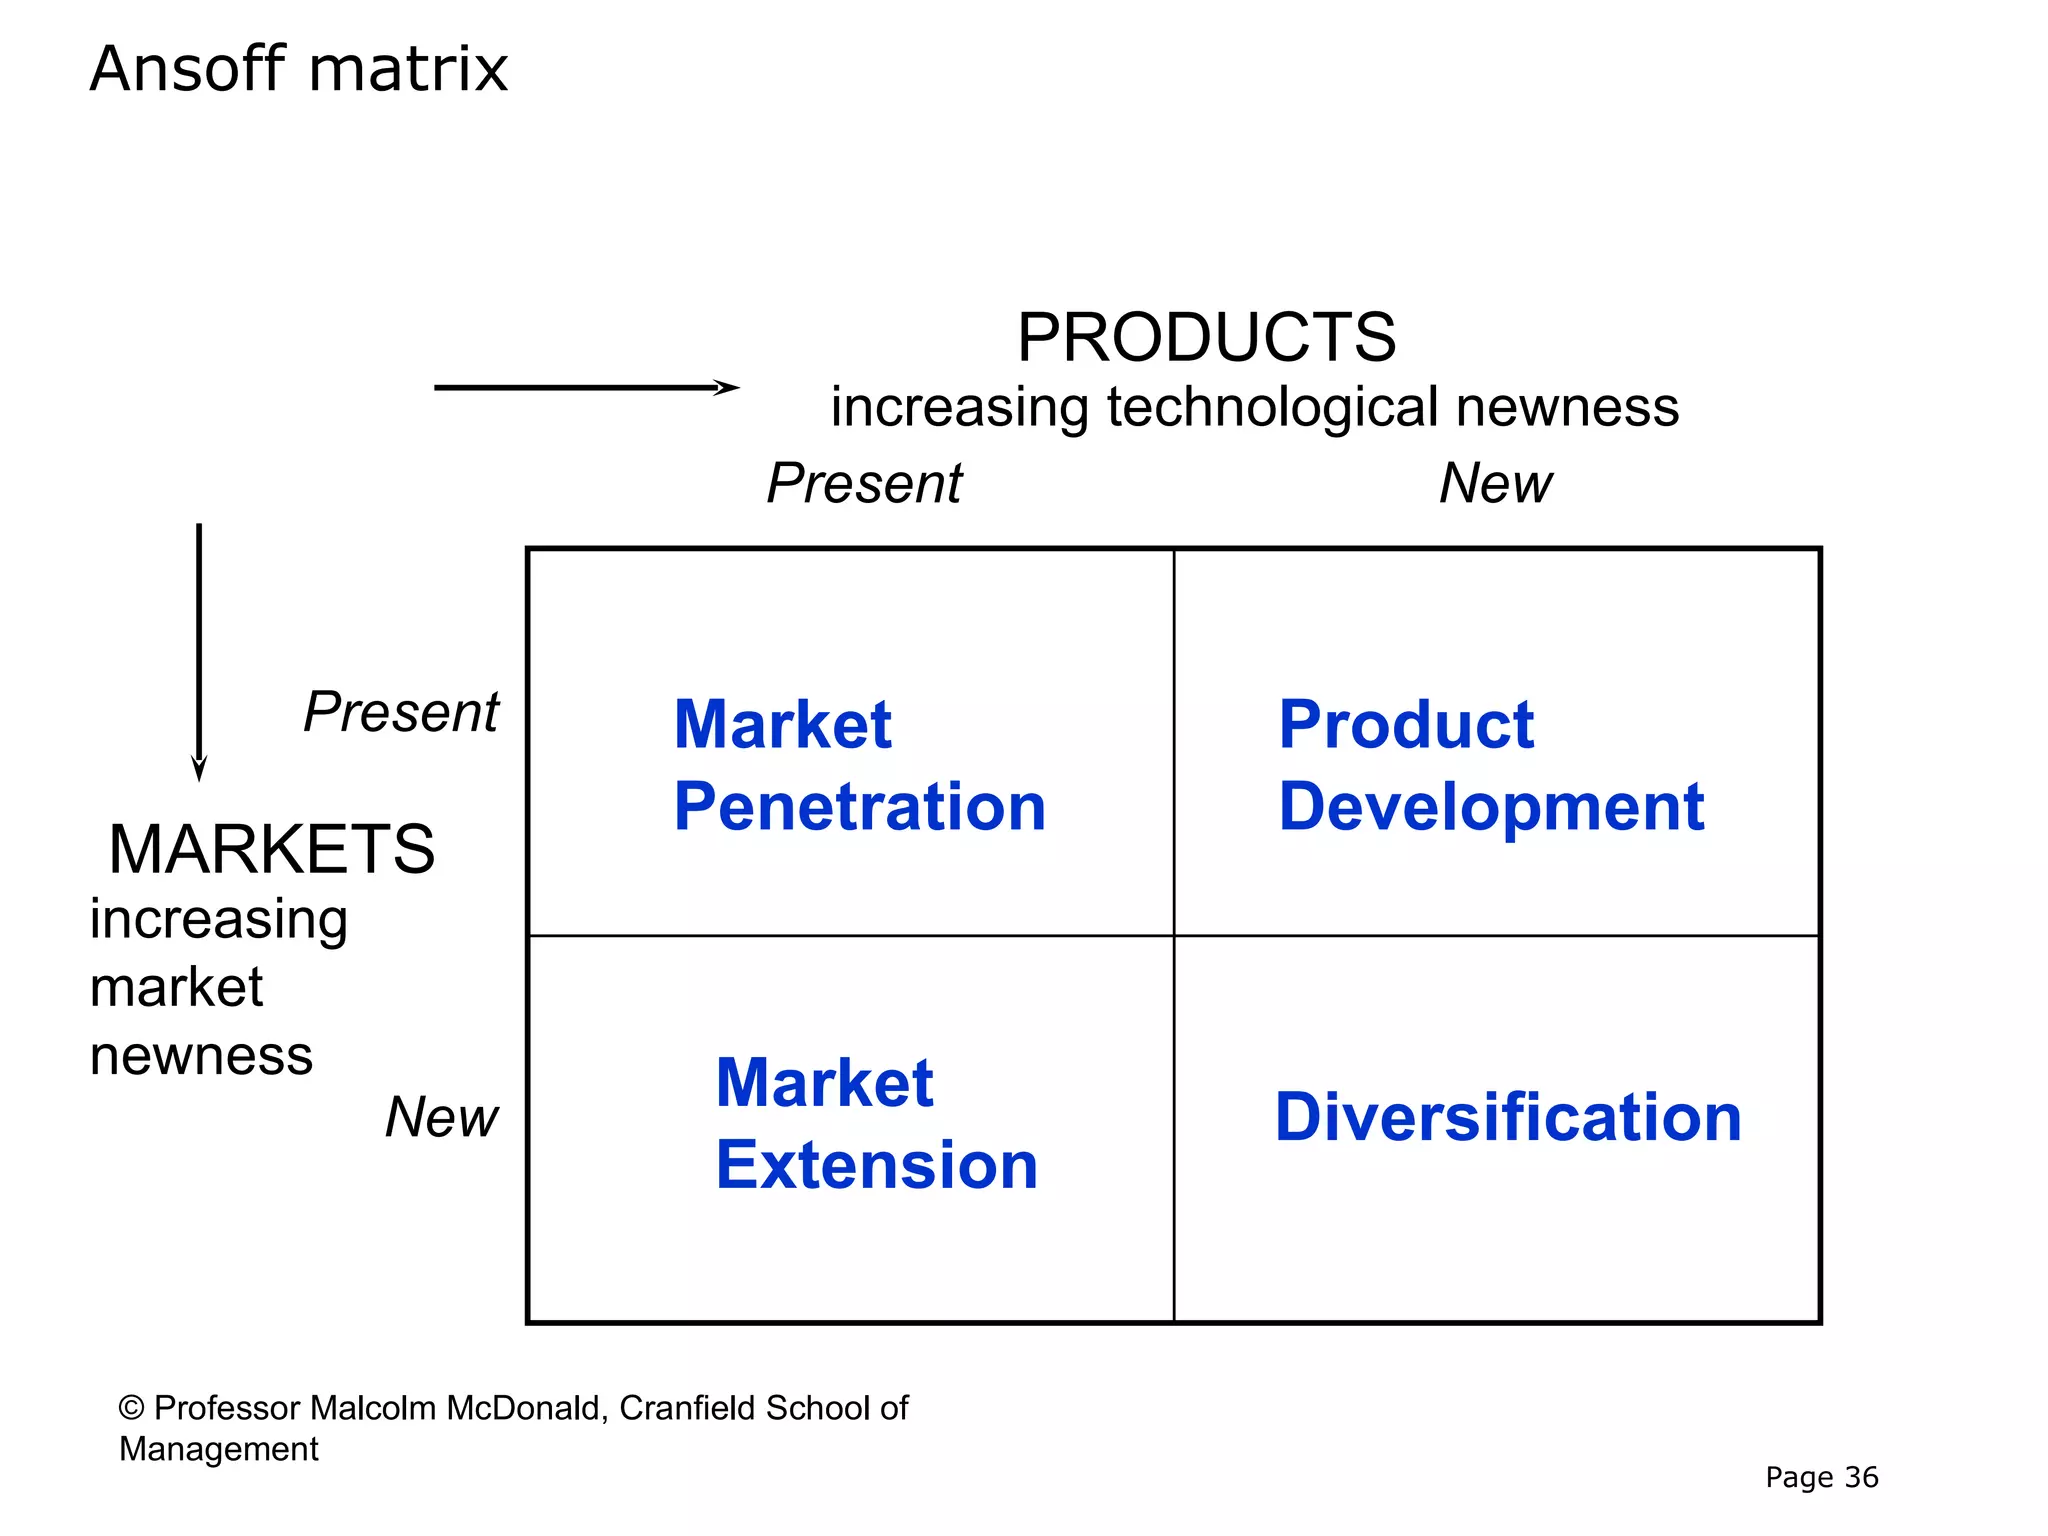
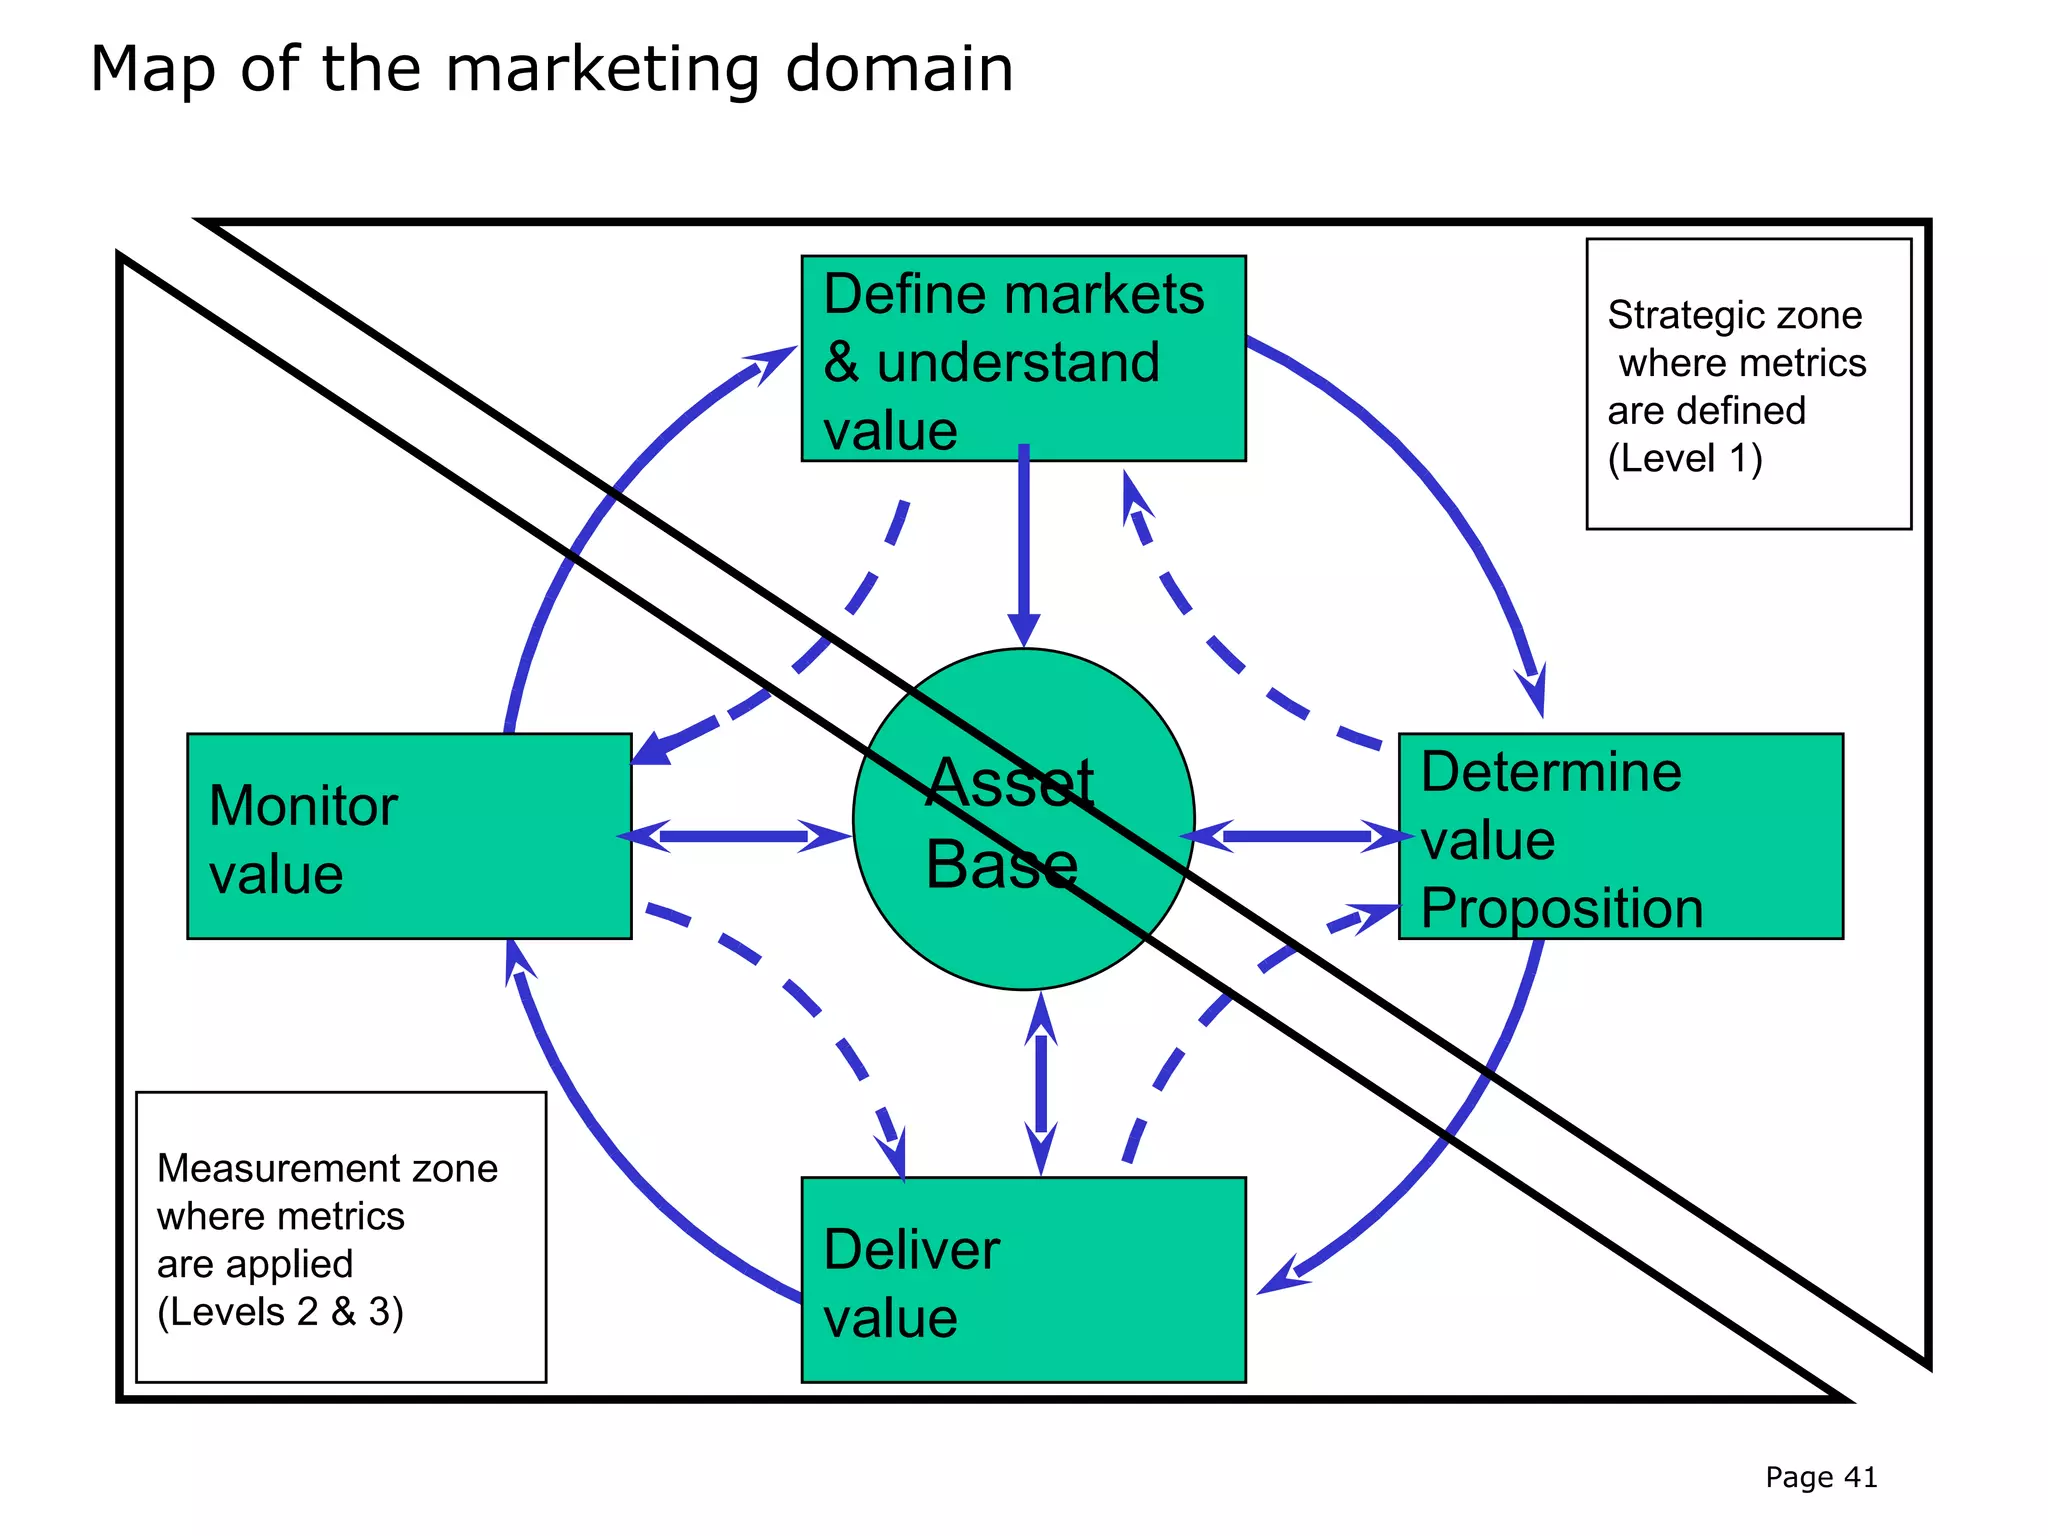
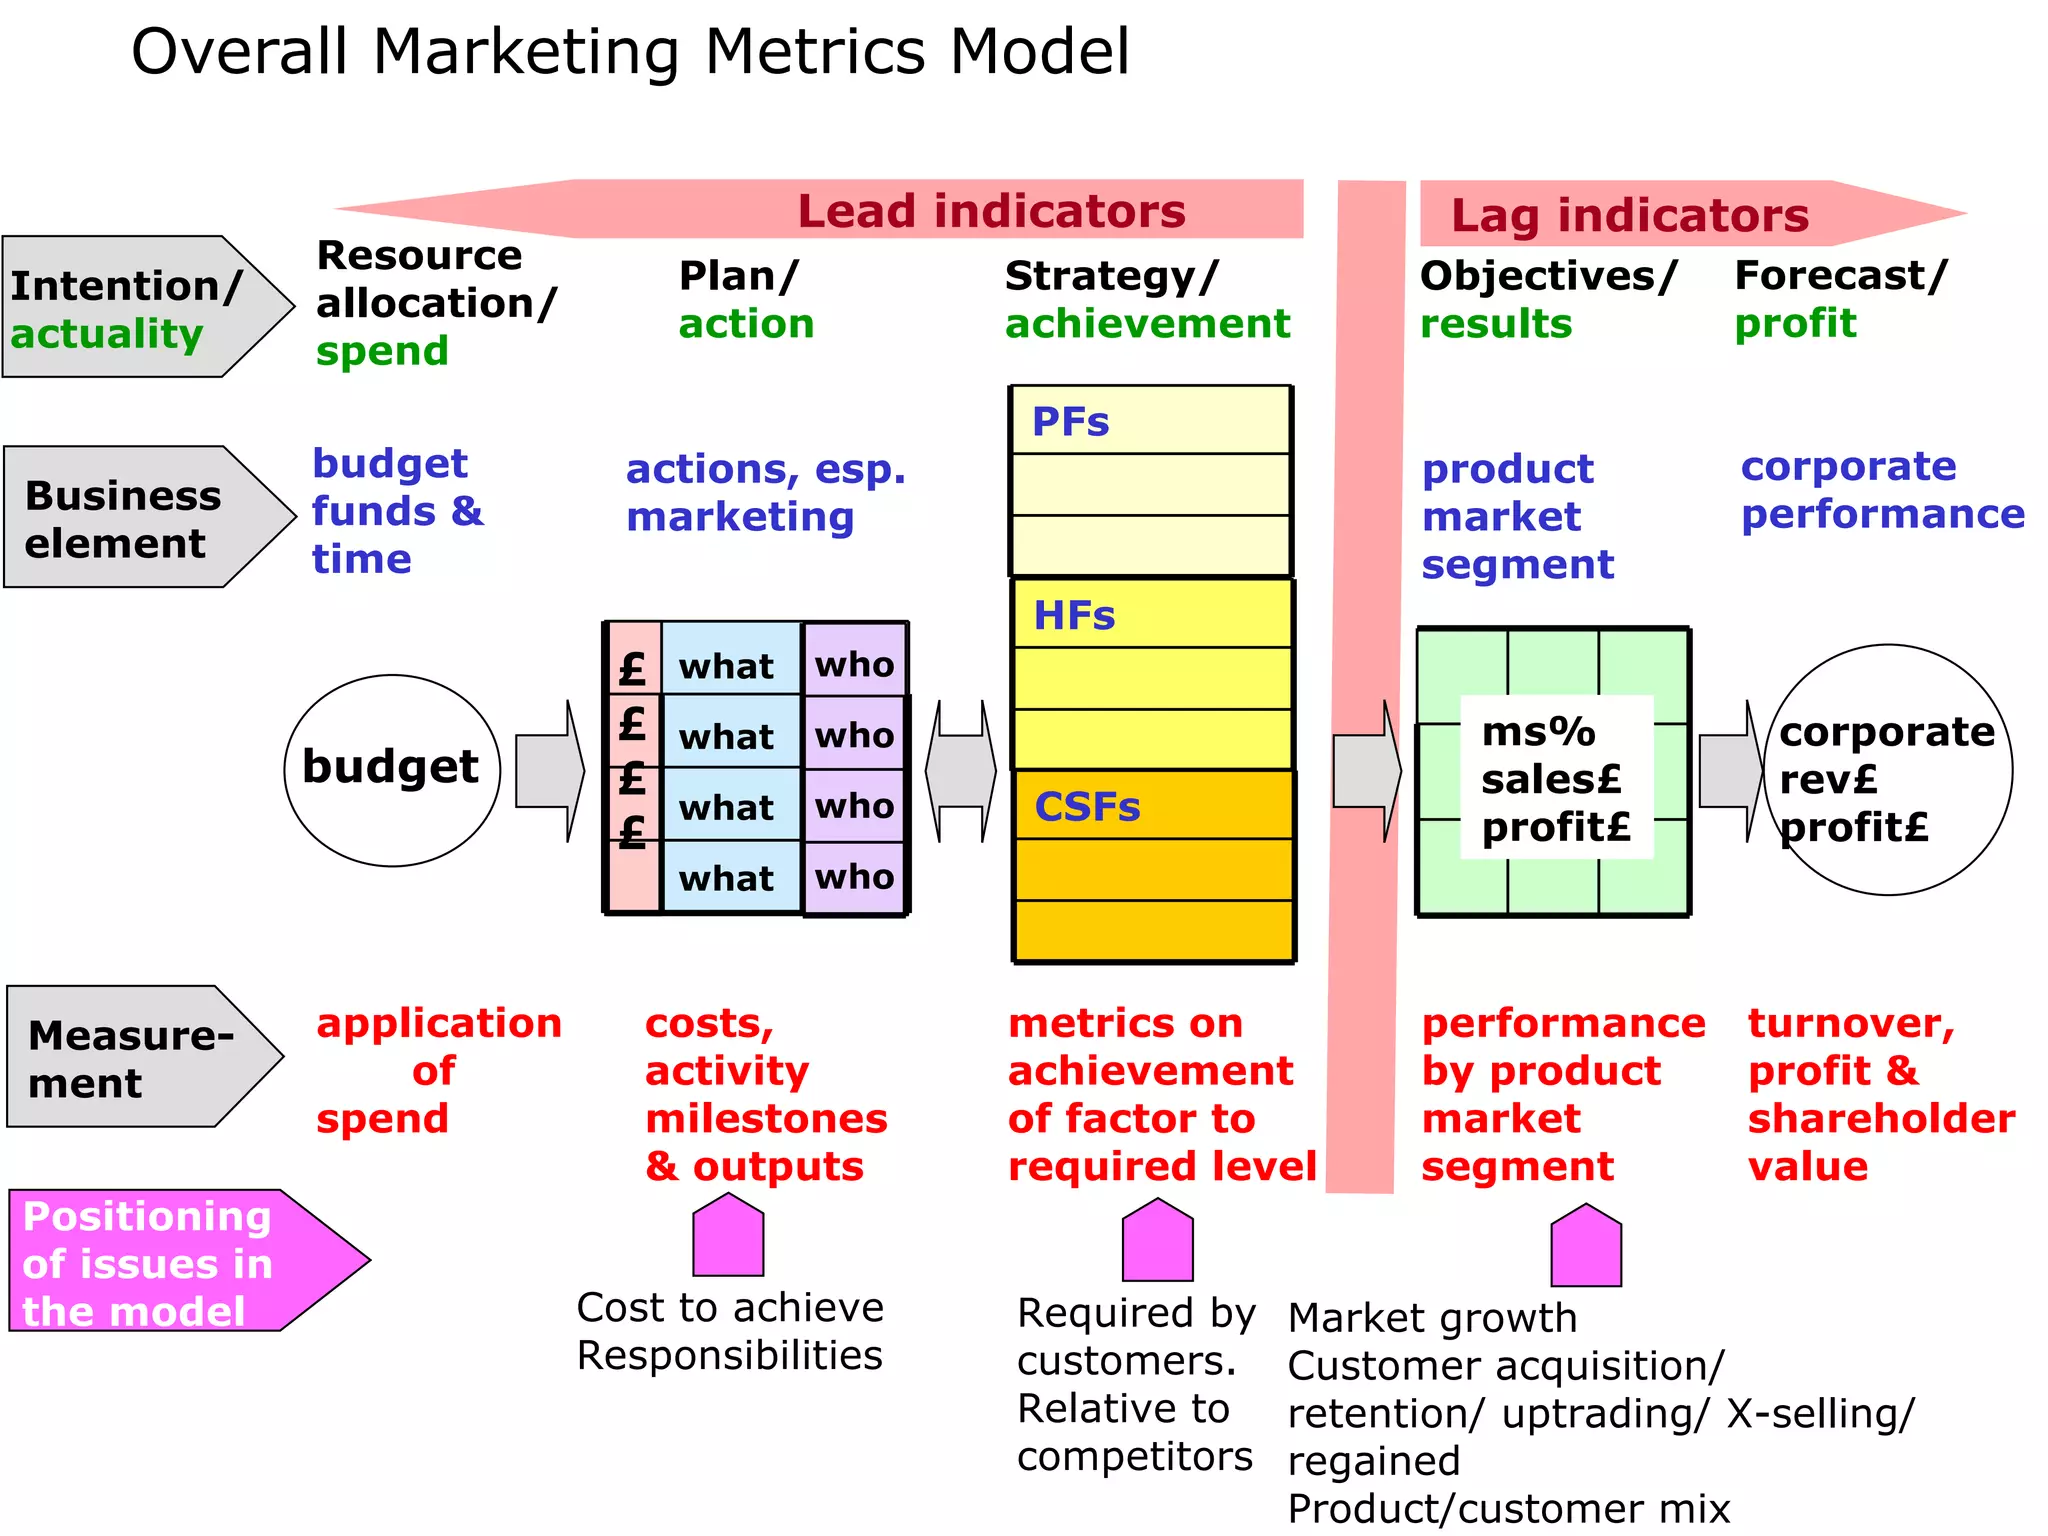
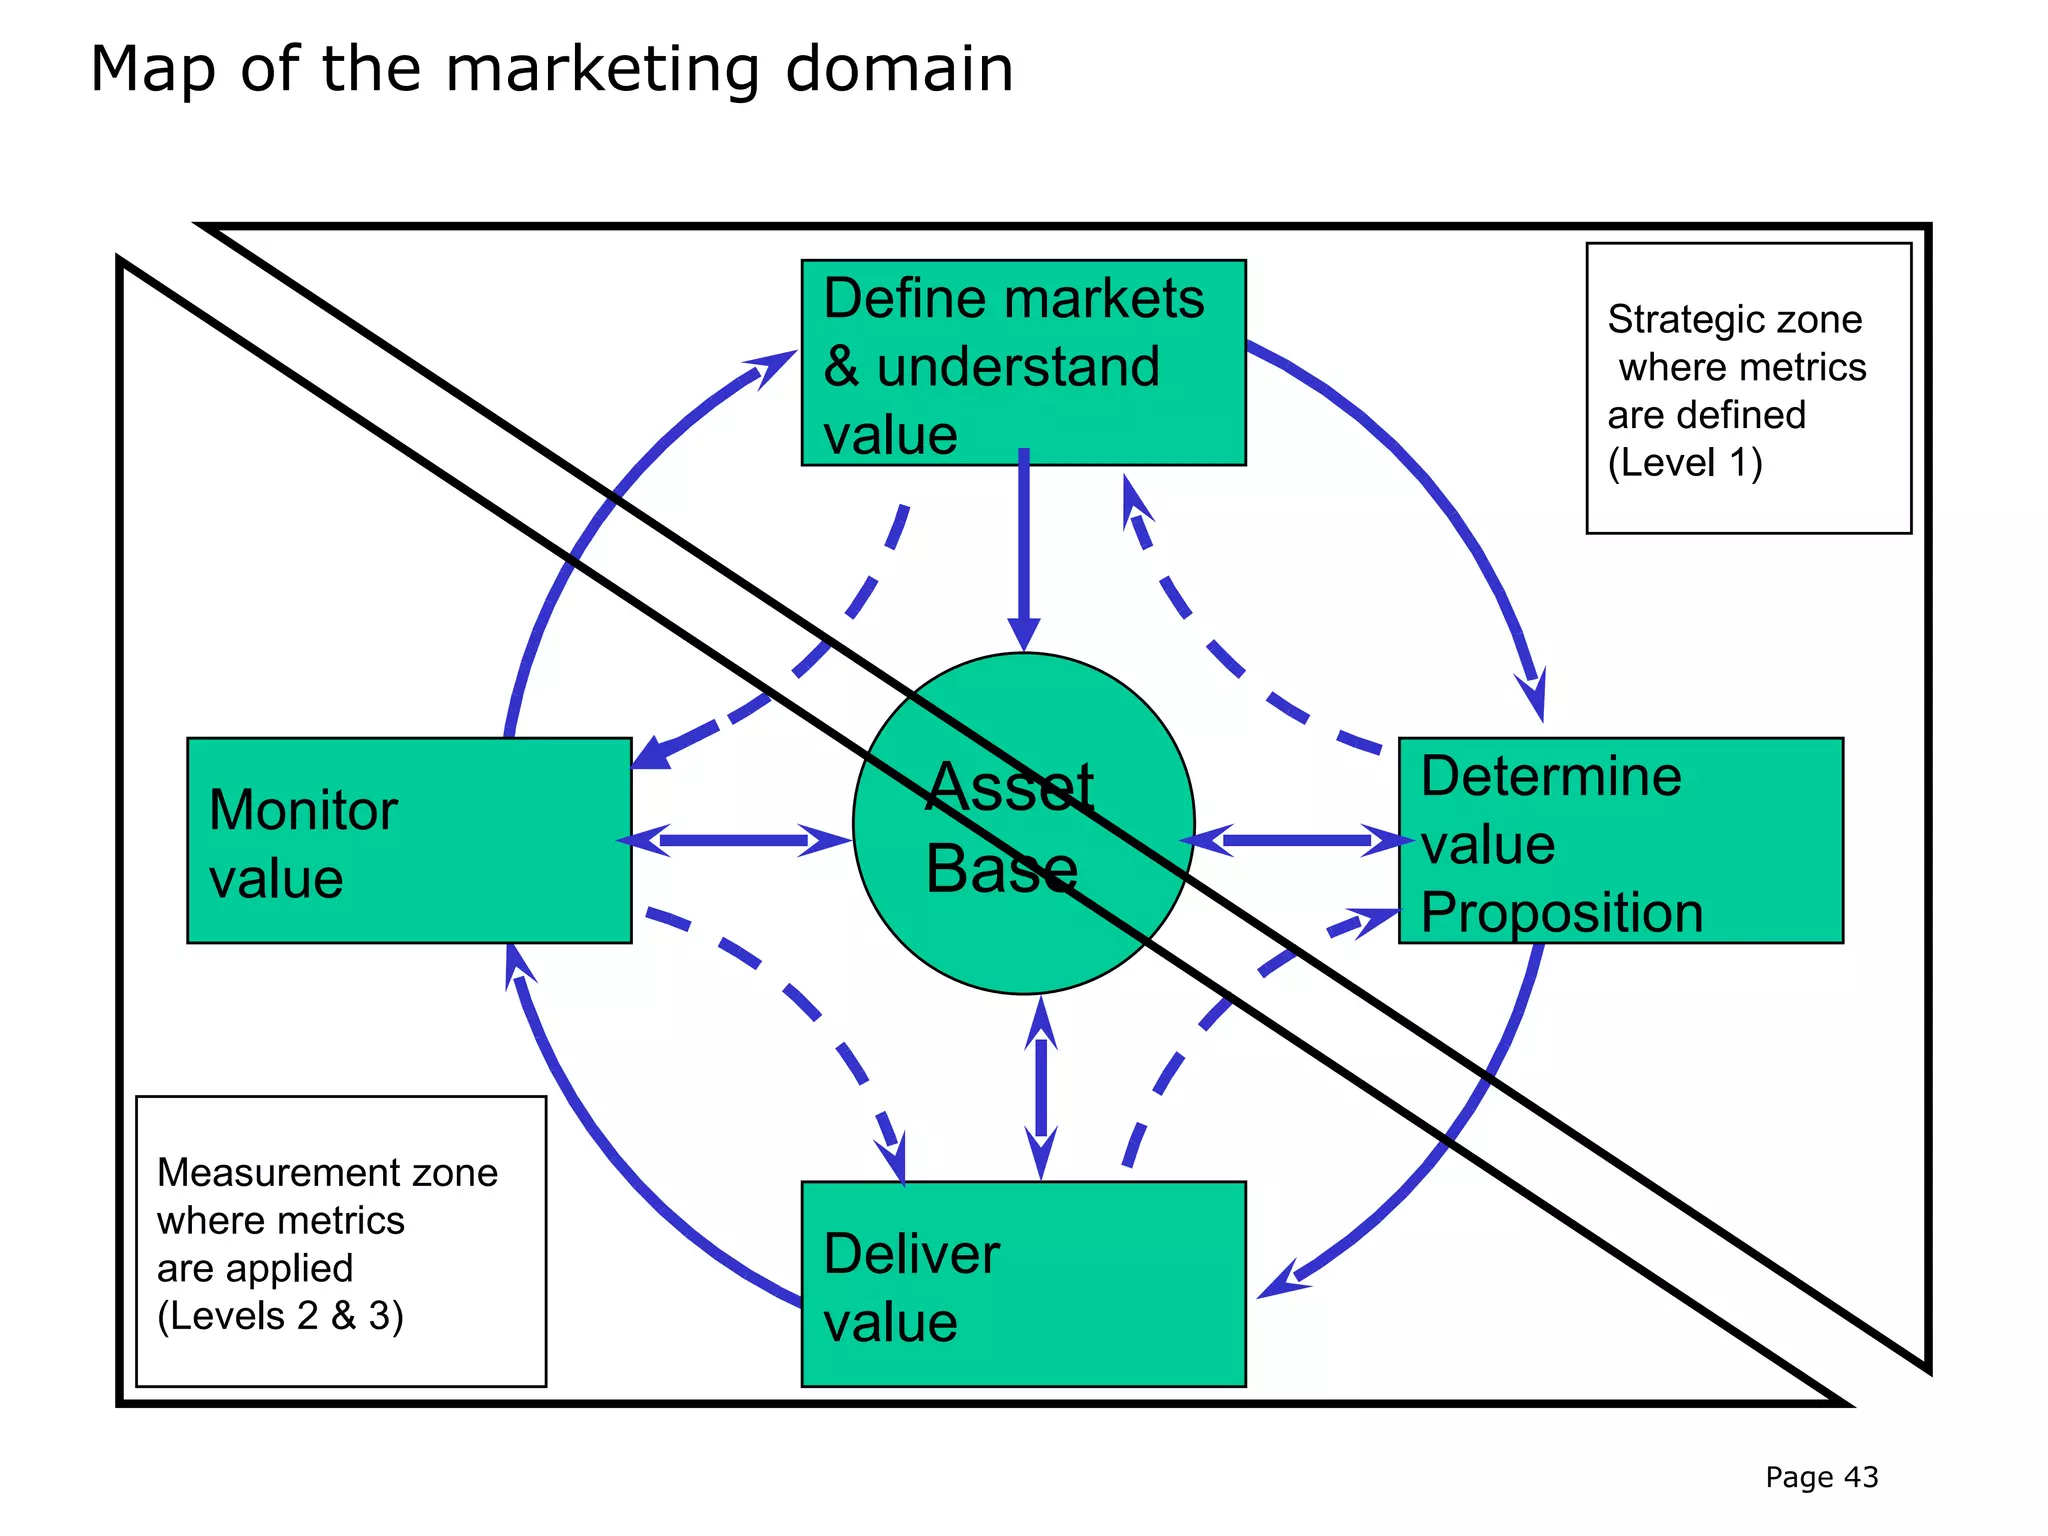
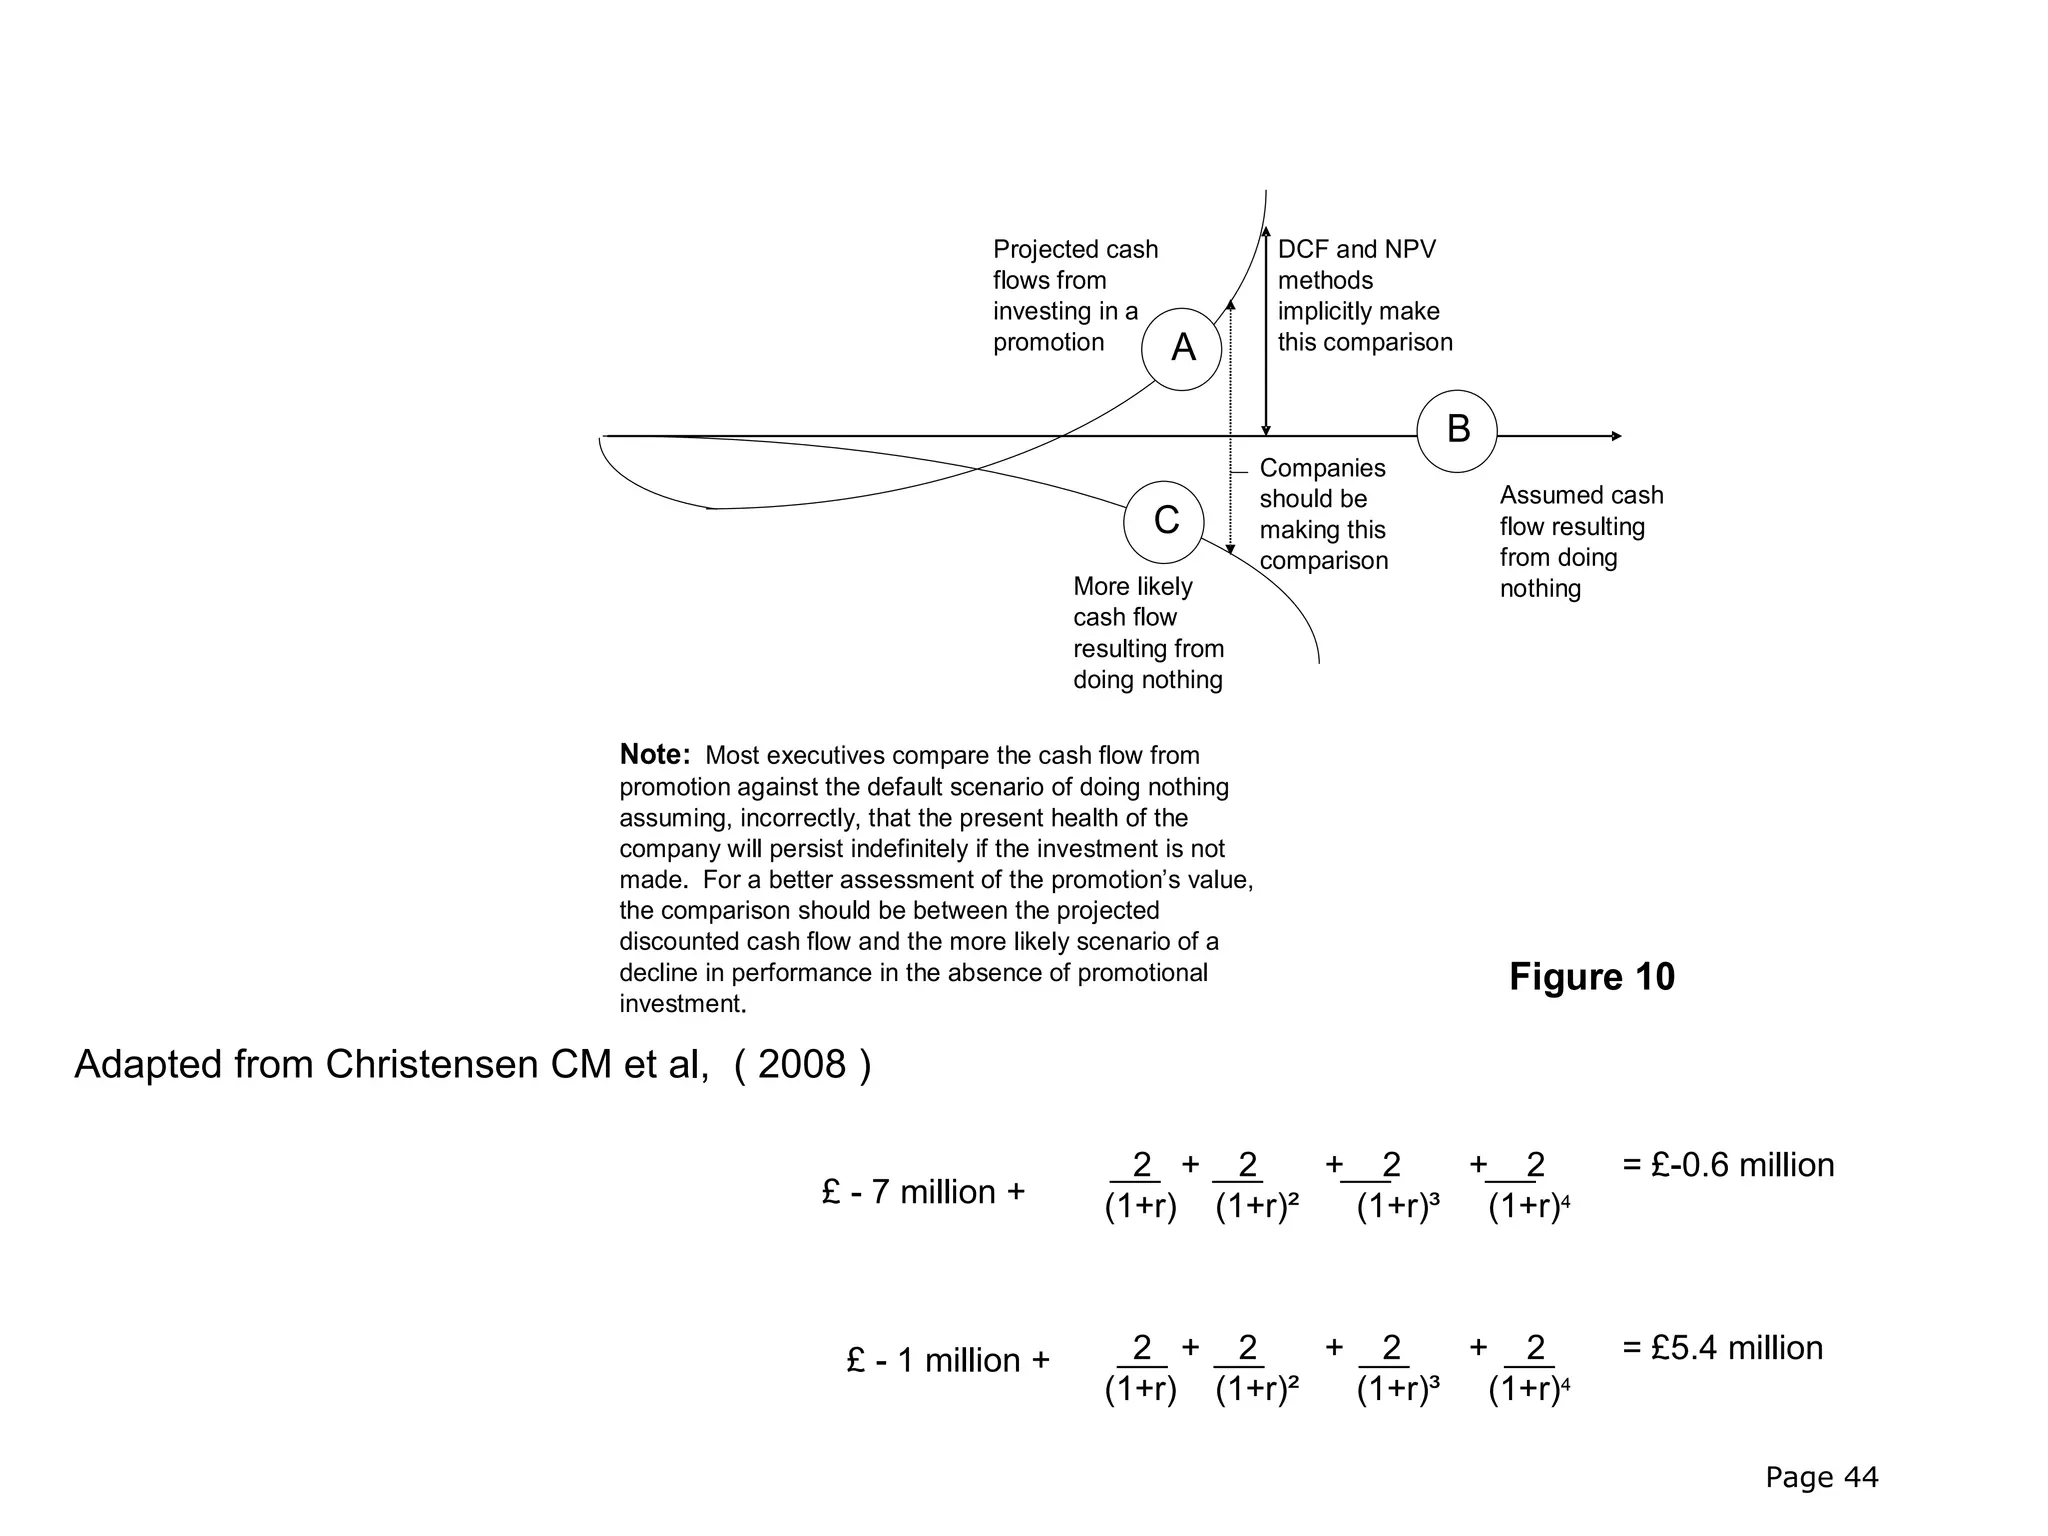
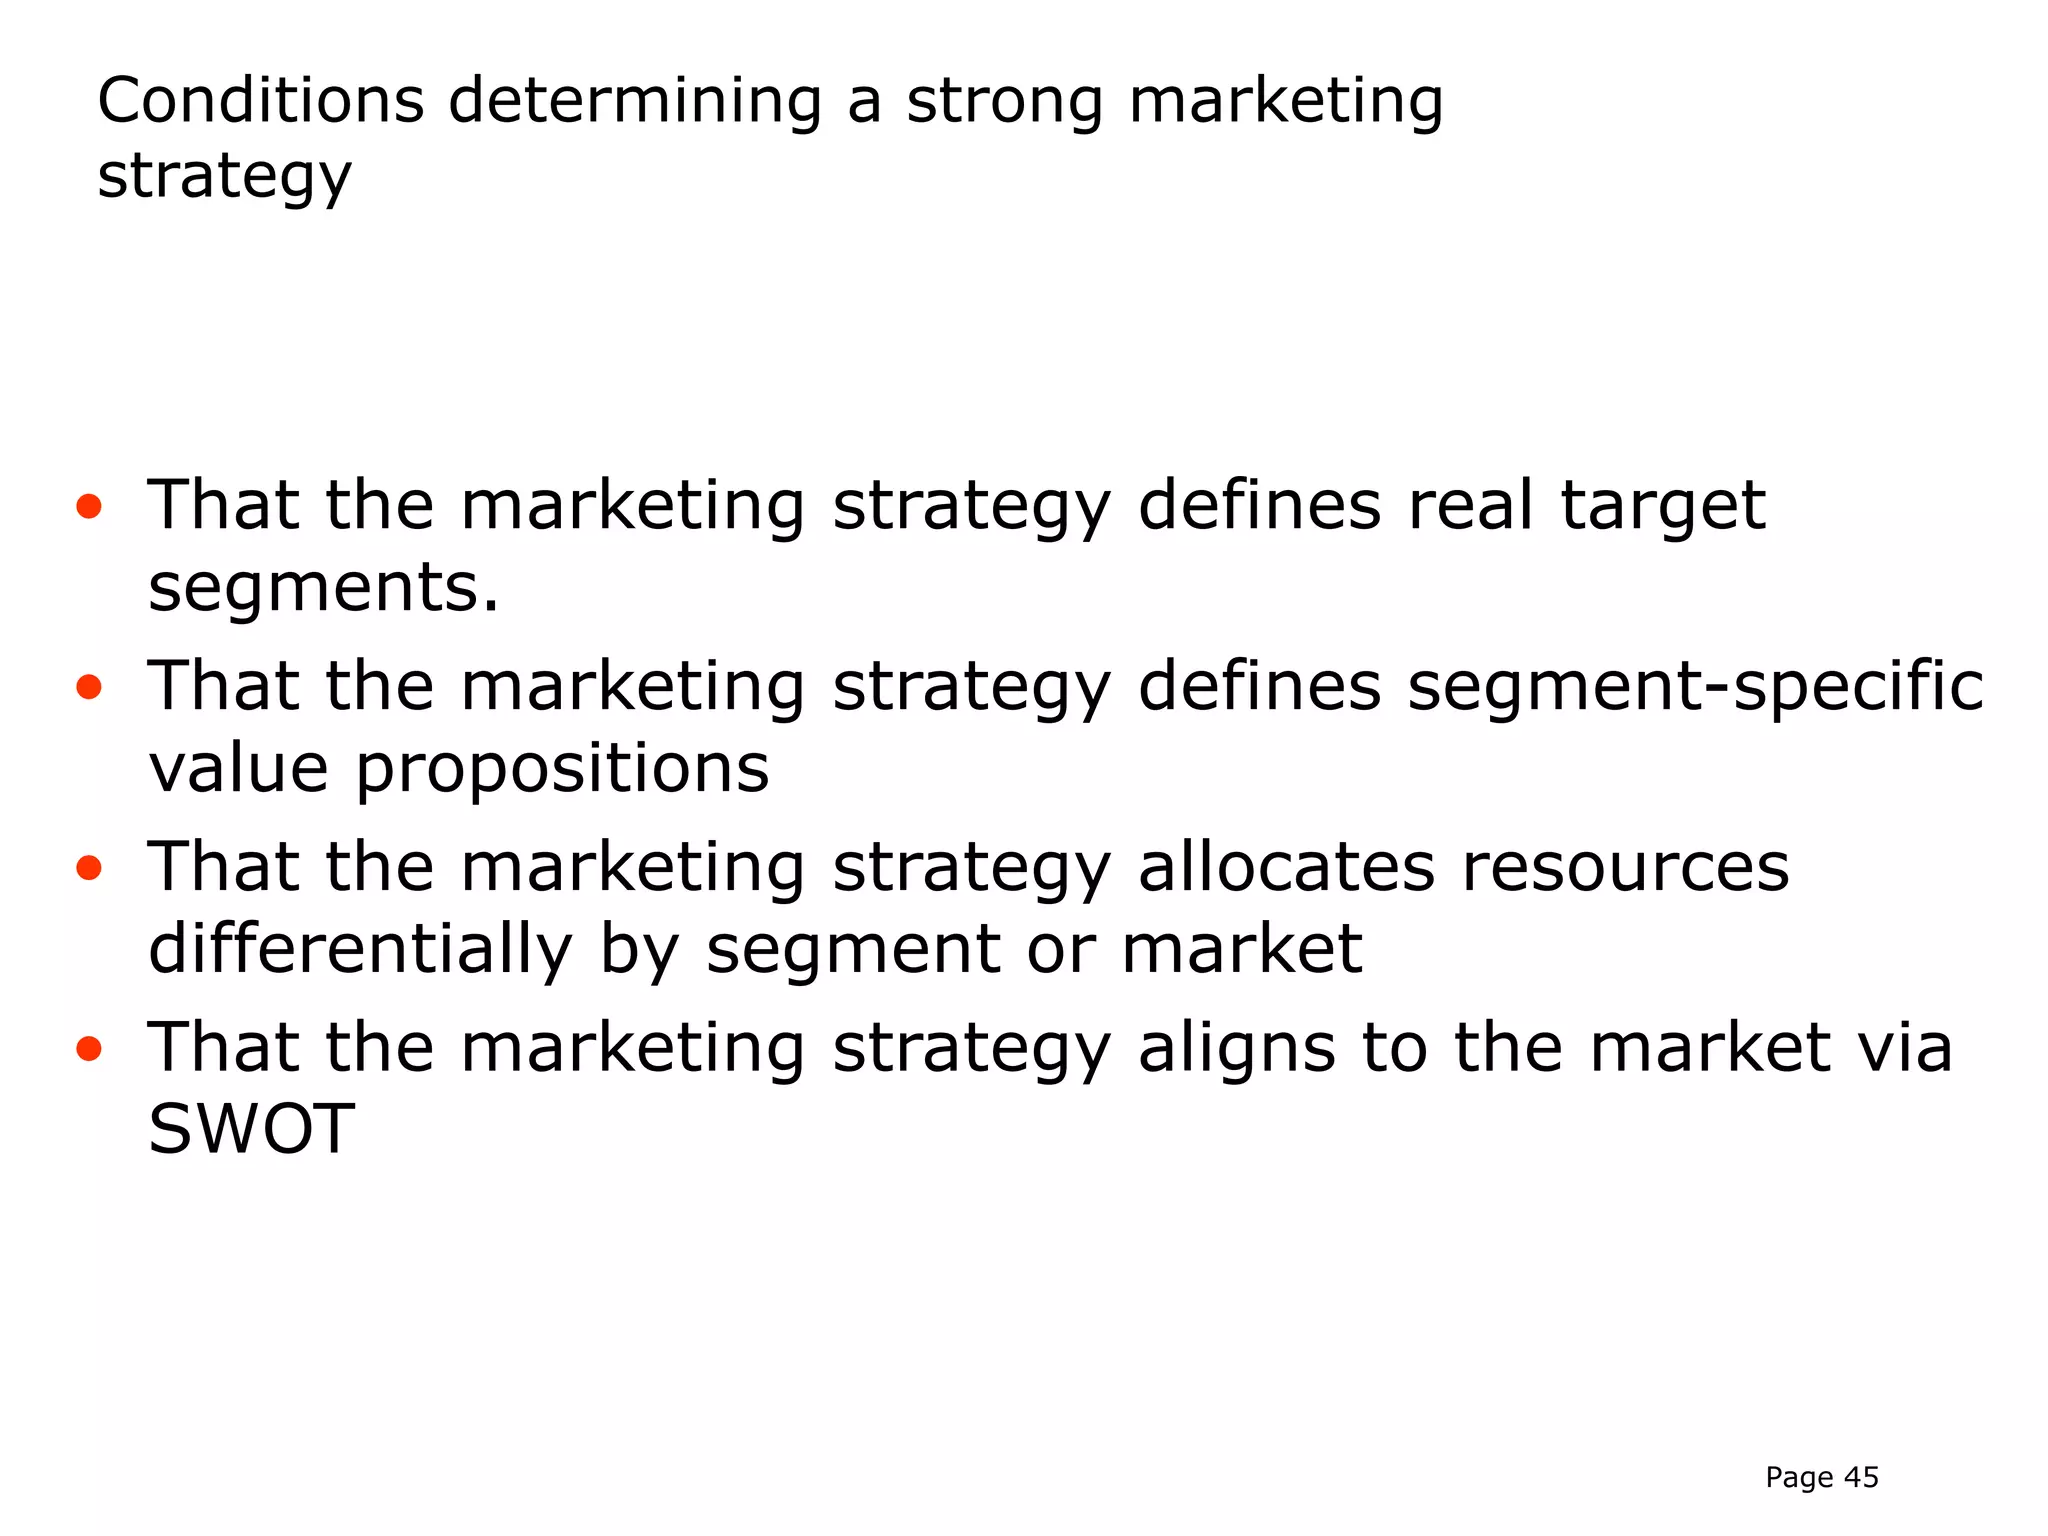
SlideShare a Scribd company logo
1 of 49
The Future of Marketing


      Professor Malcolm McDonald

Plekhanov Russian University of Economics
            29th March 2012


                                            Page 1
Agenda


• A very brief history of marketing
• What marketers must do to be respected by the
  board


                                              Page 2
A VERY BRIEF HISTORY
    OF MARKETING


                   Page 3
3 Principal Communities in Marketing


             • Practitioners

             • Consultants

             • Academics


                                       Page 4
Practitioners


                Page 5
• Technology
• Production
• Sales
• Accountancy
• Fads
• Marketing


               Page 6
CAN YOU SAY WHAT YOUR
               STRATEGY IS?

 “Any strategy statement that cannot explain why
   customers should buy your product or service is
                  doomed to failure”


(Collis D, Rukstad M. “Can you say what your strategy is?” HBR April
                                                     2008 pp 82-91)


                                                              Page 7
InterTech’s 5 Year Profit Performance

Performance (£million)     Base Year    1      2      3      4              5
Sales Revenue                £254      £293   £318   £387   £431       £454
- Cost of goods sold         135       152    167    201    224        236
Gross Contribution           £119      £141   £151   £186   £207        £218
- Manufacturing overhead      48        58     63     82     90          95
- Marketing & Sales           18        23     24     26     27          28
- Research & Development      22        23     23     25     24          24
Net Profit                    £16      £22    £26    £37     £50        £55
Return on Sales (%)          6.3%      7.5%   8.2%   9.6%   11.6% 12.1%
Assets                       £141      £162   £167   £194   £205        £206
Assets (% of sales)          56%       55%    53%    50%    48%         45%
Return on Assets (%)        11.3%      13.5% 15.6% 19.1% 24.4% 26.7%


                                                                   Page 8
InterTech’s 5 Year Market-Based Performance
Performance (£million)       Base Year    1     2      3     4        5
Market Growth                 18.3%      23.4% 17.6% 34.4% 24.0% 17.9%
InterTech Sales Growth (%)    12.8%      17.4% 11.2% 27.1% 16.5% 10.9%
Market Share(%)               20.3%      19.1% 18.4% 17.1% 16.3% 14.9%

Customer Retention (%)        88.2%      87.1% 85.0% 82.2% 80.9% 80.0%
New Customers (%)             11.7%      12.9% 14.9% 24.1% 22.5% 29.2%
% Dissatisfied Customers      13.6%      14.3% 16.1% 17.3% 18.9% 19.6%

Relative Product Quality       +10%      +8%   +5%    +3%   +1%     0%
Relative Service Quality       +0%       +0%   -20%   -3%   -5%     -8%
Relative New Product Sales     +8%       +8%   +7%    +5%   +1%     -4%


                                                                  Page 9
Page 10
The historic rift between marketers and
         the finance department, caused by
            marketing’s reluctance to be
         accountable for what they do, is as
                   marked as ever.

   Tense relations                “Marketers have
  between CFOs and           constantly hidden behind
Marketers are dividing        a fog of measurers that
 boardrooms over the            are based purely on
 value of marketing.             tactical marketing
One in three CFOs said       activity, rather than solid
 they did not believe        financial metrics that are
   marketing to be              relevant to the City”
crucial in determining
       strategy.                       “Marketing in 3D” Deloitte

                                                     Page 11
The Cultural Web (What senior non marketers believe
      about marketers)

                                                              Symbols

                                                              • Cars
                                                              • Offices
                                             Stories          • Terminology        Power
                                           and Myths          • Statistics       Structures
                                      •    Mud doesn’t stick • Lunch
                                      •    Golden child                      • Research withheld
                                      •    Quick promotion                   • Take credit for
                                      •    No loyalty                           others work
                                      •    Churn              Paradigm       • Jargon
                                      •    Costs
                                      •    Experience       • Unaccountable
                                                            • Untouchable
                                             Rituals        • Expensive
                                                            • Slippery         Organisational
                                          • Planning                             Structures
                                          • Delegating                        • Lack of
                                          • Deadlines                           structure
                                          • Off site           Control
                                                               Systems        • Internal focus
                                            meetings                          • Always in
                                                           • 10.00-16.00 hrs    meetings
                                                           • Lunch
                                                           • Travel
                                                           • Soft measurement
                                                           • For self
Source: ‘Defining a Marketing Paradigm’ (Baker, S.                                            Page 12
Consultants


              Page 13
FADS (300)


     •   In Search of Excellence
     •   Marketing Warfare
     •   One Minute Manager
     •   MBWA
     •   Skunk Works
     •   7 Ss
     •   Etc.


                                   Page 14
Academics


            Page 15
There are many excellent scientific journals devoted to
neurosurgery. Month by month, they publish learned
papers, each having been subjected to rigorous peer
review, that chronicle the latest discoveries, hypotheses,
case-studies and innovations in the neurosurgery world.
And the shocking thing is this: they are never read by
neurosurgeons.
Patients are put at risk because of the apparent disdain
that the practitioners have for academic theory and the
accumulated wisdom of others.
You’ll have read the above with growing incredulity. That
can’t be true of neurosurgery, you think. And you’re right, thank
God. It isn’t true. But in another trade, much
closer to home, it very nearly is.

                         Jeremy Bullmore, ‘Bridging the Great Divide,
                              Market Leader, Spring, 2006, page. 14

                                                                    Page 16
The purpose of strategic marketing


     The overall purpose of strategic
     marketing and its principal focus is
     the identification and creation of
     sustainable competitive advantage


© Professor Malcolm McDonald, Cranfield School of Management

                                                               Page 17
Map of the marketing domain


                     Define markets
                      & understand
                          value


      Monitor           Asset         Determine value
       value            Base            proposition


                        Deliver
                         value

                                                  Page 18
Strategy
                Ineffective               Effective


                   Die
   Efficient                             Thrive
                (quickly)

Tactics

                   Die
  Inefficient                            Survive
                (slowly)


                                                      Page 19
Financial Risk and Return


             High
                  1


                  2
 Return

                  3


             Low

                        Low                                           High
                                                               Risk
 Adapted from Sri Srikanthan, Cranfield School of Management

                                                                         Page 20
Key Elements of World Class Marketing


1.    A deep understanding of the market place
2.    Correct needs-based segmentation and prioritisation
3.    Segment-specific propositions
4.    Powerful differentiation, positioning and branding
5.    Effective strategic marketing planning processes
6.    Long-term integrated marketing strategies
7.    A deep understanding of the needs of major customers
8.    Market/customer-driven organisation structures
9.    Professionally-qualified marketing people
10.   Institutionalised creativity and innovation


                                                             Page 21
Excellent Strategies              Weak Strategies

• Target needs based              • Target product categories
  segments                        • Make similar offers to all
• Make a specific offer to each     segments
  segment                         • Have little understanding of
• Leverage their strengths          their strengths and
  and minimise their                weaknesses
  weaknesses                      • Plan using historical data
• Anticipate the future


                                                         Page 22
Differentiation is at the heart of successful
marketing


 “For marketers, differentiation today is more
 challenging than at any time in history – yet it
 remains at the heart of successful marketing. More
 importantly, it remains the key to a company’s
 survival.”


                                                Page 23
Justifying investment in marketing assets


 Whilst accountants do not measure intangible assets,
 the discrepancy between market and book values
 shows that investors do.


                                               Page 24
Intangibles


    P and G paid £31 billion for Gillette, but bought only £4
    billion of tangible assets
-   Gillette brand                    £ 4.0 billion
-   Duracell brand                          £ 2.5 billion
-   Oral B                                  £ 2.0 billion
-   Braun                                   £ 1.5 billion
-   Retail and supplier network             £10.0 billion
-   Gillette innovative capability    £ 7.0 billion
                               TOTAL        £27.0 billion

(David Haigh, Brand Finance, Marketing Magazine, 1st April 2005)


                                                                   Page 25
Balance sheet


              Assets                                  Liabilities
           - Land                                     - Shares
           - Buildings                                - Loans
           - Plant                                    - Overdrafts
           - Vehicles                                 etc.
           etc.


        £100 million                                  £100 million
  © Professor Malcolm McDonald, Cranfield School of
  Management                                                         Page 26
Balance sheet


              Assets                                   Liabilities

        - Land                                - Shares
        - Buildings                           - Loans
        - Plant                               - Overdrafts
        - Vehicles                            etc.
        etc.


         £100 million                                  £900 million

   © Professor Malcolm McDonald, Cranfield School of
   Management                                                         Page 27
Balance sheet


               Assets                                Liabilities

         - Land                                - Shares
         - Buildings                           - Loans
         - Plant                               - Overdrafts
         - Vehicles                            etc.


        Goodwill £800m


          £900 million                               £900 million
 © Professor Malcolm McDonald, Cranfield School of
 Management                                                         Page 28
Page 29
Asset Breakdown for the top 10 countries by
Enterprise Value (US$ millions, 2011)


                                              Page 30
Brands are key intangibles in most businesses

Brands are estimated to represent at least 20% of the intangible value of
businesses on the major world stock markets. Brands combine with other tangible
and intangible assets to create value

     Developed Markets

          Brand                               Brand                    Marketing intangible

          20%                                 Patents
                                                                       Technology intangibles
                                              Software
                          Intangible assets
                                              Customer relationships   Customer intangible
           Other
          Intangible                          Distribution rights
          Assets                                                       Contract intangibles
                                              Assembled workforce

            55%                               Business Goodwill


            Tangible      Tangible assets
            Assets                                                               Illustrative
            25%

 Source: Brand Finance                                                         Page 31
Brands Increasingly Drive Business Results
              Brands affect business value by influencing the behaviour of a wide range of Shell’s
              stakeholders, some of which directly impact Shell’s P&L (and hence value)


                         STAKEHOLDER                   STAKEHOLDER                FINANCIAL      SHAREHOLDER
                          PERCEPTION                    BEHAVIOUR                   IMPACT          VALUE

                                                    • Pay price premium
                           Customers                                              Revenues
                            - individuals,
                                                    • Buy more
                              businesses
                          Suppliers /               • Lower prices
                           Partners                 • Better terms                Costs
              Brand         - businesses,           • Willingness to partner      Revenues
                            energy asset
Trademarks


                               owners               •(more opportunities)
                          Employees
                                                • Better retention
                           - current and
                              potential
                                                                                  Costs
                                                • Lower salary expectations
             Reputatio Shareholders /
                                                • Better qualified candidates
                                                                                  Productivity
                n         Bankers
                            - individual and
                               institutional    •   Higher PE ratio
              Indirect
             influence
                             Other              •   Lower volatility              Costs           Influences
                         Stakeholders               Lower borrowing costs
             on value                           •
                                                                                  Risk           business and
                         - government, media,
                            opinion formers,    •   Better repayment conditions                  brand value
                           academics, public,
                            environmentalists
Map of the marketing domain


                     Define markets          Strategic zone
                     & understand             where metrics
                                             are defined
                     value                   (Level 1)


                         Asset        Determine
   Monitor
                                      value
   value                 Base
                                      Proposition


 Measurement zone
 where metrics
 are applied         Deliver
 (Levels 2 & 3)      value

                                                     Page 33
What is Marketing Due Diligence?


                      Marketing Due
                         Diligence
                     Risk Assessment


 Market Risk:          Strategy risk:   Implementation risk:
 Is the market        Will we get our     Will we get our
     there?           planned share?      planned profit?


                                                  Page 34
Market Risk Profile


                               The marketing strategy has a higher
• Product Category Existence   probability of success if the product
                               category is well established

                               If the target segment is well
• Segment Existence            established

                               If the sales volumes are well
• Sales Volumes                supported by evidence

                               If the forecast growth is in line with
• Forecast Growth              historical trends

                               If the pricing levels are conservative
• Pricing Assumptions          relative to current pricing levels


                                                            Page 35
Ansoff matrix


                                                     PRODUCTS
                                           increasing technological newness
                                         Present                   New


            Present                Market                   Product
                                   Penetration              Development
MARKETS
increasing
market
newness
                                     Market
                 New                                       Diversification
                                     Extension


 © Professor Malcolm McDonald, Cranfield School of
 Management
                                                                              Page 36
Market Share Risk Profile


                                    The marketing strategy has a higher
                                    probability of success if the target is defined
                                    in terms of homogeneous segments and is
                                    characterised by utilisable data
  • Target Market Definition

                                    If the proposition delivered to each segment
                                    is different from that delivered to other
                                    segments and addresses the needs which
                                    characterised the target segment

  • Proposition Specification
                                    If the strengths and weaknesses of the
                                    organisation are independently assessed and
                                    the choice of target and proposition
                                    leverages strengths and minimises
                                    weaknesses
  • SWOT Alignment

                                    If choice of target and proposition is
                                    different from that of major competitors

  • Strategy Uniqueness
                                    If changes in the external microenvironment
                                    and macroenvironment are identified and
  • Anticipation of market change   their implications allowed for


                                                                              Page 37
Listen to how customers talk about category
need


Customer View                   Supplier View
Advice
• cutting costs                 • fast PAD family
• future technology direction   • multimedia FRADs
Help                            • PIX firewall
• design & configuration
• process engineering           • Solutions
• electron commerce             • Gigabit Ethernet
Run                             • solutions
• international network
• disaster recovery             • high performance
                                • LAN support


                                                     Page 38
                                                               Page 38
Understand the different category buyers


                                 Business

                       Business
                      perfectionist          Save my
                                              budget

              Radical thinkers
                                       Business
                     Profit engineer    general
   “Reward”                                              “Relief”
                          Radical              Save my
                         architect              career


                Technical              Conservative
                 idealist               technocrat


                                 Technical
                                                               Page 39
                                                                         Page 39
Shareholder Value Risk Profile


  • Profit Pool                  The marketing strategy has a
                                 higher probability of success if
                                 the targeted profit pool is high
                                 and growing

  • Profit Sources               If the source of new business is
                                 growth in the existing profit pool


  • Competitor Impact            If the profit impact on
                                 competitors is small and
                                 distributed

                                 If the internal gross margin
  • Internal Gross Margin        assumptions are conservative
    Assumptions                  relative to current products


  • Assumptions of Other         If assumptions regarding other
    Costs                        costs, including marketing
                                 support, are higher than existing
                                 costs
                                                              Page 40
Map of the marketing domain


                     Define markets          Strategic zone
                     & understand             where metrics
                                             are defined
                     value                   (Level 1)


                         Asset        Determine
   Monitor
                                      value
   value                 Base
                                      Proposition


 Measurement zone
 where metrics
 are applied         Deliver
 (Levels 2 & 3)      value

                                                     Page 41
Overall Marketing Metrics Model

                                          Lead indicators               Lag indicators
               Resource
Intention/                         Plan/          Strategy/           Objectives/     Forecast/
               allocation/
actuality                          action         achievement         results         profit
               spend
                                                   PFs
               budget          actions, esp.                          product          corporate
Business       funds &                                                                 performance
                               marketing                              market
element        time                                                   segment
                                                   HFs
                               £   what   who
                               £   what   who                            ms%            corporate
               budget          £                                         sales£         rev£
                                   what   who      CSFs
                               £                                         profit£        profit£
                                   what   who


Measure-       application      costs,            metrics on          performance      turnover,
ment               of           activity          achievement         by product       profit &
               spend            milestones        of factor to        market           shareholder
                                & outputs         required level      segment          value
Positioning
of issues in
the model                    Cost to achieve      Required by   Market growth
                             Responsibilities     customers.    Customer acquisition/
                                                  Relative to   retention/ uptrading/ X-selling/
                                                  competitors   regained                Page 42
                                                                Product/customer mix
Map of the marketing domain


                     Define markets          Strategic zone
                     & understand             where metrics
                                             are defined
                     value                   (Level 1)


                         Asset        Determine
   Monitor
                                      value
   value                 Base
                                      Proposition


 Measurement zone
 where metrics
 are applied         Deliver
 (Levels 2 & 3)      value

                                                     Page 43
Projected cash              DCF and NPV
                                                               flows from                  methods
                                                               investing in a              implicitly make
                                                               promotion        A          this comparison


                                                                                                         B
                                                                                          Companies
                                                                                          should be          Assumed cash
                                                                             C            making this        flow resulting
                                                                                          comparison         from doing
                                                                      More likely                            nothing
                                                                      cash flow
                                                                      resulting from
                                                                      doing nothing

                             Note: Most executives compare the cash flow from
                             promotion against the default scenario of doing nothing
                             assuming, incorrectly, that the present health of the
                             company will persist indefinitely if the investment is not
                             made. For a better assessment of the promotion’s value,
                             the comparison should be between the projected
                             discounted cash flow and the more likely scenario of a
                             decline in performance in the absence of promotional                            Figure 10
                             investment.

Adapted from Christensen CM et al, ( 2008 )

                                                                           2 + 2      + 2     + 2                      = £-0.6 million
                                               £ - 7 million +           (1+r) (1+r)²  (1+r)³ (1+r)4


                                                 £ - 1 million +           2 + 2      + 2     + 2                      = £5.4 million
                                                                         (1+r) (1+r)²  (1+r)³ (1+r)4

                                                                                                                                 Page 44
Conditions determining a strong marketing
strategy


• That the marketing strategy defines real target
  segments.
• That the marketing strategy defines segment-specific
  value propositions
• That the marketing strategy allocates resources
  differentially by segment or market
• That the marketing strategy aligns to the market via
  SWOT


                                               Page 45
APPENDIX


© Professor Malcolm              Page 46
McDonald
Valuing Key Market Segments


 Background/Facts

 •Risk and return are positively correlated, ie. as risk increases, investors require a
 higher return.
 •Risk is measured by the volatility in returns, ie. high risk is the likelihood of either
 making a very good return or losing all your money. This can be described as the
 quality of returns.
 •All assets are defined as having future value to the organisation. Hence assets
   to be valued include not only tangible assets like plant and machinery, but intangible
   assets, such as Key Market Segments.
 •The present value of future cash flows is the most acceptable method to
   value assets including key market segments.
 •The present value is increased by:
 - increasing the future cash flows
 - making the future cash flows ‘happen’ earlier
 - reducing the risk in these cash flows, ie. improving the certainty of these cash flows,
   and, hence, reducing the required rate of return.
© Professor Malcolm
McDonald
                                                                              Page 47
Suggested Approach
•Identify your key market segments. It is helpful if they can be classified on a vertical axis (a kind of
 thermometer) according to their attractiveness to your company. ‘Attractiveness’ usually means the
 potential of each for growth in your profits over a period of between 3 and 5 years. (See the attached matrix)
•Based on your current experience and planning horizon that you are confident with, make a projection of
 future net free cash in-flows from your segments. It is normal to select a period such as 3 or 5 years.
• These calculations will consist of three parts:
        • revenue forecasts for each year;
        • cost forecasts for each year;
        • net free cash flow for each segment for each year.
•Identify the key factors that are likely to either increase or decrease these future
 cash flows.
•These factors are likely to be assessed according to the following factors:
        • the riskiness of the product/market segment relative to its position on the ANSOFF matrix;
        • the riskiness of the marketing strategies to achieve the revenue and market share;
        • the riskiness of the forecast profitability (e.g. the cost forecast accuracy ).
• Now recalculate the revenues, costs and net free cash flows for each year, having
  adjusted the figures using the risks (probabilities) from the above.
•Ask your accountant to provide you with the overall SBU cost of capital and capital used in the SBU. This will
               not consist only of tangible assets. Thus, £1,000,000 capital at a required shareholder rate of retur
    Would give £100,000 as the minimum return necessary.
• Deduct the proportional cost of capital from the free cash flow for each segment for each year.
• An aggregate positive net present value indicates that you are creating shareholder value – ie.
  achieving overall returns greater than the weighted average cost of capital, having taken
  into account the risk associated with future cash flows.

                                                                                                  Page 48
Portfolio analysis - directional policy matrix (DPM)
                                     Relative company competitiveness
                                         High                  Low


                       High
                                                               ?
                                       Invest/
                                       build
            Segment                                                                  NB. Suggested
                                                                                     time period -
            attractiveness                                                           3 years
                                       Maintain
                                                         Manage for
                       Low             No                cash
                                       change


                               Present position       Forecast position in 3 years
                                                                                        Page 49
© Professor Malcolm McDonald

More Related Content

Similar to Plehanov university prof mc_donald

01 torsdag michael mokhberi apptus agile merchandising sebc
01 torsdag michael mokhberi apptus agile merchandising sebc01 torsdag michael mokhberi apptus agile merchandising sebc
01 torsdag michael mokhberi apptus agile merchandising sebcJetshop
 
Innovative Go-To-Market strategies for Financial Product Innovations
Innovative Go-To-Market strategies for Financial Product InnovationsInnovative Go-To-Market strategies for Financial Product Innovations
Innovative Go-To-Market strategies for Financial Product InnovationsKenny Ong
 
Globalization strategy - Walmart
Globalization strategy - WalmartGlobalization strategy - Walmart
Globalization strategy - WalmartPradeep Loganathan
 
Marketing and Product Development
Marketing and Product DevelopmentMarketing and Product Development
Marketing and Product DevelopmentRoss Settles
 
B2B Sales Strategy: Insider tips - MaRS Best Practices
B2B Sales Strategy: Insider tips - MaRS Best PracticesB2B Sales Strategy: Insider tips - MaRS Best Practices
B2B Sales Strategy: Insider tips - MaRS Best PracticesMaRS Discovery District
 
Improving your business operations by meeting your company’s objective, missi...
Improving your business operations by meeting your company’s objective, missi...Improving your business operations by meeting your company’s objective, missi...
Improving your business operations by meeting your company’s objective, missi...Kenny Ong
 
Independent consultants working together
Independent consultants working togetherIndependent consultants working together
Independent consultants working togetherBryan Cassady
 
Med Week Final - Arete Leadership Consulting
Med Week Final - Arete Leadership ConsultingMed Week Final - Arete Leadership Consulting
Med Week Final - Arete Leadership ConsultingALC
 
Journey from an idea to business
Journey from an idea to businessJourney from an idea to business
Journey from an idea to businessSatish Kataria
 
Vlerick Sales Forum & Deloitte Study: Sales & Procurement: Friends or Foes?
Vlerick Sales Forum & Deloitte Study: Sales & Procurement: Friends or Foes?Vlerick Sales Forum & Deloitte Study: Sales & Procurement: Friends or Foes?
Vlerick Sales Forum & Deloitte Study: Sales & Procurement: Friends or Foes?Vlerick Business School
 
Priority Content Planning with 3-D Content Mapping
Priority Content Planning with 3-D Content MappingPriority Content Planning with 3-D Content Mapping
Priority Content Planning with 3-D Content MappingPardot
 
MICG - Strategy and Risk Management for MTU Services
MICG - Strategy and Risk Management for MTU ServicesMICG - Strategy and Risk Management for MTU Services
MICG - Strategy and Risk Management for MTU ServicesKenny Ong
 
Presentation1 modified
Presentation1 modifiedPresentation1 modified
Presentation1 modifiedbuntydusa
 
Session 1 ( p.m)
Session 1 ( p.m)Session 1 ( p.m)
Session 1 ( p.m)hebaeldaly
 
Business Plan Workshop
Business Plan WorkshopBusiness Plan Workshop
Business Plan WorkshopVidhan Rana
 

Similar to Plehanov university prof mc_donald (20)

Paul June Cv Portfolio Final
Paul June Cv Portfolio FinalPaul June Cv Portfolio Final
Paul June Cv Portfolio Final
 
01 torsdag michael mokhberi apptus agile merchandising sebc
01 torsdag michael mokhberi apptus agile merchandising sebc01 torsdag michael mokhberi apptus agile merchandising sebc
01 torsdag michael mokhberi apptus agile merchandising sebc
 
Innovative Go-To-Market strategies for Financial Product Innovations
Innovative Go-To-Market strategies for Financial Product InnovationsInnovative Go-To-Market strategies for Financial Product Innovations
Innovative Go-To-Market strategies for Financial Product Innovations
 
Globalization strategy - Walmart
Globalization strategy - WalmartGlobalization strategy - Walmart
Globalization strategy - Walmart
 
B2B Sales Strategy for Startups
B2B Sales Strategy for StartupsB2B Sales Strategy for Startups
B2B Sales Strategy for Startups
 
Marketing and Product Development
Marketing and Product DevelopmentMarketing and Product Development
Marketing and Product Development
 
Milagrow Business and Knowledge Solutions Corporate PPT
Milagrow Business and Knowledge Solutions Corporate PPTMilagrow Business and Knowledge Solutions Corporate PPT
Milagrow Business and Knowledge Solutions Corporate PPT
 
B2B Sales Strategy: Insider tips - MaRS Best Practices
B2B Sales Strategy: Insider tips - MaRS Best PracticesB2B Sales Strategy: Insider tips - MaRS Best Practices
B2B Sales Strategy: Insider tips - MaRS Best Practices
 
Improving your business operations by meeting your company’s objective, missi...
Improving your business operations by meeting your company’s objective, missi...Improving your business operations by meeting your company’s objective, missi...
Improving your business operations by meeting your company’s objective, missi...
 
Independent consultants working together
Independent consultants working togetherIndependent consultants working together
Independent consultants working together
 
Med Week Final - Arete Leadership Consulting
Med Week Final - Arete Leadership ConsultingMed Week Final - Arete Leadership Consulting
Med Week Final - Arete Leadership Consulting
 
Journey from an idea to business
Journey from an idea to businessJourney from an idea to business
Journey from an idea to business
 
Sales Ecosystem
Sales EcosystemSales Ecosystem
Sales Ecosystem
 
Vlerick Sales Forum & Deloitte Study: Sales & Procurement: Friends or Foes?
Vlerick Sales Forum & Deloitte Study: Sales & Procurement: Friends or Foes?Vlerick Sales Forum & Deloitte Study: Sales & Procurement: Friends or Foes?
Vlerick Sales Forum & Deloitte Study: Sales & Procurement: Friends or Foes?
 
5 wake up calls
5 wake up calls 5 wake up calls
5 wake up calls
 
Priority Content Planning with 3-D Content Mapping
Priority Content Planning with 3-D Content MappingPriority Content Planning with 3-D Content Mapping
Priority Content Planning with 3-D Content Mapping
 
MICG - Strategy and Risk Management for MTU Services
MICG - Strategy and Risk Management for MTU ServicesMICG - Strategy and Risk Management for MTU Services
MICG - Strategy and Risk Management for MTU Services
 
Presentation1 modified
Presentation1 modifiedPresentation1 modified
Presentation1 modified
 
Session 1 ( p.m)
Session 1 ( p.m)Session 1 ( p.m)
Session 1 ( p.m)
 
Business Plan Workshop
Business Plan WorkshopBusiness Plan Workshop
Business Plan Workshop
 

More from Plekhanov Russian University of Economics

презентация 1 customer care_ставрополь_скоробогатых_май15
презентация 1 customer care_ставрополь_скоробогатых_май15презентация 1 customer care_ставрополь_скоробогатых_май15
презентация 1 customer care_ставрополь_скоробогатых_май15Plekhanov Russian University of Economics
 
штыхно д.а. опыт использования педагогических технологий в западных вузах
штыхно д.а.   опыт использования педагогических технологий в западных вузахштыхно д.а.   опыт использования педагогических технологий в западных вузах
штыхно д.а. опыт использования педагогических технологий в западных вузахPlekhanov Russian University of Economics
 
занятие 1 начало работы с ms word редактирование
занятие 1 начало работы с ms word редактированиезанятие 1 начало работы с ms word редактирование
занятие 1 начало работы с ms word редактированиеPlekhanov Russian University of Economics
 
10. регламенты привлечения коммерческих заказов для проектной работы студентов
10. регламенты привлечения коммерческих заказов для проектной работы студентов10. регламенты привлечения коммерческих заказов для проектной работы студентов
10. регламенты привлечения коммерческих заказов для проектной работы студентовPlekhanov Russian University of Economics
 
11. пример этапы рейтинговая система оценки
11. пример этапы рейтинговая система оценки11. пример этапы рейтинговая система оценки
11. пример этапы рейтинговая система оценкиPlekhanov Russian University of Economics
 
10. регламенты привлечения коммерческих заказов для проектной работы студентов
10. регламенты привлечения коммерческих заказов для проектной работы студентов10. регламенты привлечения коммерческих заказов для проектной работы студентов
10. регламенты привлечения коммерческих заказов для проектной работы студентовPlekhanov Russian University of Economics
 
9.инновационные технологии обучения. что это такое.
9.инновационные технологии обучения. что это такое.9.инновационные технологии обучения. что это такое.
9.инновационные технологии обучения. что это такое.Plekhanov Russian University of Economics
 
8..общие положения концепции проектного обучения в рэу
8..общие положения концепции проектного обучения в  рэу8..общие положения концепции проектного обучения в  рэу
8..общие положения концепции проектного обучения в рэуPlekhanov Russian University of Economics
 
5 моделирование инновационной обучающей среды
5 моделирование инновационной обучающей среды5 моделирование инновационной обучающей среды
5 моделирование инновационной обучающей средыPlekhanov Russian University of Economics
 
4проблемы формирования инновационного мышления
4проблемы формирования инновационного мышления4проблемы формирования инновационного мышления
4проблемы формирования инновационного мышленияPlekhanov Russian University of Economics
 

More from Plekhanov Russian University of Economics (20)

Плехановский маркер
Плехановский маркерПлехановский маркер
Плехановский маркер
 
кафедра маркетинга на встрече с котлером
кафедра маркетинга на встрече с котлеромкафедра маркетинга на встрече с котлером
кафедра маркетинга на встрече с котлером
 
презентация 1 customer care_ставрополь_скоробогатых_май15
презентация 1 customer care_ставрополь_скоробогатых_май15презентация 1 customer care_ставрополь_скоробогатых_май15
презентация 1 customer care_ставрополь_скоробогатых_май15
 
штыхно д.а. опыт использования педагогических технологий в западных вузах
штыхно д.а.   опыт использования педагогических технологий в западных вузахштыхно д.а.   опыт использования педагогических технологий в западных вузах
штыхно д.а. опыт использования педагогических технологий в западных вузах
 
Presentation sherbakova
Presentation sherbakovaPresentation sherbakova
Presentation sherbakova
 
Pres1
Pres1Pres1
Pres1
 
Describing graphs
Describing graphsDescribing graphs
Describing graphs
 
занятие 1 начало работы с ms word редактирование
занятие 1 начало работы с ms word редактированиезанятие 1 начало работы с ms word редактирование
занятие 1 начало работы с ms word редактирование
 
27.02. меламуд
27.02. меламуд27.02. меламуд
27.02. меламуд
 
13.03 добрякова
13.03 добрякова13.03 добрякова
13.03 добрякова
 
10. регламенты привлечения коммерческих заказов для проектной работы студентов
10. регламенты привлечения коммерческих заказов для проектной работы студентов10. регламенты привлечения коммерческих заказов для проектной работы студентов
10. регламенты привлечения коммерческих заказов для проектной работы студентов
 
11. пример этапы рейтинговая система оценки
11. пример этапы рейтинговая система оценки11. пример этапы рейтинговая система оценки
11. пример этапы рейтинговая система оценки
 
11. 20.03. попов
11. 20.03. попов11. 20.03. попов
11. 20.03. попов
 
10. регламенты привлечения коммерческих заказов для проектной работы студентов
10. регламенты привлечения коммерческих заказов для проектной работы студентов10. регламенты привлечения коммерческих заказов для проектной работы студентов
10. регламенты привлечения коммерческих заказов для проектной работы студентов
 
9.инновационные технологии обучения. что это такое.
9.инновационные технологии обучения. что это такое.9.инновационные технологии обучения. что это такое.
9.инновационные технологии обучения. что это такое.
 
8..общие положения концепции проектного обучения в рэу
8..общие положения концепции проектного обучения в  рэу8..общие положения концепции проектного обучения в  рэу
8..общие положения концепции проектного обучения в рэу
 
7проектное управление
7проектное управление7проектное управление
7проектное управление
 
6. учебный проект1
6. учебный проект16. учебный проект1
6. учебный проект1
 
5 моделирование инновационной обучающей среды
5 моделирование инновационной обучающей среды5 моделирование инновационной обучающей среды
5 моделирование инновационной обучающей среды
 
4проблемы формирования инновационного мышления
4проблемы формирования инновационного мышления4проблемы формирования инновационного мышления
4проблемы формирования инновационного мышления
 

Recently uploaded

Insurers' journeys to build a mastery in the IoT usage
Insurers' journeys to build a mastery in the IoT usageInsurers' journeys to build a mastery in the IoT usage
Insurers' journeys to build a mastery in the IoT usageMatteo Carbone
 
Vip Female Escorts Noida 9711199171 Greater Noida Escorts Service
Vip Female Escorts Noida 9711199171 Greater Noida Escorts ServiceVip Female Escorts Noida 9711199171 Greater Noida Escorts Service
Vip Female Escorts Noida 9711199171 Greater Noida Escorts Serviceankitnayak356677
 
Lowrate Call Girls In Sector 18 Noida ❤️8860477959 Escorts 100% Genuine Servi...
Lowrate Call Girls In Sector 18 Noida ❤️8860477959 Escorts 100% Genuine Servi...Lowrate Call Girls In Sector 18 Noida ❤️8860477959 Escorts 100% Genuine Servi...
Lowrate Call Girls In Sector 18 Noida ❤️8860477959 Escorts 100% Genuine Servi...lizamodels9
 
Lowrate Call Girls In Laxmi Nagar Delhi ❤️8860477959 Escorts 100% Genuine Ser...
Lowrate Call Girls In Laxmi Nagar Delhi ❤️8860477959 Escorts 100% Genuine Ser...Lowrate Call Girls In Laxmi Nagar Delhi ❤️8860477959 Escorts 100% Genuine Ser...
Lowrate Call Girls In Laxmi Nagar Delhi ❤️8860477959 Escorts 100% Genuine Ser...lizamodels9
 
Progress Report - Oracle Database Analyst Summit
Progress  Report - Oracle Database Analyst SummitProgress  Report - Oracle Database Analyst Summit
Progress Report - Oracle Database Analyst SummitHolger Mueller
 
0183760ssssssssssssssssssssssssssss00101011 (27).pdf
0183760ssssssssssssssssssssssssssss00101011 (27).pdf0183760ssssssssssssssssssssssssssss00101011 (27).pdf
0183760ssssssssssssssssssssssssssss00101011 (27).pdfRenandantas16
 
/:Call Girls In Jaypee Siddharth - 5 Star Hotel New Delhi ➥9990211544 Top Esc...
/:Call Girls In Jaypee Siddharth - 5 Star Hotel New Delhi ➥9990211544 Top Esc.../:Call Girls In Jaypee Siddharth - 5 Star Hotel New Delhi ➥9990211544 Top Esc...
/:Call Girls In Jaypee Siddharth - 5 Star Hotel New Delhi ➥9990211544 Top Esc...lizamodels9
 
Monte Carlo simulation : Simulation using MCSM
Monte Carlo simulation : Simulation using MCSMMonte Carlo simulation : Simulation using MCSM
Monte Carlo simulation : Simulation using MCSMRavindra Nath Shukla
 
Russian Faridabad Call Girls(Badarpur) : ☎ 8168257667, @4999
Russian Faridabad Call Girls(Badarpur) : ☎ 8168257667, @4999Russian Faridabad Call Girls(Badarpur) : ☎ 8168257667, @4999
Russian Faridabad Call Girls(Badarpur) : ☎ 8168257667, @4999Tina Ji
 
BEST Call Girls In Greater Noida ✨ 9773824855 ✨ Escorts Service In Delhi Ncr,
BEST Call Girls In Greater Noida ✨ 9773824855 ✨ Escorts Service In Delhi Ncr,BEST Call Girls In Greater Noida ✨ 9773824855 ✨ Escorts Service In Delhi Ncr,
BEST Call Girls In Greater Noida ✨ 9773824855 ✨ Escorts Service In Delhi Ncr,noida100girls
 
VIP Call Girl Jamshedpur Aashi 8250192130 Independent Escort Service Jamshedpur
VIP Call Girl Jamshedpur Aashi 8250192130 Independent Escort Service JamshedpurVIP Call Girl Jamshedpur Aashi 8250192130 Independent Escort Service Jamshedpur
VIP Call Girl Jamshedpur Aashi 8250192130 Independent Escort Service JamshedpurSuhani Kapoor
 
Call Girls Pune Just Call 9907093804 Top Class Call Girl Service Available
Call Girls Pune Just Call 9907093804 Top Class Call Girl Service AvailableCall Girls Pune Just Call 9907093804 Top Class Call Girl Service Available
Call Girls Pune Just Call 9907093804 Top Class Call Girl Service AvailableDipal Arora
 
2024 Numerator Consumer Study of Cannabis Usage
2024 Numerator Consumer Study of Cannabis Usage2024 Numerator Consumer Study of Cannabis Usage
2024 Numerator Consumer Study of Cannabis UsageNeil Kimberley
 
Call Girls in Gomti Nagar - 7388211116 - With room Service
Call Girls in Gomti Nagar - 7388211116  - With room ServiceCall Girls in Gomti Nagar - 7388211116  - With room Service
Call Girls in Gomti Nagar - 7388211116 - With room Servicediscovermytutordmt
 
Mondelez State of Snacking and Future Trends 2023
Mondelez State of Snacking and Future Trends 2023Mondelez State of Snacking and Future Trends 2023
Mondelez State of Snacking and Future Trends 2023Neil Kimberley
 
Call Girls In Connaught Place Delhi ❤️88604**77959_Russian 100% Genuine Escor...
Call Girls In Connaught Place Delhi ❤️88604**77959_Russian 100% Genuine Escor...Call Girls In Connaught Place Delhi ❤️88604**77959_Russian 100% Genuine Escor...
Call Girls In Connaught Place Delhi ❤️88604**77959_Russian 100% Genuine Escor...lizamodels9
 
BEST Call Girls In Old Faridabad ✨ 9773824855 ✨ Escorts Service In Delhi Ncr,
BEST Call Girls In Old Faridabad ✨ 9773824855 ✨ Escorts Service In Delhi Ncr,BEST Call Girls In Old Faridabad ✨ 9773824855 ✨ Escorts Service In Delhi Ncr,
BEST Call Girls In Old Faridabad ✨ 9773824855 ✨ Escorts Service In Delhi Ncr,noida100girls
 
RE Capital's Visionary Leadership under Newman Leech
RE Capital's Visionary Leadership under Newman LeechRE Capital's Visionary Leadership under Newman Leech
RE Capital's Visionary Leadership under Newman LeechNewman George Leech
 
VIP Call Girls Pune Kirti 8617697112 Independent Escort Service Pune
VIP Call Girls Pune Kirti 8617697112 Independent Escort Service PuneVIP Call Girls Pune Kirti 8617697112 Independent Escort Service Pune
VIP Call Girls Pune Kirti 8617697112 Independent Escort Service PuneCall girls in Ahmedabad High profile
 

Recently uploaded (20)

Insurers' journeys to build a mastery in the IoT usage
Insurers' journeys to build a mastery in the IoT usageInsurers' journeys to build a mastery in the IoT usage
Insurers' journeys to build a mastery in the IoT usage
 
Vip Female Escorts Noida 9711199171 Greater Noida Escorts Service
Vip Female Escorts Noida 9711199171 Greater Noida Escorts ServiceVip Female Escorts Noida 9711199171 Greater Noida Escorts Service
Vip Female Escorts Noida 9711199171 Greater Noida Escorts Service
 
Lowrate Call Girls In Sector 18 Noida ❤️8860477959 Escorts 100% Genuine Servi...
Lowrate Call Girls In Sector 18 Noida ❤️8860477959 Escorts 100% Genuine Servi...Lowrate Call Girls In Sector 18 Noida ❤️8860477959 Escorts 100% Genuine Servi...
Lowrate Call Girls In Sector 18 Noida ❤️8860477959 Escorts 100% Genuine Servi...
 
Forklift Operations: Safety through Cartoons
Forklift Operations: Safety through CartoonsForklift Operations: Safety through Cartoons
Forklift Operations: Safety through Cartoons
 
Lowrate Call Girls In Laxmi Nagar Delhi ❤️8860477959 Escorts 100% Genuine Ser...
Lowrate Call Girls In Laxmi Nagar Delhi ❤️8860477959 Escorts 100% Genuine Ser...Lowrate Call Girls In Laxmi Nagar Delhi ❤️8860477959 Escorts 100% Genuine Ser...
Lowrate Call Girls In Laxmi Nagar Delhi ❤️8860477959 Escorts 100% Genuine Ser...
 
Progress Report - Oracle Database Analyst Summit
Progress  Report - Oracle Database Analyst SummitProgress  Report - Oracle Database Analyst Summit
Progress Report - Oracle Database Analyst Summit
 
0183760ssssssssssssssssssssssssssss00101011 (27).pdf
0183760ssssssssssssssssssssssssssss00101011 (27).pdf0183760ssssssssssssssssssssssssssss00101011 (27).pdf
0183760ssssssssssssssssssssssssssss00101011 (27).pdf
 
/:Call Girls In Jaypee Siddharth - 5 Star Hotel New Delhi ➥9990211544 Top Esc...
/:Call Girls In Jaypee Siddharth - 5 Star Hotel New Delhi ➥9990211544 Top Esc.../:Call Girls In Jaypee Siddharth - 5 Star Hotel New Delhi ➥9990211544 Top Esc...
/:Call Girls In Jaypee Siddharth - 5 Star Hotel New Delhi ➥9990211544 Top Esc...
 
Monte Carlo simulation : Simulation using MCSM
Monte Carlo simulation : Simulation using MCSMMonte Carlo simulation : Simulation using MCSM
Monte Carlo simulation : Simulation using MCSM
 
Russian Faridabad Call Girls(Badarpur) : ☎ 8168257667, @4999
Russian Faridabad Call Girls(Badarpur) : ☎ 8168257667, @4999Russian Faridabad Call Girls(Badarpur) : ☎ 8168257667, @4999
Russian Faridabad Call Girls(Badarpur) : ☎ 8168257667, @4999
 
BEST Call Girls In Greater Noida ✨ 9773824855 ✨ Escorts Service In Delhi Ncr,
BEST Call Girls In Greater Noida ✨ 9773824855 ✨ Escorts Service In Delhi Ncr,BEST Call Girls In Greater Noida ✨ 9773824855 ✨ Escorts Service In Delhi Ncr,
BEST Call Girls In Greater Noida ✨ 9773824855 ✨ Escorts Service In Delhi Ncr,
 
VIP Call Girl Jamshedpur Aashi 8250192130 Independent Escort Service Jamshedpur
VIP Call Girl Jamshedpur Aashi 8250192130 Independent Escort Service JamshedpurVIP Call Girl Jamshedpur Aashi 8250192130 Independent Escort Service Jamshedpur
VIP Call Girl Jamshedpur Aashi 8250192130 Independent Escort Service Jamshedpur
 
Call Girls Pune Just Call 9907093804 Top Class Call Girl Service Available
Call Girls Pune Just Call 9907093804 Top Class Call Girl Service AvailableCall Girls Pune Just Call 9907093804 Top Class Call Girl Service Available
Call Girls Pune Just Call 9907093804 Top Class Call Girl Service Available
 
2024 Numerator Consumer Study of Cannabis Usage
2024 Numerator Consumer Study of Cannabis Usage2024 Numerator Consumer Study of Cannabis Usage
2024 Numerator Consumer Study of Cannabis Usage
 
Call Girls in Gomti Nagar - 7388211116 - With room Service
Call Girls in Gomti Nagar - 7388211116  - With room ServiceCall Girls in Gomti Nagar - 7388211116  - With room Service
Call Girls in Gomti Nagar - 7388211116 - With room Service
 
Mondelez State of Snacking and Future Trends 2023
Mondelez State of Snacking and Future Trends 2023Mondelez State of Snacking and Future Trends 2023
Mondelez State of Snacking and Future Trends 2023
 
Call Girls In Connaught Place Delhi ❤️88604**77959_Russian 100% Genuine Escor...
Call Girls In Connaught Place Delhi ❤️88604**77959_Russian 100% Genuine Escor...Call Girls In Connaught Place Delhi ❤️88604**77959_Russian 100% Genuine Escor...
Call Girls In Connaught Place Delhi ❤️88604**77959_Russian 100% Genuine Escor...
 
BEST Call Girls In Old Faridabad ✨ 9773824855 ✨ Escorts Service In Delhi Ncr,
BEST Call Girls In Old Faridabad ✨ 9773824855 ✨ Escorts Service In Delhi Ncr,BEST Call Girls In Old Faridabad ✨ 9773824855 ✨ Escorts Service In Delhi Ncr,
BEST Call Girls In Old Faridabad ✨ 9773824855 ✨ Escorts Service In Delhi Ncr,
 
RE Capital's Visionary Leadership under Newman Leech
RE Capital's Visionary Leadership under Newman LeechRE Capital's Visionary Leadership under Newman Leech
RE Capital's Visionary Leadership under Newman Leech
 
VIP Call Girls Pune Kirti 8617697112 Independent Escort Service Pune
VIP Call Girls Pune Kirti 8617697112 Independent Escort Service PuneVIP Call Girls Pune Kirti 8617697112 Independent Escort Service Pune
VIP Call Girls Pune Kirti 8617697112 Independent Escort Service Pune
 

Plehanov university prof mc_donald

  • 1. The Future of Marketing Professor Malcolm McDonald Plekhanov Russian University of Economics 29th March 2012 Page 1
  • 2. Agenda • A very brief history of marketing • What marketers must do to be respected by the board Page 2
  • 3. A VERY BRIEF HISTORY OF MARKETING Page 3
  • 4. 3 Principal Communities in Marketing • Practitioners • Consultants • Academics Page 4
  • 5. Practitioners Page 5
  • 6. • Technology • Production • Sales • Accountancy • Fads • Marketing Page 6
  • 7. CAN YOU SAY WHAT YOUR STRATEGY IS? “Any strategy statement that cannot explain why customers should buy your product or service is doomed to failure” (Collis D, Rukstad M. “Can you say what your strategy is?” HBR April 2008 pp 82-91) Page 7
  • 8. InterTech’s 5 Year Profit Performance Performance (£million) Base Year 1 2 3 4 5 Sales Revenue £254 £293 £318 £387 £431 £454 - Cost of goods sold 135 152 167 201 224 236 Gross Contribution £119 £141 £151 £186 £207 £218 - Manufacturing overhead 48 58 63 82 90 95 - Marketing & Sales 18 23 24 26 27 28 - Research & Development 22 23 23 25 24 24 Net Profit £16 £22 £26 £37 £50 £55 Return on Sales (%) 6.3% 7.5% 8.2% 9.6% 11.6% 12.1% Assets £141 £162 £167 £194 £205 £206 Assets (% of sales) 56% 55% 53% 50% 48% 45% Return on Assets (%) 11.3% 13.5% 15.6% 19.1% 24.4% 26.7% Page 8
  • 9. InterTech’s 5 Year Market-Based Performance Performance (£million) Base Year 1 2 3 4 5 Market Growth 18.3% 23.4% 17.6% 34.4% 24.0% 17.9% InterTech Sales Growth (%) 12.8% 17.4% 11.2% 27.1% 16.5% 10.9% Market Share(%) 20.3% 19.1% 18.4% 17.1% 16.3% 14.9% Customer Retention (%) 88.2% 87.1% 85.0% 82.2% 80.9% 80.0% New Customers (%) 11.7% 12.9% 14.9% 24.1% 22.5% 29.2% % Dissatisfied Customers 13.6% 14.3% 16.1% 17.3% 18.9% 19.6% Relative Product Quality +10% +8% +5% +3% +1% 0% Relative Service Quality +0% +0% -20% -3% -5% -8% Relative New Product Sales +8% +8% +7% +5% +1% -4% Page 9
  • 11. The historic rift between marketers and the finance department, caused by marketing’s reluctance to be accountable for what they do, is as marked as ever. Tense relations “Marketers have between CFOs and constantly hidden behind Marketers are dividing a fog of measurers that boardrooms over the are based purely on value of marketing. tactical marketing One in three CFOs said activity, rather than solid they did not believe financial metrics that are marketing to be relevant to the City” crucial in determining strategy. “Marketing in 3D” Deloitte Page 11
  • 12. The Cultural Web (What senior non marketers believe about marketers) Symbols • Cars • Offices Stories • Terminology Power and Myths • Statistics Structures • Mud doesn’t stick • Lunch • Golden child • Research withheld • Quick promotion • Take credit for • No loyalty others work • Churn Paradigm • Jargon • Costs • Experience • Unaccountable • Untouchable Rituals • Expensive • Slippery Organisational • Planning Structures • Delegating • Lack of • Deadlines structure • Off site Control Systems • Internal focus meetings • Always in • 10.00-16.00 hrs meetings • Lunch • Travel • Soft measurement • For self Source: ‘Defining a Marketing Paradigm’ (Baker, S. Page 12
  • 13. Consultants Page 13
  • 14. FADS (300) • In Search of Excellence • Marketing Warfare • One Minute Manager • MBWA • Skunk Works • 7 Ss • Etc. Page 14
  • 15. Academics Page 15
  • 16. There are many excellent scientific journals devoted to neurosurgery. Month by month, they publish learned papers, each having been subjected to rigorous peer review, that chronicle the latest discoveries, hypotheses, case-studies and innovations in the neurosurgery world. And the shocking thing is this: they are never read by neurosurgeons. Patients are put at risk because of the apparent disdain that the practitioners have for academic theory and the accumulated wisdom of others. You’ll have read the above with growing incredulity. That can’t be true of neurosurgery, you think. And you’re right, thank God. It isn’t true. But in another trade, much closer to home, it very nearly is. Jeremy Bullmore, ‘Bridging the Great Divide, Market Leader, Spring, 2006, page. 14 Page 16
  • 17. The purpose of strategic marketing The overall purpose of strategic marketing and its principal focus is the identification and creation of sustainable competitive advantage © Professor Malcolm McDonald, Cranfield School of Management Page 17
  • 18. Map of the marketing domain Define markets & understand value Monitor Asset Determine value value Base proposition Deliver value Page 18
  • 19. Strategy Ineffective Effective Die Efficient Thrive (quickly) Tactics Die Inefficient Survive (slowly) Page 19
  • 20. Financial Risk and Return High 1 2 Return 3 Low Low High Risk Adapted from Sri Srikanthan, Cranfield School of Management Page 20
  • 21. Key Elements of World Class Marketing 1. A deep understanding of the market place 2. Correct needs-based segmentation and prioritisation 3. Segment-specific propositions 4. Powerful differentiation, positioning and branding 5. Effective strategic marketing planning processes 6. Long-term integrated marketing strategies 7. A deep understanding of the needs of major customers 8. Market/customer-driven organisation structures 9. Professionally-qualified marketing people 10. Institutionalised creativity and innovation Page 21
  • 22. Excellent Strategies Weak Strategies • Target needs based • Target product categories segments • Make similar offers to all • Make a specific offer to each segments segment • Have little understanding of • Leverage their strengths their strengths and and minimise their weaknesses weaknesses • Plan using historical data • Anticipate the future Page 22
  • 23. Differentiation is at the heart of successful marketing “For marketers, differentiation today is more challenging than at any time in history – yet it remains at the heart of successful marketing. More importantly, it remains the key to a company’s survival.” Page 23
  • 24. Justifying investment in marketing assets Whilst accountants do not measure intangible assets, the discrepancy between market and book values shows that investors do. Page 24
  • 25. Intangibles P and G paid £31 billion for Gillette, but bought only £4 billion of tangible assets - Gillette brand £ 4.0 billion - Duracell brand £ 2.5 billion - Oral B £ 2.0 billion - Braun £ 1.5 billion - Retail and supplier network £10.0 billion - Gillette innovative capability £ 7.0 billion TOTAL £27.0 billion (David Haigh, Brand Finance, Marketing Magazine, 1st April 2005) Page 25
  • 26. Balance sheet Assets Liabilities - Land - Shares - Buildings - Loans - Plant - Overdrafts - Vehicles etc. etc. £100 million £100 million © Professor Malcolm McDonald, Cranfield School of Management Page 26
  • 27. Balance sheet Assets Liabilities - Land - Shares - Buildings - Loans - Plant - Overdrafts - Vehicles etc. etc. £100 million £900 million © Professor Malcolm McDonald, Cranfield School of Management Page 27
  • 28. Balance sheet Assets Liabilities - Land - Shares - Buildings - Loans - Plant - Overdrafts - Vehicles etc. Goodwill £800m £900 million £900 million © Professor Malcolm McDonald, Cranfield School of Management Page 28
  • 30. Asset Breakdown for the top 10 countries by Enterprise Value (US$ millions, 2011) Page 30
  • 31. Brands are key intangibles in most businesses Brands are estimated to represent at least 20% of the intangible value of businesses on the major world stock markets. Brands combine with other tangible and intangible assets to create value Developed Markets Brand Brand Marketing intangible 20% Patents Technology intangibles Software Intangible assets Customer relationships Customer intangible Other Intangible Distribution rights Assets Contract intangibles Assembled workforce 55% Business Goodwill Tangible Tangible assets Assets Illustrative 25% Source: Brand Finance Page 31
  • 32. Brands Increasingly Drive Business Results Brands affect business value by influencing the behaviour of a wide range of Shell’s stakeholders, some of which directly impact Shell’s P&L (and hence value) STAKEHOLDER STAKEHOLDER FINANCIAL SHAREHOLDER PERCEPTION BEHAVIOUR IMPACT VALUE • Pay price premium Customers Revenues - individuals, • Buy more businesses Suppliers / • Lower prices Partners • Better terms Costs Brand - businesses, • Willingness to partner Revenues energy asset Trademarks owners •(more opportunities) Employees • Better retention - current and potential Costs • Lower salary expectations Reputatio Shareholders / • Better qualified candidates Productivity n Bankers - individual and institutional • Higher PE ratio Indirect influence Other • Lower volatility Costs Influences Stakeholders Lower borrowing costs on value • Risk business and - government, media, opinion formers, • Better repayment conditions brand value academics, public, environmentalists
  • 33. Map of the marketing domain Define markets Strategic zone & understand where metrics are defined value (Level 1) Asset Determine Monitor value value Base Proposition Measurement zone where metrics are applied Deliver (Levels 2 & 3) value Page 33
  • 34. What is Marketing Due Diligence? Marketing Due Diligence Risk Assessment Market Risk: Strategy risk: Implementation risk: Is the market Will we get our Will we get our there? planned share? planned profit? Page 34
  • 35. Market Risk Profile The marketing strategy has a higher • Product Category Existence probability of success if the product category is well established If the target segment is well • Segment Existence established If the sales volumes are well • Sales Volumes supported by evidence If the forecast growth is in line with • Forecast Growth historical trends If the pricing levels are conservative • Pricing Assumptions relative to current pricing levels Page 35
  • 36. Ansoff matrix PRODUCTS increasing technological newness Present New Present Market Product Penetration Development MARKETS increasing market newness Market New Diversification Extension © Professor Malcolm McDonald, Cranfield School of Management Page 36
  • 37. Market Share Risk Profile The marketing strategy has a higher probability of success if the target is defined in terms of homogeneous segments and is characterised by utilisable data • Target Market Definition If the proposition delivered to each segment is different from that delivered to other segments and addresses the needs which characterised the target segment • Proposition Specification If the strengths and weaknesses of the organisation are independently assessed and the choice of target and proposition leverages strengths and minimises weaknesses • SWOT Alignment If choice of target and proposition is different from that of major competitors • Strategy Uniqueness If changes in the external microenvironment and macroenvironment are identified and • Anticipation of market change their implications allowed for Page 37
  • 38. Listen to how customers talk about category need Customer View Supplier View Advice • cutting costs • fast PAD family • future technology direction • multimedia FRADs Help • PIX firewall • design & configuration • process engineering • Solutions • electron commerce • Gigabit Ethernet Run • solutions • international network • disaster recovery • high performance • LAN support Page 38 Page 38
  • 39. Understand the different category buyers Business Business perfectionist Save my budget Radical thinkers Business Profit engineer general “Reward” “Relief” Radical Save my architect career Technical Conservative idealist technocrat Technical Page 39 Page 39
  • 40. Shareholder Value Risk Profile • Profit Pool The marketing strategy has a higher probability of success if the targeted profit pool is high and growing • Profit Sources If the source of new business is growth in the existing profit pool • Competitor Impact If the profit impact on competitors is small and distributed If the internal gross margin • Internal Gross Margin assumptions are conservative Assumptions relative to current products • Assumptions of Other If assumptions regarding other Costs costs, including marketing support, are higher than existing costs Page 40
  • 41. Map of the marketing domain Define markets Strategic zone & understand where metrics are defined value (Level 1) Asset Determine Monitor value value Base Proposition Measurement zone where metrics are applied Deliver (Levels 2 & 3) value Page 41
  • 42. Overall Marketing Metrics Model Lead indicators Lag indicators Resource Intention/ Plan/ Strategy/ Objectives/ Forecast/ allocation/ actuality action achievement results profit spend PFs budget actions, esp. product corporate Business funds & performance marketing market element time segment HFs £ what who £ what who ms% corporate budget £ sales£ rev£ what who CSFs £ profit£ profit£ what who Measure- application costs, metrics on performance turnover, ment of activity achievement by product profit & spend milestones of factor to market shareholder & outputs required level segment value Positioning of issues in the model Cost to achieve Required by Market growth Responsibilities customers. Customer acquisition/ Relative to retention/ uptrading/ X-selling/ competitors regained Page 42 Product/customer mix
  • 43. Map of the marketing domain Define markets Strategic zone & understand where metrics are defined value (Level 1) Asset Determine Monitor value value Base Proposition Measurement zone where metrics are applied Deliver (Levels 2 & 3) value Page 43
  • 44. Projected cash DCF and NPV flows from methods investing in a implicitly make promotion A this comparison B Companies should be Assumed cash C making this flow resulting comparison from doing More likely nothing cash flow resulting from doing nothing Note: Most executives compare the cash flow from promotion against the default scenario of doing nothing assuming, incorrectly, that the present health of the company will persist indefinitely if the investment is not made. For a better assessment of the promotion’s value, the comparison should be between the projected discounted cash flow and the more likely scenario of a decline in performance in the absence of promotional Figure 10 investment. Adapted from Christensen CM et al, ( 2008 ) 2 + 2 + 2 + 2 = £-0.6 million £ - 7 million + (1+r) (1+r)² (1+r)³ (1+r)4 £ - 1 million + 2 + 2 + 2 + 2 = £5.4 million (1+r) (1+r)² (1+r)³ (1+r)4 Page 44
  • 45. Conditions determining a strong marketing strategy • That the marketing strategy defines real target segments. • That the marketing strategy defines segment-specific value propositions • That the marketing strategy allocates resources differentially by segment or market • That the marketing strategy aligns to the market via SWOT Page 45
  • 46. APPENDIX © Professor Malcolm Page 46 McDonald
  • 47. Valuing Key Market Segments Background/Facts •Risk and return are positively correlated, ie. as risk increases, investors require a higher return. •Risk is measured by the volatility in returns, ie. high risk is the likelihood of either making a very good return or losing all your money. This can be described as the quality of returns. •All assets are defined as having future value to the organisation. Hence assets to be valued include not only tangible assets like plant and machinery, but intangible assets, such as Key Market Segments. •The present value of future cash flows is the most acceptable method to value assets including key market segments. •The present value is increased by: - increasing the future cash flows - making the future cash flows ‘happen’ earlier - reducing the risk in these cash flows, ie. improving the certainty of these cash flows, and, hence, reducing the required rate of return. © Professor Malcolm McDonald Page 47
  • 48. Suggested Approach •Identify your key market segments. It is helpful if they can be classified on a vertical axis (a kind of thermometer) according to their attractiveness to your company. ‘Attractiveness’ usually means the potential of each for growth in your profits over a period of between 3 and 5 years. (See the attached matrix) •Based on your current experience and planning horizon that you are confident with, make a projection of future net free cash in-flows from your segments. It is normal to select a period such as 3 or 5 years. • These calculations will consist of three parts: • revenue forecasts for each year; • cost forecasts for each year; • net free cash flow for each segment for each year. •Identify the key factors that are likely to either increase or decrease these future cash flows. •These factors are likely to be assessed according to the following factors: • the riskiness of the product/market segment relative to its position on the ANSOFF matrix; • the riskiness of the marketing strategies to achieve the revenue and market share; • the riskiness of the forecast profitability (e.g. the cost forecast accuracy ). • Now recalculate the revenues, costs and net free cash flows for each year, having adjusted the figures using the risks (probabilities) from the above. •Ask your accountant to provide you with the overall SBU cost of capital and capital used in the SBU. This will not consist only of tangible assets. Thus, £1,000,000 capital at a required shareholder rate of retur Would give £100,000 as the minimum return necessary. • Deduct the proportional cost of capital from the free cash flow for each segment for each year. • An aggregate positive net present value indicates that you are creating shareholder value – ie. achieving overall returns greater than the weighted average cost of capital, having taken into account the risk associated with future cash flows. Page 48
  • 49. Portfolio analysis - directional policy matrix (DPM) Relative company competitiveness High Low High ? Invest/ build Segment NB. Suggested time period - attractiveness 3 years Maintain Manage for Low No cash change Present position Forecast position in 3 years Page 49 © Professor Malcolm McDonald

Editor's Notes

  1. Strategic Marketing for Directors and Senior Managers
  2. Strategic Marketing for Directors and Senior Managers
  3. From Marketing Strategy to Share Price – by Professor Malcolm McDonald Aston MBA, 6 th October 2009
  4. Tuesday 6 March 2012 Group name goes here
  5. Strategic Marketing for Directors and Senior Managers
  6. Strategic Marketing for Directors and Senior Managers
  7. From Marketing Strategy to Share Price – by Professor Malcolm McDonald Aston MBA, 6 th October 2009
  8. From Marketing Strategy to Share Price – by Professor Malcolm McDonald Henley MBA 16 th April 2010
  9. From Marketing Strategy to Share Price – by Professor Malcolm McDonald Aston MBA, 6 th October 2009
  10. From Marketing Strategy to Share Price – by Professor Malcolm McDonald Aston MBA, 6 th October 2009
  11. From Marketing Strategy to Share Price – by Professor Malcolm McDonald Aston MBA, 6 th October 2009
  12. From Marketing Strategy to Share Price – by Professor Malcolm McDonald Aston MBA, 6 th October 2009
  13. From Marketing Strategy to Share Price – by Professor Malcolm McDonald Aston MBA, 6 th October 2009
  14. From Marketing Strategy to Share Price – by Professor Malcolm McDonald Aston MBA, 6 th October 2009
  15. From Marketing Strategy to Share Price – by Professor Malcolm McDonald Aston MBA, 6 th October 2009
  16. From Marketing Strategy to Share Price – by Professor Malcolm McDonald Aston MBA, 6 th October 2009
  17. From Marketing Strategy to Share Price – by Professor Malcolm McDonald Aston MBA, 6 th October 2009
  18. From Marketing Strategy to Share Price – by Professor Malcolm McDonald Aston MBA, 6 th October 2009
  19. From Marketing Strategy to Share Price – by Professor Malcolm McDonald Henley MBA 16 th April 2010
  20. From Marketing Strategy to Share Price – by Professor Malcolm McDonald Henley MBA 16 th April 2010
  21. From Marketing Strategy to Share Price – by Professor Malcolm McDonald Aston MBA, 6 th October 2009
  22. From Marketing Strategy to Share Price – by Professor Malcolm McDonald Aston MBA, 6 th October 2009
  23. From Marketing Strategy to Share Price – by Professor Malcolm McDonald Aston MBA, 6 th October 2009
  24. From Marketing Strategy to Share Price – by Professor Malcolm McDonald Aston MBA, 6 th October 2009
  25. From Marketing Strategy to Share Price – by Professor Malcolm McDonald Aston MBA, 6 th October 2009
  26. From Marketing Strategy to Share Price – by Professor Malcolm McDonald Aston MBA, 6 th October 2009
  27. From Marketing Strategy to Share Price – by Professor Malcolm McDonald Aston MBA, 6 th October 2009
  28. From Marketing Strategy to Share Price – by Professor Malcolm McDonald Aston MBA, 6 th October 2009
  29. From Marketing Strategy to Share Price – by Professor Malcolm McDonald Aston MBA, 6 th October 2009
  30. From Marketing Strategy to Share Price – by Professor Malcolm McDonald Aston MBA, 6 th October 2009