SlideShare a Scribd company logo
1
.Plant Nutrition
NAME: Jahmol Colbourne
ID#: 80830.
PROGRAM: Bachelor of Science in Agriculture and Entrepreneurship
LECTURER: Dr. Puran Bridgemohan
2
Title
Plant Nutrition - Project Based Learning.
Aim
To use four different nutrient sources to see how they affect the growth, development and
structure of black eye beans (Vigna unguiculata subsp. unguiculata) and corn (Zea Mays
Location of Study
UTT E.C.I.A.F Caroni North Bank Road, Centeno. – E.C.I.A.F Greenhouse.
Period of Study
Monday 26th January, 2020 to Wednesday 25th March.
The project lasted approximately 8 weeks.
Objectives
The main objectives of conducting this laboratory experiment are:
To design an experiment in a controlled environment where different nutrients affect the
growth and development of black eye beans and corn
To recognize mineral deficiency, toxicity, and to show the symptoms/characteristics
3
Introduction
Plant nutrition is the study of the chemical elements and compounds necessary
for plant growth, plant metabolism and their external supply. In its absence the plant is
unable to complete a normal life cycle. The goals of plant nutrition is, to improve the growth
of plants to increase the quality of harvest products, to improve soil fertility, to promote the
recycling of nutrients, to reduce the cost of resources and to minimize fertilization-related
environmental impacts..
Nutrients are essential to all living organisms because it improves the rate of
holistic growth and development of the organism. Plants contain two major forms of
nutrients which are micro-nutrients and macro-nutrients. Micronutrients are essential
elements needed by life in small quantities.
In plant nutrition there are different sources from where plants obtain their
nutrients. One of the main sources of nutrients is the soil. Plants absorb nutrients at the roots
of plants to engage in the process of photosynthesis which takes place in the leaves. Plants
also gets nutrients from its leaves taking in some level of nutrients from the atmosphere, in
addition, liquid fertilizers can be added to the leaves for the leaves absorb nutrients
efficiently and quickly. They also get nutrients from fertilizers both organic and inorganic
which could be in a solid or liquid.. Manure is another source of nutrients in plants as it
contains many trace mineral elements which are essential for the growth and development of
plants.
Nutrient deficiencies are very prevalent in the field of crops and can affect the
growth and development of plants. Very acid or alkaline conditions, dryness and water
logging can all make it difficult for plants to take up soil nutrients.
4
Schedule of Activities - Plant Nutrition Project
Activities
Week After Sowing (WAS)
1 2 3 4 5 6 7 8 9 10 11 12
Sowing
Corn
B.E. Bean
27/01
/20
27/01
/20
14/02/
20
Germination
Corn
B.E. Bean
31/01
/20 07/02
/20 17/02/
20
Soil Sample
(60g of Soil)
12/02/
20
11/03
/20
Growth
Measurement
And Harvest
12/02/
20
19/02/
20
26/02/
20
04/03/
20
11/03
/20
18/03/
20
25/03/
20
01/04/
20
08/04/
20
15/04/
20
N.P.K Fertilizer
Application
(12.24.12 –
1g/pl))
13/02/
20
20/02/
20
27/02/
20
05/03/
20
12/03
/20
19/03/
20
26/03/
20
02/03/
20
09/03/
20
16/04/
20
Foliar Fertilizer
Application
13/02/
20
17/02/
20
20/02/
20
24/02/
20
27/02/
20
02/03/
20
05/03/
20
09/03
/20
12/03
/20
16/03/
20
19/03/
20
23/03/
20
26/03/
20
30/03/
20
02/04/
20
06/04/
20
09/04/
20
13/04/
20
16/04/
20
Insecticide
Application
13/02/
20
27/02/
20
12/03
/20
26/03/
20
09/03/
20
Soil Analysis
Tissue Analysis
Flowering
Corn
B.E. Bean 20/02/
20
Check
Deficiencies,
diseases etc.
13/02/
20
19/02/
20
26/02/
20
04/03/
20
11/03
/20
18/03/
20
25/03/
20
01/04/
20
08/04/
20
15/04/
20
Insecticide
Application
13/02/
20
27/02/
20
12/03
/20
26/03/
20
09/03/
20
5
Schedule of Activities - Plant Nutrition Project
Activities
Week After Sowing (WAS)
1 2 3 4 5 6 7 8 9 10 11 12
Week ending
27/01 07/02 14/02 20/0
2
27/02 05/03 12/0
3
19/0
3
26/0
3
02/0
4
09/0
3
16/0
4
Sowing
Corn
B.E. Bean
←→
←→
Germination
Corn
B.E. Bean
←→
←→
←→
←→
Soil Sample
(60g of Soil)
←→ ←→
Growth
Measurement
And Harvest
←→ ←→ ←→ ←→ ←→ ←→ ←→ ←→ ←→ ←→
N.P.K Fertilizer
Application
←→ ←→ ←→ ←→ ←→ ←→ ←→ ←→ ←→ ←→
Foliar Fertilizer
Application
←→ ←→ ←→
←→
←→
←→
←→
←→
←→
←→
←→
←→
←→
←→
←→
←→
←→
←→
Insecticide
Application
←→ ←→ ←→ ←→ ←→
Soil Analysis
Tissue Analysis
Flowering
Corn
B.E. Bean
←→ ←→ ←→ ←→ ←→ ←→ ←→ ←→ ←→ ←→
Deficiencies,
diseases etc.
←→ ←→ ←→ ←→ ←→ ←→ ←→ ←→ ←→ ←→
Insecticide
Application
←→ ←→ ←→ ←→ ←→
Harvest
6
Experimental Design
This project was conducted during the period January to March, 2020 as part of
the learning outcomes in the Course – Plant nutrition. It done under greenhouse conditions to
study the effects on the growth rate of two different types of crops based on different nutrient
sources in a semi-controlled environment. The establishment and management of the
experiment were done by the students under the supervisions of the Instructor.
The laboratory experiment has 3 parts, crop agronomy, crop growth analysis [tissue analysis]
and nutrient assessment [soil analysis].
Crops
The crops selected were corn (Zea mays) which is a cereal crop of the grass family, and black
eye beans (Vigna unguiculata subsp. unguiculata) is a leguminous crop which is edible and
can be used for many purposes in the world. The crop was sown in potting bags filled with 2l
of soil [Piarco Fine Sand], which was sieved and free of debris.
Sources of Nutrients
In this experiment there were 4 different nutrient sources, which included:
i. Foliar fertilizer [ nutrex -20:20:20:2: TE 1:1 every 2 week for 3 days]
ii. Inorganic fertilizer [ 1:1 ratio manure]
iii. Granular [12:24:12).
iv. Control [soil] – No fertilizer.
Experimental design
The experimental was laid out as a randomized block design [RBD].
- Crops: 2
- Amount of Nutrient Sources: 4
- Blocks: 3
- Replication: 10
7
Black eyedBeans (Vigna unguiculata subsp. unguiculata)
4 treatments x 10 plants x 3 repetitions = 120 plants.
- Total amount of plants used in the study = 120 plants + 120 plants = 240 plants.
- There were 10 plants per treatment.
- No of pots required = 240 pots.
Corn (Zea mays)
4 treatments x 10 plants x 3 repetitions = 120 plants.
- Total amount of plants used in the study = 120 plants + 120 plants = 240 plants.
- There were 10 plants per treatment.
- No of pots required = 240 pots.
Observations
Figure 1: Yellow Streaking: Nitrogen Deficiency.
Figure 2: Burnt discolouration at the tip of the leaf apex: Potassium Deficiency.
8
Figure 3: Showing the leaf miner attacking the black eye plant.
Method Used for Soil and Tissue Analysis
Tissue Analysis: On a weekly basis, every seven days destructive analysis was conducted for
the both crops the corn and the black eyes beans. The crops were removed from their bags in
the greenhouse and the soil and particulate matter were washed off from the root of the plant
carefully to prevent damage to the roots and plant. The plants were then taken to the lab to be
analyzed to obtain data.
Soil Analysis: 100g of growth media was taken from each treatment. The soil samples were
taken randomly from different plants in the greenhouse throughout the experiment. The
initial batch of soil samples were taken because the plants were fertilized. The main aim for
testing the soil used is to determine the quantity of nitrogen, potassium and phosphorous that
the soil contains.
Data Analysis
During this lab experiment the students engaging in this project conducted
mathematical growth analysis on the corn plants and the black eye plants. Plant growth
analysis refers to a set of concepts and equations by which changes in size of plants over time
can be summarised and dissected in component variables. It is often applied in
the analysis of growth of individual plants, but can also be used in a situation where
crop growth is followed over time.
9
Plant growth parameters include involves both the cell division and enlargement.
The plant growth can be visualized in terms of increase in length or plant height, stem
diameter, volume of tissue, increase in cell numbers, increase in fresh weight and dry weight,
increase in leaf area and leaf weight.
At the ending of this laboratory experiment the data will be analyzed, documented and
presented using graphs and tables.
Layout of Experiment
Key:
X – CORN PLANTS: O – BLACK EYE BEANS PLANTS
TREATMENTS
1 2 3 4
Foliar fertilizers GRANULAR
FERTILIZER
MANURE CONTROL
X O X O X O X O
X O X O X O X O
X O X O X O X O
X O X O X O X O
X O X O X O X O
X O X O X O X O
X O X O X O X O
X O X O X O X O
X O X O X O X O
X O X O X O X O
X O X O X O X O
X O X O X O X O
X O X O X O X O
X O X O X O X O
X O X O X O X O
X O X O X O X O
X O X O X O X O
X O X O X O X O
X O X O X O X O
X O X O X O X O
X O X O X O X O
X O X O X O X O
X O X O X O X O
X O X O X O X O
X O X O X O X O
X O X O X O X O
10
X O X O X O X O
X O X O X O X O
X O X O X O X O
Plants were placed 1 ft intra-row and inter-row with a boundary row round the entire plot. Treatments
were separated by 3ft and the foliar treatment was placed downwind to avoid spray drift onto other
treatments.
CROP RESPONSE DATA WEEKLYSHEET Week ending ………………..
TREATMENTS DATE SHOOT
LENGHT
LEAF
LENGTH
ROOT
LENGTH
LEAF
WEIGHT
LEAF
AREA
ROOT
WEIGHT
FOLIAR
FERTILZER X
FOLIAR
FERTILZER O
GRANULAR
FERTILIZER X
GRANULAR
FERTILIZR O
MANURE X
MANURE O
CONTROL X
11
CONTROL O
MEAN
SE
Material and Methods
This Study was conducted the period Jan to April, 2020. It was conducted in a
greenhouse under semi-protected conditions. The test crops were a legume and a grass cereal.
Zea mays (corn) and Vigna unguiculata (Black Eye Beans) were pre-conditioned by
soaking overnight before sowing in 240 ml black medium sized potting bags. The bags were
filled with different planting media according to the planned treatments and were placed in a
shade house and spaced out 30 cm apart. In addition, a guard row was formed around the
perimeter of the experimental specimens to protect them from pests.
Treatments
There were to be 4 treatments total, consisting of 30 plants per treatment and this would be
done for both crops, leading to a total amount of 240 plants (120 Corn and 120 Beans).
Table 1: Showing the different treatments used in the experiment together with crucial
characteristics of the fertilizer treatment regime.
Treatment
Number
Treatment Description
1 control  soil only,
 no fertilizer
 provided with only the necessary
amount of water
2 Rotted cow manure  manure treatment
 filled with a 1:1 ratio of soil and cow
manure, this treatment was also manure
treatment
 was the not given any additional fertilizer
aside from the initial manure
12
3 foliar fertilizer  foliar fertilizer
 20:20:20 foliar fertilizer at a rate of
0.25g/plant every 2 days for the first 3
weeks after germination
 switched to a rate of 1g/plant every 2
days
4 granular fertilizer  12:24:12 granular fertilizer at a rate of
1g/plant once a week until flowering.
.
All of the plants were treated with Caprid insecticide every 7 days at the labelled rate to
protect them from pests.
Observations
Tissue Analysis
Growth parameters being measured to determine growth and development were soil
analysis of NPK (Nitrogen, Phosphorous, Potassium), tissue analysis of NPK, dry matter
content, number of leaves, number of flowers (if any), number of fruits (if any), surface area
of the leaves, plant height and root length.
Destructive analysis was conducted on a weekly basis (every 7 days) for 5 weeks for
both crops. The crops were removed from their bags and the soil and organic matter were
gently washed off, taking care not to destroy any of the roots. The samples were moved to a
lab and data was taken accordingly.
i. The number of leaves, fruits and flowers were counted and the area of each individual
leaf was taken using graph paper to calculate the area.
ii. The plant height and root length were taken using a meter rule.
iii. Weight of the leaves, root and shoot were taken individually and were then labelled
according to treatment and crop and placed to dry in a convection oven for 72 °C for
3 days or until constant weight, after which the dry weight was taken using an
analytical balance.
13
Soil Analysis
For the soil analysis, 100g of growth media was taken from each treatment. The
samples were taken randomly from different plants within the treatments. The first batch of
samples was taken before the application of fertilizers to the crops. These samples were taken
to the lab and tested for Nitrogen (N), Phosphorous (P) and Potassium (K) content.
i. Nitrogen was determined using the Kjeldah lmethod (Motsara et al 2008),
ii. Phosphorous and potassium was determined using atomic absorption spectroscopy
(Perkin Elmer Corp 1996).
iii. A post fertilization analysis would have also been done on the soil samples 1 week
after fertilizer application using the same procedure to determine N, P and K.
iv. Similarly, a tissue analysis was also during destructive analysis to determine the
amounts of N, P and K using the same procedures as would have been used for the
soil analysis.
Kjeldahl Method.
a. Finely ground the sample and thoroughly mix.
b. Weigh 1 g of sample. Place in a Kjeldahl flask.
c. Add 0.7 g of copper sulphate, 1.5 g of K2SO4 and 30 ml of H2SO4.
d. Heat gently until frothing ceases. If necessary, add a small amount of paraffin or glass
beads to reduce frothing.
e. Boil briskly until the solution is clear and then continue digestion for at least 30
minutes.
f. Remove the flask from the heater and cool, add 50 ml of water, and transfer to a
distilling flask.
g. Place accurately 20–25 ml of standard acid (0.1M HCl or 0.05M H2SO4) in the
receiving conical flask so that there will be an excess of at least 5 ml of the acid. Add
2–3 drops of methyl red indicator. Add enough water to cover the end of the
condenser outlet tubes.
h. Run tap-water through the condenser.
14
i. Add 30 ml of 35-percent NaOH in the distilling flask in such a way that the contents
do not mix.
j. Heat the contents to distil the ammonia for about 30–40 minutes.
k. Remove the receiving flask and rinse the outlet tube into the receiving flask with a
small amount of distilled water.
l. Titrate excess acid in the distillate with 0.1M NaOH.
m. Determine blank on reagents using the same quantity of standard acid in a receiving
conical flask.
The calculation is:
1.401 [(V1 M1 - V2M 2) - (V3M 1 - V4M 2)]
Percent N = ———————————————————— × df
W
Where:
V1 – millilitres of standard acid put in receiving flask for samples;
V2 – millilitres of standard NaOH used in titration;
V3 – millilitres of standard acid put in receiving flask for blank;
V4 – millilitres of standard NaOH used in titrating blank;
M1 – molarity of standard acid;
M2 – molarity of standard NaOH;
W – Weight of sample taken (1g);
df – dilution factor of sample (if 1 g was taken for estimation, the dilution
factor will be 100).
15
Atomic Absorption
1. Finely ground the sample and thoroughly mix.
2. Measure 5.0g of sample.
3. Sieve sample into an Erlenmeyer flask
4. Add 20ml of extracting solution (0.05N HCL + 0.025N H2SO4)
5. Place in a mechanical shaker for 15 minutes.
6. Filter through Whatman #42 filter paper into a 50ml volumetric flask
7. Dilute to 50 ml with extracting solution
8. Determine concentration of element of interest using Standard Conditions and
Characteristic Concentration Checks for Atomic Absorption.
Results/Data Presentation
Table 1: Showing the data obtained for the corn plants and black eye bean plants under the
control treatment for the first week. (Week 1)
CONTROL
Zea mays (Corn) Vigna unguiculata (Black
Eye Beans)
P1 P2 P3 P1 P2 P3
Leaf Number 6 6 6 16 17 17
Leaf Fresh Weight - - - 11.4 13.4 1.7
Leaf Area 584.5 729 770 126 180 292
Leaf Dry Weight - - - - - -
Root Length 38 45 41 24.3 9.2 9.9
Root Fresh Weight 8.78 9.63 9.42 1.34 1.9 1
Root Dry Weight - - - - - -
Shoot Length 65 68.5 64.5 38 40.3 36
Stem Fresh weight - - - 6.5 7.4 6.4
Stem Dry weight - - - - - -
Number of pods - - - - - -
Pod Fresh wt - - - - - -
Pod dry wt - - - - -
16
Table 2: Showing the Data obtained for the corn plants and black eye bean plants under the
foliar treatment for the first week.
FOLIAR
Zea mays Vigna unguiculata
P1 P2 P3 P1 P2 P3
Leaf
number
6 5 26 17 14 23
Leaf fresh weight - - 13.29 17.13 9.15 24.5
Leaf Area 580 412 748 941.11 532.2 1432.14
Leaf dry weight - - - - - -
Root length 38.5 44 28 13.5 9.5 11.5
Root Fresh Weight 2.91 10.03 4.23 2.98 0.94 4.26
Root Dry weight - - - - - -
Shoot length 68 79 53 53 36 56.7
Stem fresh weight - - 10.14 8.16 3.86 14.57
Stem dry weight - - - - - -
Number of pods - - 5 - - -
Pod Fresh Weight - - 1.15 - - -
Pod dry Weight - - - - - -
Table 3: Showing the Data Obtained for the corn plants and black eye bean plants under the
manure treatment for the first week of the experiment.
MANURE
Zea mays Vigna unguiculata
P1 P2 P3 P1 P2 P3
Leaf no. 6 7 6 27 17 16
Leaf fresh weight - - - 19.1 8.7 10.3
Leaf Area 1044.5 858 607 1292.99 537.95 722.92
Leaf dry weight - - - - - -
Root length 40.5 49.5 42 19 15.5 9.5
Root Fresh Weight 4.21 7.24 7.42 2.3 0.9 1
Root dry Weight - - - - - -
Shoot Length 68 73 78.5 51 31.5 42
Stem fresh Weight - - - 16.8 4.7 7.3
Stem Dry Weight - - - - - -
Number of pods - - - - - -
Pod Fresh Weight - - - - - -
Pod dry Weight - - - - - -
17
Table 4: Showing the Data Obtained for the corn plants and black eye bean plants under the
granular treatment for the first week of the experiment.
GRANULAR
Zea mays Vigna unguiculata
P1 P2 P3 P1 P2 P3
Leaf no. 6 5 6 16 18 17
Leaf fresh Weight - - - 10.68 15.04 5.73
Leaf Area 436 462.5 457.5 404 648 288
Leaf dry Weight - - - - - -
Root length 40 37 48 12 16.5 12.5
Root Fresh Weight 25.23 2.94 4.15 3.37 3.03 87
Root dry Weight - - - - - -
Shoot Length 57 65 65 33 37.2 38.5
Stem fresh Weight - - - 4.57 9.22 3.17
Stem dry Weight - - - - - -
Number of pods - - - - - -
Pod Fresh Weight - - - - - -
Pod dry Weight - - - - - -
Table 5: Showing the data obtained for the corn plants and black eye bean plants under the
control treatment for the second week.
Control Zea Mays
P1 P2 P3
Leaf no. 6 6 6
Leaf fresh weight - - -
Leaf Area 584.5 792 770
Leaf dry weight - -
Root length 38 45 47
Root Fresh wt 8.78 9.63 9.42
Root dry weight - - -
Shoot length 65 68.5 64.5
Stem fresh weight - - -
Stem dry weight - - -
Number of pods - - -
Pod Fresh wt - - -
Pod dry wt - - -
18
Table 6: Showing the Data obtained for the corn plants and black eye bean plants under the
foliar treatment for the second week.
Zea mays
P1 P2 P3
Leaf no. 6 5 6
Leaf fresh weight - - -
Leaf Area 600 500 512
Leaf dry weight 5.42 5.14 5.2
Root length 38.5 44 46
Root Fresh wt 2.91 10.03 8.21
Root dry weight 3.07 2.44 3.66
Shoot length 68 79 80
Stem fresh weight - - -
Stem dry weight 4.15 3.19 4.02
Number of pods - - -
Pod Fresh wt - - -
Pod dry wt - - -
Table 7: Showing the Data Obtained for the corn plants and black eye bean plants under the
manure treatment for the second week of the experiment.
Zea mays
P1 P2 P3
Leaf no. 6 7 6
Leaf fresh weight - - -
Leaf Area 1044.5 858 607
Leaf dry weight 5.26 8.28 8.26
Root length 40.5 49.5 42
Root Fresh wt 4.21 7.24 7.42
Root dry weight 2.44 5.36 7.58
Shoot length 68 73 78.5
Stem fresh weight - - -
Stem dry weight 3.14 5.99 7.56
Number of pods - - -
Pod Fresh wt - - -
Pod dry wt - - -
19
Table 8: Showing the Data Obtained for the corn plants and black eye bean plants under the
granular treatment for the second week of the experiment.
GRANULAR
Zea mays Vigna unguiculata
P1 P2 P3 P1 P2 P3
Leaf no. 7 9 9 11 11 11
Leaf fresh weight - - - 8.65 6.79 8.35
Leaf Area 916.45 897.15 874.37 392 360 412
Leaf dry weight 6.61 3.29 4.87 1.22 1.04 1.21
Root length 26 37.3 33.5 32 19 28
Root Fresh wt 6.71 8.79 9.81 3.84 2.06 3.17
Root dry weight 4.54 2.54 3.97 0.31 0.26 0.72
Shoot length 87.5 92.2 85.6 60 51 57
Stem fresh weight - - - 3.77 3.51 3.35
Stem dry weight 4.17 2.56 4.18 0.41 0.45 0.49
Number of pods - - - - - -
Pod Fresh wt - - - - - -
Pod dry wt - - - - - -
Table 9: Showing the data obtained for the corn plants and black eye bean plants under the
control treatment for the third week.
CONTROL
Zea mays
P1 P2 P3
Leaf no. 5 6 5
Leaf fresh weight - - -
Leaf Area 635 257.5 462.5
Leaf dry weight - - -
Root length 44 48 40
Root Fresh wt 16.5 4.3 4.3
Root dry weight - - -
Shoot length 87.4 64.6 73
Stem fresh weight - - -
Stem dry weight - - -
Number of pods - - -
Pod Fresh wt - - -
20
Table 10: Showing the Data obtained for the corn plants and black eye bean plants under the
foliar treatment for the third week.
FOLIAR
Zea mays
P1 P2 P3
Leaf no. 8 6 8
Leaf fresh weight - - -
Leaf Area 1086.88 425.69 1221.78
Leaf dry weight - - -
Root length 43.4 41.3 38.9
Root Fresh wt 14.3 2.8 19.1
Root dry weight - - -
Shoot length 99.5 74.2 101
Stem fresh weight - - -
Stem dry weight - - -
Number of pods - - -
Pod Fresh wt - - -
Pod dry wt - - -
Table 11: Showing the Data Obtained for the corn plants and black eye bean plants under the
manure treatment for the third week of the experiment.
MANURE
Zea mays
P1 P2 P3
Leaf no. 9 8 6
Leaf fresh weight - - -
Leaf Area 1989.88 1199..03 963.95
Leaf dry weight - - -
Root length 40.2 34.5 30.3
Root Fresh wt 52.5 40.4 21
Root dry weight - - -
Shoot length 105.8 108.5 95
Stem fresh weight - - -
Stem dry weight - - -
Number of pods - - -
Pod Fresh wt - - -
Pod dry wt - - -
21
Table 12: Showing the Data Obtained for the corn plants and black eye bean plants under the
granular treatment for the third week of the experiment.
GRANULAR
Zea mays
P1 P2 P3
Leaf no. 7 9 9
Leaf fresh weight - - -
Leaf Area 96.45 8997.15 874.37
Leaf dry weight - - -
Root length 26 37.3 33.5
Root Fresh wt 6.7 8.7 9.8
Root dry weight - - -
Shoot length 87.5 92.2 85.6
Stem fresh weight - - -
Stem dry weight - - -
Number of pods - - -
Pod Fresh Weight - - -
Pod dry Weight - - -
22
Discussion
A fertilizer is defined as a chemical or natural substance added to the soil or
land to increase its fertility. In this nutrition study the agriculturalist determined the impact of
four different types of fertilizer treatments on the growth and development of the corn plants
and black eyed beans plants. The four different fertilizer treatment include, control (no
fertilizer), foliar, manure and granular. A control fertilizer is defined as one which is
gradually introduced into the soil at specific periods of time. A foliar fertilizer is a fertilizer
product that is applied directly to the leaves of the plant. In foliar fertilizers the plants are
able to absorb basic micro-nutrients and macro-nutrients through the leaf system. Foliar
fertilizers usually take a short amount of time to enter the system of the plant. Manure is
organic matter that is used as a major organic fertilizer in agriculture. Manure contains basic
nutrients which are essential for growth and development of the plants and also influences
the yield produced. Granular fertilizer is a dry fertilizer which is in the form of a pellet.
Granular fertilizers are added to the soil around the area of the root zone. A granular fertilizer
can either be natural or synthetic in form.
It is important to find out the number of leaves on a plant to verify the increase
in growth rate and also the number of leaves on a plant increase the amount of light absorbed
together with the increase absorption of carbon dioxide to assist in photosynthesis. The leaf
weight increases the accuracy of the net assimilation rate. The leaf area is very important
because it is a measure of the photosynthetic active area, and at the same time of
the area subjected to transpiration. Leaf dry rate allows the nutritionist to understand the
percentage of the leaf which is dry matter and the percentage of the leaf which is moisture
(H20). Root length is a controlling variable for water absorption and nutrient intake in the
plant. Root dry weight is a measurement parameter by which plant growth is determined. The
more roots in the plant there is an increase in the rate of photosynthesis. The shoot length is
relatively important in as it determines the growth rate of plants and proves as evidence for
the growth of the xylem and phloem vessels. Shoot fresh weight is defined as the weight of
the shoot of them time directly after harvest.
In table 1, the data obtained was for the fertilizer treatment control of the both
crops Zea mays (Corn) and Black eyed beans (Vigna unguiculata). Three plants each were
23
selected at random from the two different species of crops. Each of the plants was analyzed
in terms of tissue growth, crop production and the availability of nutrient deficiencies. The
mean number of leaves in the corn was 6. The number of leaves in the plant increases the rate
of photosynthesis as the increase in the amount of leaves will result in more carbon dioxide
and sunlight being absorbed by the leaves. The number of leaves in the plant also affects the
transpiration and the amount of water lost from the plant. The mean number of leaves for the
black eyed beans was 16.7. In leguminous crops such as the black eyes bean plants there are
compound leaves and there are leaflets. The amount of leaves on a plant influences the
surface area of plants leading to the increase of gas exchange in the process of
photosynthesis. Carbon dioxide is absorbed by the plant for photosynthesis and oxygen is
given off as a by-product of photosynthesis.
The leaf fresh weight for the black eyed bean plants is a parameter of growth in
the tissue and the holistic development of the plant. The mean leaf fresh weight for the black
eye plants was 8.8. The leaf fresh weight is determined directly after harvest when the plant
is still fresh. The fresh weight of a leaf contains both dry matter and moisture and the dry
weight of the leaf contains only the dry matter percentage. The higher the leaf fresh weight
the more nutrients and water the leaf contains. The lower the leaf fresh weight the less
nutrients and water the leaf contains.
The leaf area of a plant measures the relationship between the plant and the
environment and determines the growth of the plant tissue. The mean leaf area for the corn
plants was 694.5. The mean leaf area for the black eye bean plants was 199.3.
Most leaves are broad and so have a large surface area allowing them to absorb more light. A
thin shape means a short distance for carbon dioxide to diffuse in and oxygen to diffuse out
easily. The smaller the leaf surface area the fewer amounts of carbon dioxide and water is
absorbed thus affecting the chemical and biological processes within the plant. The plant
microbial processes as a result of the small surface area as microbes may not be able to
maintain and sustain life due to a lack of basic nutrients to conduct daily activities.
The root length in all plants and trees determine the amount of water and
nutrients that are absorbed by the root hairs to assist in the chemical processes within the
plant. The mean root length corn was 41.3. The root length the black eye bean plants was
24
14.5. Root length is a variable in plant nutrition that is used to determine nutrient intake and
water uptake. The longer the root of the plant there is an increase in root density. Root
density is defined as the soil substrata explored by the root system of the plant.
The root fresh weight is provided directly after the harvest of plants from the
greenhouse. The mean root fresh weight for the corn was 9.28. The mean root fresh weight
for the black eye bean plants was 1.41. The fresh weight of the root determines the total root
mass that goes through the soil structure. The fresh weight of the root determines the
moisture together with the dry matter from the root. The heavier the fresh weight of the root
is the higher the water content and dry matter will be.
The shoot length is a parameter which describes the growth and development of
plants which were used in the experiment. The mean shoot length for the corn was 66. The
mean shoot length for the black eye bean plants was 38.1.The increase in shoot length in the
incidence of the corn showed that growth and development was taking place in the corn
plants over the period of treatment for week 1. The increase in shoot length for the black eye
bean plants showed that growth was taking place in the plant which also increased the rate of
photosynthesis.
The stem fresh weight is determined in the lab was obtained by the weight of
stem directly after harvesting from the greenhouse. Directly after the harvesting of the black
eye bean plants from the greenhouse the fresh stem weights were taken. The heavier the stem
is the more water and dry matter it contains. The lighter the stem is the less water and dry
matter it contains. The mean stem fresh weight for the black eye bean plants was 6.8. The
stem fresh weight for plant 2 of the black eye bean plants was 7.4. The stem fresh weight for
plant 3 of the black eye bean plants was 6.4
In table 2, the data recorded is due to the growth and development of the corn
and black eye bean plants under the foliar treatment in week 1. Three samples from each
species of plants were collected in the greenhouse. The mean number of leaves collected for
the corn was 6.3. The mean number of leaves collected for the black eye bean plants was 18.
The fresh weight of the leaves contain both moisture and dry matter. The
heavier the weight of the leaf the more moisture and dry matter the leaf contains. The lighter
25
the weight of the leaf the less moisture and dry matter the leaf contains. The leaf weight also
affects the surface area which affects the exchange of gases in the atmosphere. The mean leaf
fresh weight for the black eye bean plants was 16.92.
Leaf area index is the total one‐ sided area of leaf tissue per unit ground surface
area. Leaf area affects the exchange of gases in the atmosphere and also contributes to the
amount of water lost from the leaves of the plants through the process of transpiration. The
mean leaf area for the corn plants was 497.3. The mean leaf area the black eye bean plants
was 968.48.
The mean root length for the corn plant was 42.8. The mean root length for the
black eye bean plants was 11.5.
The mean root fresh weight for the corn plants was 7.05. The mean root fresh
weight for the black eye bean plants was 2.72.
The increase in the shoot length of the plant shows that growth and
development is taking place in the structure of the plant. The mean shoot length for the corn
plants was 75.7. The mean shoot length for the black eye plants was 48.6. The mean stem
fresh weight for the black eye plants was 8.86.
In table 3, the data obtained was for the impact of the manure treatment on
the growth and development of corn and black eye bean crops. The amount of leaves
influences the surface area of the plant. The mean amount of leaves for the corn plants was
6.3. The mean number of leaves for the black eye beans plants was 20.
The mean leaf fresh weight for the black eye bean plants was 12.7. Leaf area affects
the overall absorption of the basic nutrients in the plants. The mean leaf area for the corn
plants was 836.5. The mean leaf area for black eye bean plants was 851.3.
The root length may have elementary branches known as root hairs which increase
rooting density across the soil. The mean root length for the corn plants is 44. The mean root
length for the black eye bean plants is 14.7.
The mean root fresh weight for the corn plants is 6.29. The mean root fresh weight
for the black eye bean plants is 1.4.
26
The mean shoot length for the corn plants is 73.16. The mean shoot length for the
black eye bean plants is 41.5.
The moisture and dry matter will affect the weight of the plants and also the general
characteristic rate at which photosynthesis occurs in the plant. The mean stem fresh weight
for the black eye bean plants is 9.6.
In table 4, the data was obtained based on the evidence of growth and development
of the corn and black eye plants in the granular treatment. Three corn plants were chosen at
random to assist in the destructive analysis process. Three black eye bean plants were chosen
at random to assist in the destructive analysis process. The number of leaves for plant 1 in the
corn plants is 6. The number of leaves for plant 2 in the corn plants is 5. The number of
leaves for plant 3 in the corn plants is 6. The number of leaves for plant 1 in the black eye
bean plants is 16. The number of leaves for plant 2 in the black eye bean plants is 18. The
number of leaves for plant 3 in the black eye bean plants is 17.
Leaf dry mass per unit area is considered to represent the photosynthetic capacity,
which actually implies a hypothesis that foliar water mass (leaf fresh weight minus leaf dry
weight) is proportional to leaf dry weight during leaf growth. The leaf fresh weight for plant
1 in the black eye bean plants is 10.68. The leaf fresh weight for plant 2 in the black eye bean
plants is 15.04. The leaf fresh weight for plant 2 for the black eye bean plants is 5.73.
The larger the leaf is the chlorophyll will absorb sunlight and speed up the rate of
photosynthesis. The leaf area for plant 1 in the corn plants is 436. The leaf area for plant 2 in
the corn plants is 462.5. The leaf area for plant 3 in the corn plants is 457.5. The leaf area for
plant 1 in the black eye plants is 404. The leaf area for plant 2 in the black eye plants is 648.
The leaf area for plant 3 in the black eye plants is 288.
The root length of the plant increases the root area in the ground increasing the
process of physical, chemical and biological weathering in the soil. The root length also
increases the high incidence of microbial activity in the soil. The more microbes there are in
the soil, the higher the soil fertility is. The root length for plant 1 in the corn plants is 40. The
root length for plant 2 in the corn plants is 37. The root length for plant 3 in the corn plants is
48. The root length for plant 1 in the black eye bean plants is 12. The root length for plant 2
27
in the black eye bean plants is 16.5. The root length for plant 3 in the black eye bean plant is
12.5.
The weight of the roots as it now comes out of the soil is referred to as the root fresh
weight. The fresh weight of the root contains moisture together with dry matter in the plant
itself. The root fresh weight for plant 1 in the corn plants is 25.23. The root fresh weight for
plant 2 in the corn plants is 2.94. The root fresh weight for plant 3 in the corn plants is 4.15.
The root fresh weight for plant 1 in the black eye bean plants is 3.37. The root fresh weight
for plant 2 in the black eye plants is 3.03. The root fresh weight for plant 3 in the black eye
plants is 87.
The shoot and the root of the plant play a major role in the surface area of the plant
and the amount of nutrients that is absorbed by the plant. The shoot length for plant 1 in the
corn plants is 57. The shoot length for plant 2 in the corn plants is 65. The shoot length for
plant 3 in the corn plants is 65. The shoot length for plant 1 in the black eye bean plants is 33.
The shoot length for plant 2 in the black eye bean plants is 37.2. The shoot length for plant 3
in the black eye bean plants is 38.5.
The stem fresh weight for plant 1 in the black eye beans plant is 4.57. The stem fresh
weight for plant 2 in the black eye beans plant is 9.22. The stem weight for plant 3 in the
black eye beans plant is 3.17.
In table 5, the data was recorded for the growth and development of corn and black
eye beans plants over the second week of study in the control fertilizer treatment. The
destructive analysis was conducted every 7 days (1 week) to determine the growth and
progress of the plants. The amount of leaves for plant 1 in the corn plants is 6. The amount of
leaves for plant 2 in the corn plants is 6. The amount of leaves for plant 3 in the corn plants is
6. The leaf area for a plant can increase stomata activity depending on its size. The leaf area
has a major role to play in the surface area of plants which can affect the processes of
evaporation and transpiration. The leaf area for plant 1 of the corn plants is 584.5. The leaf
area for plant 2 of the corn plants is 792. The leaf area for plant 3 of the corn plants is 770.
. Fibrous roots hold more water and tap roots are used to prevent soil erosion as they
are deep anchor roots that burrow deep into the ground. The root length for plant 1 of the
28
corn plants is 38. The root length for plant 2 of the corn plants is 45. The root length for plant
3 of the corn plant is 47. The root fresh weight is determined when the plant is now harvested
and the roots are dissected during destructive analysis. The root fresh weight for plant 1 of
the corn plants is 8.78. The root fresh weight for plant 2 of the corn plant is 9.63. The root
fresh weight for plant 3 of the corn plant is 9.42. The shoot length of a plant is a parameter
which shows that growth is taking place. An increase in size of the shoot shows growth of
tissue. The shoot length for plant 1 of the corn plant is 65. The shoot length for plant 2 of the
corn plant is 68.5. The shoot length for plant 3 of the corn plants is 64.5.
In table 6, the data collected by based on growth and development parameters of corn
and black eye plants in the foliar treatment. The growth of leaves in the presence of foliar
fertilizers will be increased. Nitrogen is an essential nutrient in the structure of the leaf. The
number of leaves for plant 1 of the corn plants is 6. The number of leaves for plant 2 of the
corn plants is 5. The number of leaves for plant 3 of the corn plant is 6. The leaf area of a
plant studies the relationship between the plant and environmental changes. Leaf area
optimizes yields in changing climates. The leaf area for plant 1 of the corn plants is 600. The
leaf area for plant 2 of the corn plants is 500. The leaf area for plant 3 of the corn plants is
512.
The leaf dry weight of a plant is the full dry matter content without the moisture in
the leaves. The leaves were dried in the oven to remove the excess water from the leaf
surface. The leaf dry weight for plant 1 of the corn plants is 5.42. The leaf dry weight for
plant 2 of the corn plants is 5.14. The leaf dry weight for plant 3 of the corn plants is 5.2. The
root length of a plant increases the root density of root mass in the soil. The root mass and
structure also improves the soil structure and prevents soil erosion. The root length for plant
1 of the corn plants is 38.5. The root length for plant 2 of the corn plants is 44. The root
length for plant 3 of the corn plants is 46.
Length of a plant is an indicator of the growth and development of a plant. In increase
in shoot length there is an increase in the meristematic tissue in the plant increasing
elongation. The shoot length for plant 1 of the corn plants is 68. The shoot length for plant 2
of the corn plants is 79. The shoot length for plant 3 of the corn plants is 80. The stem dry
weight of a plant is the mass of the stem after moisture extraction in the furnace. The dry
29
weight of a stem shows evidence of growth and development. The stem dry weight of a plant
1 of the corn plants is 4.15. The stem dry weight of a plant 2 of the corn plants is 3.19. The
stem dry weight for plant 3 of the corn plants is 4.02.
In table 7 the data obtained was for the growth of development of corn plants and
black eye bean plants under the manure treatment in the greenhouse. Plants grow better in the
manure treatment because manure contains basic micro-nutrients and macro-nutrients that the
plants need to conduct daily chemical activities. The number of leaves on plant 1 for the corn
plants is 6. The number of leaves for plant 2 of the corn plants is 7. The number of leaves for
plant 3 of the corn plants is 6.
The leaf area of plant 1 of the corn plants is 1044.5. The leaf area of plant 2 for the
corn plants is 858. The leaf area of plant 3 of the corn plants is 607. The leaf dry weight of
plant 1 of the corn plants is 5.26. The leaf dry weight for plant 2 of the corn plants is 8.28.
The leaf dry weight for plant 3 of the corn plants is 8.26.
The root length for plant 1 of the corn plants is 40.5. The root length for plant 2 of the
corn plant is 49.5. The root length for plant 3 of the corn plant is 42. The root fresh weight
varies greatly depending on the temperature of the environment, the water availability and
type of soil. The root fresh weight for plant 1 of the corn plants is 4.21. The root fresh weight
for plant 2 of the corn plants is 7.24. The root fresh weight for plant 3 of the corn plants is
7.42. The root dry weight is recorded after the root is placed in the furnace to remove the
excess moisture leaving the dry matter in the root alone. The root dry weight for plant 1 of
the corn plant is 2.44. The root dry weight for plant 2 of the corn plant is 5.36. The root dry
weight for plant 3 of the corn plant is 7.58.
The shoot length of plant 1 of the corn plants is 68. The shoot length of plant 2 of the
corn plants is 73. The shoot length of plant 3 of the corn plants is 78.5. The stem dry weight
for plant 1 in the corn plants is 3.14. The stem dry weight for plant 2 in the corn plants is
5.99. The stem dry weight for plant 3 in the corn plants is 7.56.
In table 8 the data obtained was for the growth and development of corn and black
eye bean plants in the granular fertilizer treatment. The granular fertilizer is applied directly
to the soil in around the area of the root zone.. The number of leaves of plant 1 of the corn
30
plants is 7. The number of leaves for plant 2 of the corn plants is 9. The number of leaves for
plant 3 of the corn plants is 9. The number of leaves for plant 1 in the black eye bean plants is
11. The number of leaves for plant 2 in the black eye bean plants is 11. The number of leaves
for plant 3 of the black eye bean plants is 11.
The leaf fresh weight for plant 1 of the black eye bean plants is 8.65. The leaf fresh
weight for plant 2 of the black eye bean plants is 6.79. The leaf fresh weight for plant 3 of the
black eye bean plants is 8.35. The larger the leaf area of a plant is the higher the rate of
photosynthesis in the plant as the leaves will be able to absorb more sunlight. The leaf area
for plant 1 in the corn plants is 916.45. The leaf area for plant 2 in the corn plants is 897.15.
The leaf area for plant 3 in the corn plants is 874.37. The leaf area for plant 1 in the black eye
plants is 392. The leaf area for plant 2 in the black eye plants is 360. The leaf area for plant 3
in the black eye plants is 412.
The leaf dry weight is a parameter which can be studied to determine growth in the
plant. The leaf dry weight for plant 1 of the corn plants is 6.61. The leaf dry weight for plant
2 of the corn plants is 3.29. The leaf dry weight for plant 3 of the corn plants is 4.87. The leaf
dry weight for plant 1 of the black eye bean plants is 1.22. The leaf dry weight for plant 2 of
the black eye bean plants is 1.04. The leaf dry weight for plant 3 of the black eye bean plants
is 1.21. The root length increases the root mass of the plant and increases the absorption if
minerals and water from the soil according to available capacity. The root length for plant 1
of the corn plants is 26. The root length for plant 2 of the corn plants is 37.3. The root length
for plant 3 of the corn plants is 33.5. The root length for plant 1 of the black eye bean plants
is 32. The root length for plant 2 of the black eye bean plants is 19. The root length for plant
3 of the black eye bean plants is 28.
The root fresh weight for plant 1 in the corn plants is 6.71. The root fresh weight for
plant 2 in the corn plants is 8.79. The root fresh weight for plant 3 in the corn plants is 9.81.
The root fresh weight for plant 1 in the black eye bean plants is 3.84. The root fresh weight
for plant 2 in the black eye bean plants is 2.06. The root fresh weight for plant 3 in the black
eye bean plants is 3.17. The root dry weight is determined directly after the roots are placed
in the furnace to remove the moisture. The root dry weight for plant 1 of the corn plants is
4.54. The root dry weight for plant 2 of the corn plants is 2.54. The root dry weight for plant
31
3 of the corn plants is 3.97. The root dry weight for plant 1 of the black eye bean plants is
0.31. The root dry weight for plant 2 of the black eye bean plants is 0.26. The root dry weight
for plant 3 of the black eye bean plants is 0.72.
The shoot length for plant 1 in the corn plants is 87.5. The shoot length for plant 2 in
the corn plants is 92.2. The shoot length for plant 3 in the corn plants is 85.6. The shoot
length for plant 1 in the black eye bean plants is 60. The shoot length for plant 2 in the black
eye bean plants is 51. The shoot length for plant 3 in the black eye bean plants is 67. The
stem fresh weight for plant 1 of the black eye bean plants is 3.77. The stem fresh weight for
plant 1 of the black eye bean plants is 3.51. The stem fresh weight for the black eye bean
plants is 3.35.
The stem dry weight for plant 1 of the corn plants is 4.17. The stem dry weight for
plant 2 of the corn plants is 2.56. The stem dry weight for plant 3 of the corn plants is 4.18.
The stem dry weight for plant 1 of the black eye bean plants is 0.41. The stem dry weight for
plant 2 of the black eye bean plants is 0.45. The stem dry weight for plant 3 of the black eye
bean plants is 0.49.
In table 9, the data was recorded for the growth and development for growth of plants
in the control treatment for week 3. The leaf number of plant 1 of the corn plants is 5. The
leaf number of plant 2 of the corn plants is 6. The leaf number of plant 3 of the corn plants is
5. The leaf area of plant 1 of the corn plants is 635. The leaf area of plant 2 of the corn plants
is 257.5. The leaf area of plant 3 of the corn plants is 462.5. The root length for plant 1 of the
corn plants is 44. The root length for plant 2 of the corn plants is 48. The root length for plant
3 of the corn plants is 40. The root fresh weight for plant 1 of the corn plants is 16.5. The root
fresh weight for plant 2 of the corn plants is 4.3. The root fresh weight for plant 3 of the corn
plants is 4.3. The shoot length of a plant is an indicator of the growth rate in a plant. The
shoot length of plant 1 of the corn plants is 87.4. The shoot length of plant 2 for the corn
plants is 64.6. The shoot length for plant 3 for the corn plants is 73.
In table 10, the data recorded was for the growth and development of plants in the
foliar treatment for week 3. The number of leaves for plant 1 of the corn plants was 8. The
number of leaves for plant 2 of the corn plants was 6. The number of leaves for plant 3 of the
corn plants was 8. The leaf area for plant 1 of the corn plants was 1086.88. The leaf area for
32
plant 2 of the corn plants was 425.69. The leaf area for plant 3 of the corn plants was
1221.78. The root length for plant 1 of the corn plants was 43.4. The root length for plant 2
of the corn plants was 41.3. The root length for plant 3 of the corn plants was 38.9. The root
fresh weight for plant 1 of the corn plants was 14.3. The root fresh weight for plant 2 of the
corn plants was 3.8. The root fresh weight for plant 3 of the corn plants was 19.1. The shoot
length for plant 1 of the corn plants was 99.5. The shoot length for plant 2 of the corn plants
was 74.2. The shoot length for plant 3 of the corn plants was 101.
In table 11 the data recorded was for the growth and development of plants in a
manure fertilizer treatment. The number of leaves for plant 1 of the corn plants was 9. The
number of leaves for plant 2 of the corn plants was 8. The number of leaves for plant 3 of the
corn plants was 6. The leaf area for plant 1 of the corn plants was 1989.88. The leaf area for
plant 2 of the corn plants was 1199.03. The leaf area for plant 3 of the corn plants was
963.95. The root length for plant 1 of the corn plants was 40.2. The root length for plant 2 of
the corn plants was 34.5. The root length for plant 3 of the corn plants was 30.3. The root
fresh weight for plant 1 of the corn plants was 52.5. The root fresh weight for plant 2 of the
corn plants was 40.4. The root fresh weight for plant 3 of the corn plants was 21. The shoot
length for plant 1 of the corn plants was 105.8. The shoot length for plant 2 of the corn plants
was 108.5. The shoot length for plant 3 of the corn plants was 95.
In table 12 the data recorded was for the growth and development of plants in a
granular fertilizer treatment. The number of leaves for plant 1 of the corn plants was 7. The
number of leaves for plant 2 of the corn plants was 9. The number of leaves for plant 3 of the
corn plants was 9. The leaf area for plant 1 of the corn plants was 96.45. The leaf area for
plant 2 of the corn plants was 8997.15. The leaf area for plant 3 of the corn plants was
874.37. The root length for plant 1 of the corn plants was 26. The root length for plant 2 of
the corn plants was 37.3. The root length for plant 3 of the corn plants was 33.5. The root
fresh weight for plant 1 of the corn plants was 52.5. The root fresh weight for plant 1 of the
corn plants was 6.7. The root fresh weight for plant 2 of the corn plants was 8.7. The root
fresh weight for plant 3 of the corn is 9.8. The shoot length for plant 1 of the corn plants was
87.5. The shoot length for plant 2 of the corn plants was 92.2. The shoot length for plant 3 of
the corn plants was 85.6.
33
Conclusion
In doing this project/experiment we saw that plants grow differently but yet in the
same way when different nutrient sources are supplied to the plant. Though four conditions
was used and each have shown productivity in the growth of plant for food production, each
types have their cons and pros. In retrospect we can conclude that optimum growth would be
a combination of nutrients being up taken through the roots and leaves. Over time manure
will continue to break down and condition the soil to make growth much easier. Over all
each plant grows well in different conditions.
Recommendation/things affected the project
 Place plants in bigger bags to maximise root growth and not concealed the
dimension of the smaller bag. In addition to help the plant as it grows to stand
sturdy and not fall over.
 Take the volume of water given to the plants as water plays an important role in
dissolving nutrients to make it easier for nutrients to be taken in by the plant.
 try to eliminate human error as much as possible
 cover plants with netting to avoid pest from affecting them, this may result in
stunted growth, spread of disease
 Covid-19 caused the project to end for safety purposes therefore data/results
were not complete
34
Apendix
Symptoms of insect pest and disease on corn and Black eye beans.
Symptom Causal agent Symptoms
Slight intra-
veinal chlorosis
Possible mite damage as
well
Tunnels or
blotches.
Leaf minor
The flies do not directly
cause damage. It’s the
larva of the fly that’s cause
the problem. Larva
literally bored their way
through the leaf surface
leaving tunnels or
blotches.
Mottling Mite damage on topside of
leaf show a stippled
appearance to leaf surface
causing it to appear with
bumps or mottled color.
Mites use their mouthparts
to pierce plant cells usually
from underside of the leaf
and suck out the sap. After
which dry to brittle
discoloration onto leaf
appears
35
chlorosis Mite damage underside of
leaf
chlorosis and
leaf margin
necrosis
Boron toxicity, yellowing
of leaf tips and between
the veins.
Mites use their mouthparts
to pierce plant cells usually
from underside of the leaf
and suck out the sap. After
which dry to brittle
discoloration onto leaf
appears
brown necrotic
margin and tips
mottled spots
leaves.
Potassium- necrosis of the
leaf tips.
Potassium deficiency
shows brown necrotic
margin and tips and
mottled spots leaves.
Venal Chlorosis Nitrogen deficiency
yellowing on lower leaves
that begins at the tip and
progresses toward the
stalk.
36
.extreme
Chlorosis
Sulphur is essential in
protein synthesis. It is also
involved in plant
photosynthesis and
respiration.
It is a constituent of some
essential amino acids such
as cystine and methionine
The leaves show
thin, yellowish
stripes
Magnesium leaf tip and
leaf blade turns yellowish
brown scorching
and curling of
leaf tips
Yellowing
between leaf
veins.
Potassium - Chlorosis
starts on the lower leaves
on leaf margins
progressing towards the
midrib with tip and margin
dieback

More Related Content

What's hot

Proposal Kajian Tindakan
Proposal Kajian TindakanProposal Kajian Tindakan
Proposal Kajian TindakanHamidah Samsiah
 
kaedah penyelidikan dalam pendidikan
kaedah penyelidikan dalam pendidikankaedah penyelidikan dalam pendidikan
kaedah penyelidikan dalam pendidikan
Nik Zawawi
 
Form 1 Chapter 2- Cell as a Unit of Life
Form 1 Chapter 2- Cell as a Unit of LifeForm 1 Chapter 2- Cell as a Unit of Life
Form 1 Chapter 2- Cell as a Unit of Life
Hui Ying
 
Peringkat peringkat perkembangan kanak-kanak dan teori-teori perkembangan
Peringkat peringkat perkembangan kanak-kanak dan teori-teori perkembanganPeringkat peringkat perkembangan kanak-kanak dan teori-teori perkembangan
Peringkat peringkat perkembangan kanak-kanak dan teori-teori perkembangan
nursabiqah
 
HBSS3203 Pengenalan Sosiologi Topik 1
HBSS3203 Pengenalan Sosiologi Topik 1HBSS3203 Pengenalan Sosiologi Topik 1
HBSS3203 Pengenalan Sosiologi Topik 1
UNIVERSITY FOR TEACHERS XD
 
Rph sains t2
Rph sains t2Rph sains t2
Rph sains t2
zamzam zarawi
 
Sukan Bola Keranjang
Sukan Bola KeranjangSukan Bola Keranjang
Ciri Ciri Atau Aspek Aspek Pembinaan Item
Ciri Ciri Atau Aspek Aspek Pembinaan ItemCiri Ciri Atau Aspek Aspek Pembinaan Item
Ciri Ciri Atau Aspek Aspek Pembinaan ItemNur Hikmah
 
Ukuran kecenderungan memusat ; min, mod, median (EDUP3063 Pentaksiran dalam P...
Ukuran kecenderungan memusat ; min, mod, median (EDUP3063 Pentaksiran dalam P...Ukuran kecenderungan memusat ; min, mod, median (EDUP3063 Pentaksiran dalam P...
Ukuran kecenderungan memusat ; min, mod, median (EDUP3063 Pentaksiran dalam P...
FaFai S.
 
Statistik asas 1
Statistik asas 1Statistik asas 1
Statistik asas 1
George Berundang
 
12.graf gerakan
12.graf gerakan12.graf gerakan
12.graf gerakan
MrHan Physics
 
Redone final project
Redone final projectRedone final project
Redone final project
Monal D'cunha
 
BIOLOGY FORM 4 CHAPTER 3 - MOVEMENT OF SUBSTANCES ACROSS THE PLASMA MEMBRANE
BIOLOGY FORM 4 CHAPTER 3 -  MOVEMENT OF SUBSTANCES ACROSS THE PLASMA MEMBRANEBIOLOGY FORM 4 CHAPTER 3 -  MOVEMENT OF SUBSTANCES ACROSS THE PLASMA MEMBRANE
BIOLOGY FORM 4 CHAPTER 3 - MOVEMENT OF SUBSTANCES ACROSS THE PLASMA MEMBRANE
Nirmala Josephine
 
Chapter 5 cell division SPM Biology Form 4
Chapter 5 cell division SPM Biology Form 4Chapter 5 cell division SPM Biology Form 4
Chapter 5 cell division SPM Biology Form 4
Yee Sing Ong
 
Rancangan tahunan persekutuan pengakap kanak-kanak 2019
Rancangan tahunan persekutuan pengakap kanak-kanak 2019Rancangan tahunan persekutuan pengakap kanak-kanak 2019
Rancangan tahunan persekutuan pengakap kanak-kanak 2019
Braderjay Md Dawi
 
Kaedah pengumpulan data pemerhatian
Kaedah pengumpulan data pemerhatianKaedah pengumpulan data pemerhatian
Kaedah pengumpulan data pemerhatianANIS IBRAHIM
 
5.1 Mitosis tingkatan 4
5.1 Mitosis tingkatan 45.1 Mitosis tingkatan 4
5.1 Mitosis tingkatan 4
Jummy Masindah Jm
 
Stratifikasi sosial
Stratifikasi sosialStratifikasi sosial
Stratifikasi sosial
cik noorlyda
 

What's hot (20)

Proposal Kajian Tindakan
Proposal Kajian TindakanProposal Kajian Tindakan
Proposal Kajian Tindakan
 
kaedah penyelidikan dalam pendidikan
kaedah penyelidikan dalam pendidikankaedah penyelidikan dalam pendidikan
kaedah penyelidikan dalam pendidikan
 
Nota tm6013
Nota tm6013Nota tm6013
Nota tm6013
 
Form 1 Chapter 2- Cell as a Unit of Life
Form 1 Chapter 2- Cell as a Unit of LifeForm 1 Chapter 2- Cell as a Unit of Life
Form 1 Chapter 2- Cell as a Unit of Life
 
Peringkat peringkat perkembangan kanak-kanak dan teori-teori perkembangan
Peringkat peringkat perkembangan kanak-kanak dan teori-teori perkembanganPeringkat peringkat perkembangan kanak-kanak dan teori-teori perkembangan
Peringkat peringkat perkembangan kanak-kanak dan teori-teori perkembangan
 
HBSS3203 Pengenalan Sosiologi Topik 1
HBSS3203 Pengenalan Sosiologi Topik 1HBSS3203 Pengenalan Sosiologi Topik 1
HBSS3203 Pengenalan Sosiologi Topik 1
 
Rph sains t2
Rph sains t2Rph sains t2
Rph sains t2
 
Sukan Bola Keranjang
Sukan Bola KeranjangSukan Bola Keranjang
Sukan Bola Keranjang
 
Ciri Ciri Atau Aspek Aspek Pembinaan Item
Ciri Ciri Atau Aspek Aspek Pembinaan ItemCiri Ciri Atau Aspek Aspek Pembinaan Item
Ciri Ciri Atau Aspek Aspek Pembinaan Item
 
Ukuran kecenderungan memusat ; min, mod, median (EDUP3063 Pentaksiran dalam P...
Ukuran kecenderungan memusat ; min, mod, median (EDUP3063 Pentaksiran dalam P...Ukuran kecenderungan memusat ; min, mod, median (EDUP3063 Pentaksiran dalam P...
Ukuran kecenderungan memusat ; min, mod, median (EDUP3063 Pentaksiran dalam P...
 
Statistik asas 1
Statistik asas 1Statistik asas 1
Statistik asas 1
 
12.graf gerakan
12.graf gerakan12.graf gerakan
12.graf gerakan
 
Redone final project
Redone final projectRedone final project
Redone final project
 
Pengurusan bilik-darjah-
Pengurusan bilik-darjah-Pengurusan bilik-darjah-
Pengurusan bilik-darjah-
 
BIOLOGY FORM 4 CHAPTER 3 - MOVEMENT OF SUBSTANCES ACROSS THE PLASMA MEMBRANE
BIOLOGY FORM 4 CHAPTER 3 -  MOVEMENT OF SUBSTANCES ACROSS THE PLASMA MEMBRANEBIOLOGY FORM 4 CHAPTER 3 -  MOVEMENT OF SUBSTANCES ACROSS THE PLASMA MEMBRANE
BIOLOGY FORM 4 CHAPTER 3 - MOVEMENT OF SUBSTANCES ACROSS THE PLASMA MEMBRANE
 
Chapter 5 cell division SPM Biology Form 4
Chapter 5 cell division SPM Biology Form 4Chapter 5 cell division SPM Biology Form 4
Chapter 5 cell division SPM Biology Form 4
 
Rancangan tahunan persekutuan pengakap kanak-kanak 2019
Rancangan tahunan persekutuan pengakap kanak-kanak 2019Rancangan tahunan persekutuan pengakap kanak-kanak 2019
Rancangan tahunan persekutuan pengakap kanak-kanak 2019
 
Kaedah pengumpulan data pemerhatian
Kaedah pengumpulan data pemerhatianKaedah pengumpulan data pemerhatian
Kaedah pengumpulan data pemerhatian
 
5.1 Mitosis tingkatan 4
5.1 Mitosis tingkatan 45.1 Mitosis tingkatan 4
5.1 Mitosis tingkatan 4
 
Stratifikasi sosial
Stratifikasi sosialStratifikasi sosial
Stratifikasi sosial
 

Similar to Plant nutrition final lab report

Economization of Datura Plant Using Planttissue Culture
Economization of Datura Plant Using Planttissue CultureEconomization of Datura Plant Using Planttissue Culture
Economization of Datura Plant Using Planttissue Culture
iosrjce
 
The Stimulatory and Inhibitory Effects of Mungbean Extract on Germination and...
The Stimulatory and Inhibitory Effects of Mungbean Extract on Germination and...The Stimulatory and Inhibitory Effects of Mungbean Extract on Germination and...
The Stimulatory and Inhibitory Effects of Mungbean Extract on Germination and...
International journal of scientific and technical research in engineering (IJSTRE)
 
Evaluation of Different Growing Substrates on Lettuce (Lactuca sativa) under ...
Evaluation of Different Growing Substrates on Lettuce (Lactuca sativa) under ...Evaluation of Different Growing Substrates on Lettuce (Lactuca sativa) under ...
Evaluation of Different Growing Substrates on Lettuce (Lactuca sativa) under ...
Innspub Net
 
Plant tissue culture lab,sedf
Plant tissue culture lab,sedfPlant tissue culture lab,sedf
Plant tissue culture lab,sedf
iqra junejo
 
The Studies of Effect of Bio Fertilizers Rhizobium, Phosphobacteria, and Root...
The Studies of Effect of Bio Fertilizers Rhizobium, Phosphobacteria, and Root...The Studies of Effect of Bio Fertilizers Rhizobium, Phosphobacteria, and Root...
The Studies of Effect of Bio Fertilizers Rhizobium, Phosphobacteria, and Root...
IIJSRJournal
 
Effect of Seedling Density on Growth Attributes of Cauliflower variety Kathma...
Effect of Seedling Density on Growth Attributes of Cauliflower variety Kathma...Effect of Seedling Density on Growth Attributes of Cauliflower variety Kathma...
Effect of Seedling Density on Growth Attributes of Cauliflower variety Kathma...
AI Publications
 
Cultivar differences in plantain growth response
Cultivar differences in plantain growth responseCultivar differences in plantain growth response
Cultivar differences in plantain growth response
Alexander Decker
 
JPAIRVol22_
JPAIRVol22_JPAIRVol22_
JPAIRVol22_
KenthReynardMuoz
 
Role of bacteria with novel characteristics in the production of Organic Crop...
Role of bacteria with novel characteristics in the production of Organic Crop...Role of bacteria with novel characteristics in the production of Organic Crop...
Role of bacteria with novel characteristics in the production of Organic Crop...
ShreejitSaha1
 
Allelopathic Potential and HPTLC Analysis of Ipomoea carnea
Allelopathic Potential and HPTLC Analysis of Ipomoea carneaAllelopathic Potential and HPTLC Analysis of Ipomoea carnea
Allelopathic Potential and HPTLC Analysis of Ipomoea carnea
SSR Institute of International Journal of Life Sciences
 
Assessing the effect of polyculture on the phenological and nutraceutical pro...
Assessing the effect of polyculture on the phenological and nutraceutical pro...Assessing the effect of polyculture on the phenological and nutraceutical pro...
Assessing the effect of polyculture on the phenological and nutraceutical pro...
scribddarkened352
 
Comparative Effect of Potting Media on Sprouting and Seedling Growth of Grape...
Comparative Effect of Potting Media on Sprouting and Seedling Growth of Grape...Comparative Effect of Potting Media on Sprouting and Seedling Growth of Grape...
Comparative Effect of Potting Media on Sprouting and Seedling Growth of Grape...
International Multispeciality Journal of Health
 
Agronomic evaluation of eight genotypes of hot pepper (capsicum spp l.) in a ...
Agronomic evaluation of eight genotypes of hot pepper (capsicum spp l.) in a ...Agronomic evaluation of eight genotypes of hot pepper (capsicum spp l.) in a ...
Agronomic evaluation of eight genotypes of hot pepper (capsicum spp l.) in a ...
Alexander Decker
 
Agronomic evaluation of eight genotypes of hot pepper (capsicum spp l.) in a ...
Agronomic evaluation of eight genotypes of hot pepper (capsicum spp l.) in a ...Agronomic evaluation of eight genotypes of hot pepper (capsicum spp l.) in a ...
Agronomic evaluation of eight genotypes of hot pepper (capsicum spp l.) in a ...
Alexander Decker
 
“Antimicrobial activity of rhizospheric bacteria of Curcuma longa (Turmeric) ...
“Antimicrobial activity of rhizospheric bacteria of Curcuma longa (Turmeric) ...“Antimicrobial activity of rhizospheric bacteria of Curcuma longa (Turmeric) ...
“Antimicrobial activity of rhizospheric bacteria of Curcuma longa (Turmeric) ...
IOSRJPBS
 
“Performance of Tomato As Affected By Organic Mulching .pdf
“Performance of Tomato As Affected By Organic Mulching .pdf“Performance of Tomato As Affected By Organic Mulching .pdf
“Performance of Tomato As Affected By Organic Mulching .pdf
ShynneGabinete
 
Production of sugarcane by tissues culture
 Production of sugarcane by tissues culture Production of sugarcane by tissues culture
Production of sugarcane by tissues culture
ROHINI YADAV
 
Influence of an Uchkun Preparation to some Agricultural Crops which are Grown...
Influence of an Uchkun Preparation to some Agricultural Crops which are Grown...Influence of an Uchkun Preparation to some Agricultural Crops which are Grown...
Influence of an Uchkun Preparation to some Agricultural Crops which are Grown...
Agriculture Journal IJOEAR
 
Research Journal of Aklan State University - 2015 (Volume 3, No. 1)
Research Journal of Aklan State University - 2015 (Volume 3, No. 1)Research Journal of Aklan State University - 2015 (Volume 3, No. 1)
Research Journal of Aklan State University - 2015 (Volume 3, No. 1)
ASU-CHARRM
 
Plant Breeding - 1.pdfbbbbvvvvvvvkkjjkjj
Plant Breeding - 1.pdfbbbbvvvvvvvkkjjkjjPlant Breeding - 1.pdfbbbbvvvvvvvkkjjkjj
Plant Breeding - 1.pdfbbbbvvvvvvvkkjjkjj
BestoonHassanAhmed
 

Similar to Plant nutrition final lab report (20)

Economization of Datura Plant Using Planttissue Culture
Economization of Datura Plant Using Planttissue CultureEconomization of Datura Plant Using Planttissue Culture
Economization of Datura Plant Using Planttissue Culture
 
The Stimulatory and Inhibitory Effects of Mungbean Extract on Germination and...
The Stimulatory and Inhibitory Effects of Mungbean Extract on Germination and...The Stimulatory and Inhibitory Effects of Mungbean Extract on Germination and...
The Stimulatory and Inhibitory Effects of Mungbean Extract on Germination and...
 
Evaluation of Different Growing Substrates on Lettuce (Lactuca sativa) under ...
Evaluation of Different Growing Substrates on Lettuce (Lactuca sativa) under ...Evaluation of Different Growing Substrates on Lettuce (Lactuca sativa) under ...
Evaluation of Different Growing Substrates on Lettuce (Lactuca sativa) under ...
 
Plant tissue culture lab,sedf
Plant tissue culture lab,sedfPlant tissue culture lab,sedf
Plant tissue culture lab,sedf
 
The Studies of Effect of Bio Fertilizers Rhizobium, Phosphobacteria, and Root...
The Studies of Effect of Bio Fertilizers Rhizobium, Phosphobacteria, and Root...The Studies of Effect of Bio Fertilizers Rhizobium, Phosphobacteria, and Root...
The Studies of Effect of Bio Fertilizers Rhizobium, Phosphobacteria, and Root...
 
Effect of Seedling Density on Growth Attributes of Cauliflower variety Kathma...
Effect of Seedling Density on Growth Attributes of Cauliflower variety Kathma...Effect of Seedling Density on Growth Attributes of Cauliflower variety Kathma...
Effect of Seedling Density on Growth Attributes of Cauliflower variety Kathma...
 
Cultivar differences in plantain growth response
Cultivar differences in plantain growth responseCultivar differences in plantain growth response
Cultivar differences in plantain growth response
 
JPAIRVol22_
JPAIRVol22_JPAIRVol22_
JPAIRVol22_
 
Role of bacteria with novel characteristics in the production of Organic Crop...
Role of bacteria with novel characteristics in the production of Organic Crop...Role of bacteria with novel characteristics in the production of Organic Crop...
Role of bacteria with novel characteristics in the production of Organic Crop...
 
Allelopathic Potential and HPTLC Analysis of Ipomoea carnea
Allelopathic Potential and HPTLC Analysis of Ipomoea carneaAllelopathic Potential and HPTLC Analysis of Ipomoea carnea
Allelopathic Potential and HPTLC Analysis of Ipomoea carnea
 
Assessing the effect of polyculture on the phenological and nutraceutical pro...
Assessing the effect of polyculture on the phenological and nutraceutical pro...Assessing the effect of polyculture on the phenological and nutraceutical pro...
Assessing the effect of polyculture on the phenological and nutraceutical pro...
 
Comparative Effect of Potting Media on Sprouting and Seedling Growth of Grape...
Comparative Effect of Potting Media on Sprouting and Seedling Growth of Grape...Comparative Effect of Potting Media on Sprouting and Seedling Growth of Grape...
Comparative Effect of Potting Media on Sprouting and Seedling Growth of Grape...
 
Agronomic evaluation of eight genotypes of hot pepper (capsicum spp l.) in a ...
Agronomic evaluation of eight genotypes of hot pepper (capsicum spp l.) in a ...Agronomic evaluation of eight genotypes of hot pepper (capsicum spp l.) in a ...
Agronomic evaluation of eight genotypes of hot pepper (capsicum spp l.) in a ...
 
Agronomic evaluation of eight genotypes of hot pepper (capsicum spp l.) in a ...
Agronomic evaluation of eight genotypes of hot pepper (capsicum spp l.) in a ...Agronomic evaluation of eight genotypes of hot pepper (capsicum spp l.) in a ...
Agronomic evaluation of eight genotypes of hot pepper (capsicum spp l.) in a ...
 
“Antimicrobial activity of rhizospheric bacteria of Curcuma longa (Turmeric) ...
“Antimicrobial activity of rhizospheric bacteria of Curcuma longa (Turmeric) ...“Antimicrobial activity of rhizospheric bacteria of Curcuma longa (Turmeric) ...
“Antimicrobial activity of rhizospheric bacteria of Curcuma longa (Turmeric) ...
 
“Performance of Tomato As Affected By Organic Mulching .pdf
“Performance of Tomato As Affected By Organic Mulching .pdf“Performance of Tomato As Affected By Organic Mulching .pdf
“Performance of Tomato As Affected By Organic Mulching .pdf
 
Production of sugarcane by tissues culture
 Production of sugarcane by tissues culture Production of sugarcane by tissues culture
Production of sugarcane by tissues culture
 
Influence of an Uchkun Preparation to some Agricultural Crops which are Grown...
Influence of an Uchkun Preparation to some Agricultural Crops which are Grown...Influence of an Uchkun Preparation to some Agricultural Crops which are Grown...
Influence of an Uchkun Preparation to some Agricultural Crops which are Grown...
 
Research Journal of Aklan State University - 2015 (Volume 3, No. 1)
Research Journal of Aklan State University - 2015 (Volume 3, No. 1)Research Journal of Aklan State University - 2015 (Volume 3, No. 1)
Research Journal of Aklan State University - 2015 (Volume 3, No. 1)
 
Plant Breeding - 1.pdfbbbbvvvvvvvkkjjkjj
Plant Breeding - 1.pdfbbbbvvvvvvvkkjjkjjPlant Breeding - 1.pdfbbbbvvvvvvvkkjjkjj
Plant Breeding - 1.pdfbbbbvvvvvvvkkjjkjj
 

Recently uploaded

IDF 2024 dairy conference. Brochure.pdf
IDF 2024 dairy conference.  Brochure.pdfIDF 2024 dairy conference.  Brochure.pdf
IDF 2024 dairy conference. Brochure.pdf
prasadp100
 
在线办理(UCM毕业证书)加州大学美熹德分校毕业证文凭证书一模一样
在线办理(UCM毕业证书)加州大学美熹德分校毕业证文凭证书一模一样在线办理(UCM毕业证书)加州大学美熹德分校毕业证文凭证书一模一样
在线办理(UCM毕业证书)加州大学美熹德分校毕业证文凭证书一模一样
7sl9gbvd
 
FOOD OBESITY IN NORTH AMERICA ( NEW).pptx
FOOD OBESITY IN NORTH AMERICA ( NEW).pptxFOOD OBESITY IN NORTH AMERICA ( NEW).pptx
FOOD OBESITY IN NORTH AMERICA ( NEW).pptx
kevinfrancis63
 
Heritage Conservation.Strategies and Options for Preserving India Heritage
Heritage Conservation.Strategies and Options for Preserving India HeritageHeritage Conservation.Strategies and Options for Preserving India Heritage
Heritage Conservation.Strategies and Options for Preserving India Heritage
JIT KUMAR GUPTA
 
快速办理(Adelaide毕业证书)阿德莱德大学毕业证文凭证书一模一样
快速办理(Adelaide毕业证书)阿德莱德大学毕业证文凭证书一模一样快速办理(Adelaide毕业证书)阿德莱德大学毕业证文凭证书一模一样
快速办理(Adelaide毕业证书)阿德莱德大学毕业证文凭证书一模一样
mmmnvxcc
 
一比一原版(Sheffield毕业证书)谢菲尔德大学毕业证如何办理
一比一原版(Sheffield毕业证书)谢菲尔德大学毕业证如何办理一比一原版(Sheffield毕业证书)谢菲尔德大学毕业证如何办理
一比一原版(Sheffield毕业证书)谢菲尔德大学毕业证如何办理
i990go7o
 

Recently uploaded (6)

IDF 2024 dairy conference. Brochure.pdf
IDF 2024 dairy conference.  Brochure.pdfIDF 2024 dairy conference.  Brochure.pdf
IDF 2024 dairy conference. Brochure.pdf
 
在线办理(UCM毕业证书)加州大学美熹德分校毕业证文凭证书一模一样
在线办理(UCM毕业证书)加州大学美熹德分校毕业证文凭证书一模一样在线办理(UCM毕业证书)加州大学美熹德分校毕业证文凭证书一模一样
在线办理(UCM毕业证书)加州大学美熹德分校毕业证文凭证书一模一样
 
FOOD OBESITY IN NORTH AMERICA ( NEW).pptx
FOOD OBESITY IN NORTH AMERICA ( NEW).pptxFOOD OBESITY IN NORTH AMERICA ( NEW).pptx
FOOD OBESITY IN NORTH AMERICA ( NEW).pptx
 
Heritage Conservation.Strategies and Options for Preserving India Heritage
Heritage Conservation.Strategies and Options for Preserving India HeritageHeritage Conservation.Strategies and Options for Preserving India Heritage
Heritage Conservation.Strategies and Options for Preserving India Heritage
 
快速办理(Adelaide毕业证书)阿德莱德大学毕业证文凭证书一模一样
快速办理(Adelaide毕业证书)阿德莱德大学毕业证文凭证书一模一样快速办理(Adelaide毕业证书)阿德莱德大学毕业证文凭证书一模一样
快速办理(Adelaide毕业证书)阿德莱德大学毕业证文凭证书一模一样
 
一比一原版(Sheffield毕业证书)谢菲尔德大学毕业证如何办理
一比一原版(Sheffield毕业证书)谢菲尔德大学毕业证如何办理一比一原版(Sheffield毕业证书)谢菲尔德大学毕业证如何办理
一比一原版(Sheffield毕业证书)谢菲尔德大学毕业证如何办理
 

Plant nutrition final lab report

  • 1. 1 .Plant Nutrition NAME: Jahmol Colbourne ID#: 80830. PROGRAM: Bachelor of Science in Agriculture and Entrepreneurship LECTURER: Dr. Puran Bridgemohan
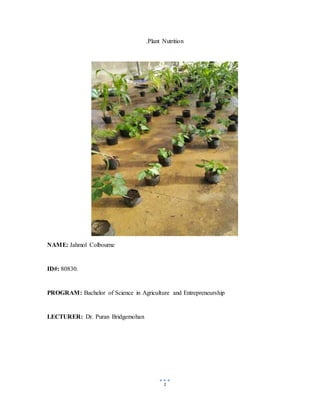
  • 2. 2 Title Plant Nutrition - Project Based Learning. Aim To use four different nutrient sources to see how they affect the growth, development and structure of black eye beans (Vigna unguiculata subsp. unguiculata) and corn (Zea Mays Location of Study UTT E.C.I.A.F Caroni North Bank Road, Centeno. – E.C.I.A.F Greenhouse. Period of Study Monday 26th January, 2020 to Wednesday 25th March. The project lasted approximately 8 weeks. Objectives The main objectives of conducting this laboratory experiment are: To design an experiment in a controlled environment where different nutrients affect the growth and development of black eye beans and corn To recognize mineral deficiency, toxicity, and to show the symptoms/characteristics
  • 3. 3 Introduction Plant nutrition is the study of the chemical elements and compounds necessary for plant growth, plant metabolism and their external supply. In its absence the plant is unable to complete a normal life cycle. The goals of plant nutrition is, to improve the growth of plants to increase the quality of harvest products, to improve soil fertility, to promote the recycling of nutrients, to reduce the cost of resources and to minimize fertilization-related environmental impacts.. Nutrients are essential to all living organisms because it improves the rate of holistic growth and development of the organism. Plants contain two major forms of nutrients which are micro-nutrients and macro-nutrients. Micronutrients are essential elements needed by life in small quantities. In plant nutrition there are different sources from where plants obtain their nutrients. One of the main sources of nutrients is the soil. Plants absorb nutrients at the roots of plants to engage in the process of photosynthesis which takes place in the leaves. Plants also gets nutrients from its leaves taking in some level of nutrients from the atmosphere, in addition, liquid fertilizers can be added to the leaves for the leaves absorb nutrients efficiently and quickly. They also get nutrients from fertilizers both organic and inorganic which could be in a solid or liquid.. Manure is another source of nutrients in plants as it contains many trace mineral elements which are essential for the growth and development of plants. Nutrient deficiencies are very prevalent in the field of crops and can affect the growth and development of plants. Very acid or alkaline conditions, dryness and water logging can all make it difficult for plants to take up soil nutrients.
  • 4. 4 Schedule of Activities - Plant Nutrition Project Activities Week After Sowing (WAS) 1 2 3 4 5 6 7 8 9 10 11 12 Sowing Corn B.E. Bean 27/01 /20 27/01 /20 14/02/ 20 Germination Corn B.E. Bean 31/01 /20 07/02 /20 17/02/ 20 Soil Sample (60g of Soil) 12/02/ 20 11/03 /20 Growth Measurement And Harvest 12/02/ 20 19/02/ 20 26/02/ 20 04/03/ 20 11/03 /20 18/03/ 20 25/03/ 20 01/04/ 20 08/04/ 20 15/04/ 20 N.P.K Fertilizer Application (12.24.12 – 1g/pl)) 13/02/ 20 20/02/ 20 27/02/ 20 05/03/ 20 12/03 /20 19/03/ 20 26/03/ 20 02/03/ 20 09/03/ 20 16/04/ 20 Foliar Fertilizer Application 13/02/ 20 17/02/ 20 20/02/ 20 24/02/ 20 27/02/ 20 02/03/ 20 05/03/ 20 09/03 /20 12/03 /20 16/03/ 20 19/03/ 20 23/03/ 20 26/03/ 20 30/03/ 20 02/04/ 20 06/04/ 20 09/04/ 20 13/04/ 20 16/04/ 20 Insecticide Application 13/02/ 20 27/02/ 20 12/03 /20 26/03/ 20 09/03/ 20 Soil Analysis Tissue Analysis Flowering Corn B.E. Bean 20/02/ 20 Check Deficiencies, diseases etc. 13/02/ 20 19/02/ 20 26/02/ 20 04/03/ 20 11/03 /20 18/03/ 20 25/03/ 20 01/04/ 20 08/04/ 20 15/04/ 20 Insecticide Application 13/02/ 20 27/02/ 20 12/03 /20 26/03/ 20 09/03/ 20
  • 5. 5 Schedule of Activities - Plant Nutrition Project Activities Week After Sowing (WAS) 1 2 3 4 5 6 7 8 9 10 11 12 Week ending 27/01 07/02 14/02 20/0 2 27/02 05/03 12/0 3 19/0 3 26/0 3 02/0 4 09/0 3 16/0 4 Sowing Corn B.E. Bean ←→ ←→ Germination Corn B.E. Bean ←→ ←→ ←→ ←→ Soil Sample (60g of Soil) ←→ ←→ Growth Measurement And Harvest ←→ ←→ ←→ ←→ ←→ ←→ ←→ ←→ ←→ ←→ N.P.K Fertilizer Application ←→ ←→ ←→ ←→ ←→ ←→ ←→ ←→ ←→ ←→ Foliar Fertilizer Application ←→ ←→ ←→ ←→ ←→ ←→ ←→ ←→ ←→ ←→ ←→ ←→ ←→ ←→ ←→ ←→ ←→ ←→ Insecticide Application ←→ ←→ ←→ ←→ ←→ Soil Analysis Tissue Analysis Flowering Corn B.E. Bean ←→ ←→ ←→ ←→ ←→ ←→ ←→ ←→ ←→ ←→ Deficiencies, diseases etc. ←→ ←→ ←→ ←→ ←→ ←→ ←→ ←→ ←→ ←→ Insecticide Application ←→ ←→ ←→ ←→ ←→ Harvest
  • 6. 6 Experimental Design This project was conducted during the period January to March, 2020 as part of the learning outcomes in the Course – Plant nutrition. It done under greenhouse conditions to study the effects on the growth rate of two different types of crops based on different nutrient sources in a semi-controlled environment. The establishment and management of the experiment were done by the students under the supervisions of the Instructor. The laboratory experiment has 3 parts, crop agronomy, crop growth analysis [tissue analysis] and nutrient assessment [soil analysis]. Crops The crops selected were corn (Zea mays) which is a cereal crop of the grass family, and black eye beans (Vigna unguiculata subsp. unguiculata) is a leguminous crop which is edible and can be used for many purposes in the world. The crop was sown in potting bags filled with 2l of soil [Piarco Fine Sand], which was sieved and free of debris. Sources of Nutrients In this experiment there were 4 different nutrient sources, which included: i. Foliar fertilizer [ nutrex -20:20:20:2: TE 1:1 every 2 week for 3 days] ii. Inorganic fertilizer [ 1:1 ratio manure] iii. Granular [12:24:12). iv. Control [soil] – No fertilizer. Experimental design The experimental was laid out as a randomized block design [RBD]. - Crops: 2 - Amount of Nutrient Sources: 4 - Blocks: 3 - Replication: 10
  • 7. 7 Black eyedBeans (Vigna unguiculata subsp. unguiculata) 4 treatments x 10 plants x 3 repetitions = 120 plants. - Total amount of plants used in the study = 120 plants + 120 plants = 240 plants. - There were 10 plants per treatment. - No of pots required = 240 pots. Corn (Zea mays) 4 treatments x 10 plants x 3 repetitions = 120 plants. - Total amount of plants used in the study = 120 plants + 120 plants = 240 plants. - There were 10 plants per treatment. - No of pots required = 240 pots. Observations Figure 1: Yellow Streaking: Nitrogen Deficiency. Figure 2: Burnt discolouration at the tip of the leaf apex: Potassium Deficiency.
  • 8. 8 Figure 3: Showing the leaf miner attacking the black eye plant. Method Used for Soil and Tissue Analysis Tissue Analysis: On a weekly basis, every seven days destructive analysis was conducted for the both crops the corn and the black eyes beans. The crops were removed from their bags in the greenhouse and the soil and particulate matter were washed off from the root of the plant carefully to prevent damage to the roots and plant. The plants were then taken to the lab to be analyzed to obtain data. Soil Analysis: 100g of growth media was taken from each treatment. The soil samples were taken randomly from different plants in the greenhouse throughout the experiment. The initial batch of soil samples were taken because the plants were fertilized. The main aim for testing the soil used is to determine the quantity of nitrogen, potassium and phosphorous that the soil contains. Data Analysis During this lab experiment the students engaging in this project conducted mathematical growth analysis on the corn plants and the black eye plants. Plant growth analysis refers to a set of concepts and equations by which changes in size of plants over time can be summarised and dissected in component variables. It is often applied in the analysis of growth of individual plants, but can also be used in a situation where crop growth is followed over time.
  • 9. 9 Plant growth parameters include involves both the cell division and enlargement. The plant growth can be visualized in terms of increase in length or plant height, stem diameter, volume of tissue, increase in cell numbers, increase in fresh weight and dry weight, increase in leaf area and leaf weight. At the ending of this laboratory experiment the data will be analyzed, documented and presented using graphs and tables. Layout of Experiment Key: X – CORN PLANTS: O – BLACK EYE BEANS PLANTS TREATMENTS 1 2 3 4 Foliar fertilizers GRANULAR FERTILIZER MANURE CONTROL X O X O X O X O X O X O X O X O X O X O X O X O X O X O X O X O X O X O X O X O X O X O X O X O X O X O X O X O X O X O X O X O X O X O X O X O X O X O X O X O X O X O X O X O X O X O X O X O X O X O X O X O X O X O X O X O X O X O X O X O X O X O X O X O X O X O X O X O X O X O X O X O X O X O X O X O X O X O X O X O X O X O X O X O X O X O X O X O X O X O X O X O X O X O X O X O X O X O X O X O X O X O X O X O
  • 10. 10 X O X O X O X O X O X O X O X O X O X O X O X O Plants were placed 1 ft intra-row and inter-row with a boundary row round the entire plot. Treatments were separated by 3ft and the foliar treatment was placed downwind to avoid spray drift onto other treatments. CROP RESPONSE DATA WEEKLYSHEET Week ending ……………….. TREATMENTS DATE SHOOT LENGHT LEAF LENGTH ROOT LENGTH LEAF WEIGHT LEAF AREA ROOT WEIGHT FOLIAR FERTILZER X FOLIAR FERTILZER O GRANULAR FERTILIZER X GRANULAR FERTILIZR O MANURE X MANURE O CONTROL X
  • 11. 11 CONTROL O MEAN SE Material and Methods This Study was conducted the period Jan to April, 2020. It was conducted in a greenhouse under semi-protected conditions. The test crops were a legume and a grass cereal. Zea mays (corn) and Vigna unguiculata (Black Eye Beans) were pre-conditioned by soaking overnight before sowing in 240 ml black medium sized potting bags. The bags were filled with different planting media according to the planned treatments and were placed in a shade house and spaced out 30 cm apart. In addition, a guard row was formed around the perimeter of the experimental specimens to protect them from pests. Treatments There were to be 4 treatments total, consisting of 30 plants per treatment and this would be done for both crops, leading to a total amount of 240 plants (120 Corn and 120 Beans). Table 1: Showing the different treatments used in the experiment together with crucial characteristics of the fertilizer treatment regime. Treatment Number Treatment Description 1 control  soil only,  no fertilizer  provided with only the necessary amount of water 2 Rotted cow manure  manure treatment  filled with a 1:1 ratio of soil and cow manure, this treatment was also manure treatment  was the not given any additional fertilizer aside from the initial manure
  • 12. 12 3 foliar fertilizer  foliar fertilizer  20:20:20 foliar fertilizer at a rate of 0.25g/plant every 2 days for the first 3 weeks after germination  switched to a rate of 1g/plant every 2 days 4 granular fertilizer  12:24:12 granular fertilizer at a rate of 1g/plant once a week until flowering. . All of the plants were treated with Caprid insecticide every 7 days at the labelled rate to protect them from pests. Observations Tissue Analysis Growth parameters being measured to determine growth and development were soil analysis of NPK (Nitrogen, Phosphorous, Potassium), tissue analysis of NPK, dry matter content, number of leaves, number of flowers (if any), number of fruits (if any), surface area of the leaves, plant height and root length. Destructive analysis was conducted on a weekly basis (every 7 days) for 5 weeks for both crops. The crops were removed from their bags and the soil and organic matter were gently washed off, taking care not to destroy any of the roots. The samples were moved to a lab and data was taken accordingly. i. The number of leaves, fruits and flowers were counted and the area of each individual leaf was taken using graph paper to calculate the area. ii. The plant height and root length were taken using a meter rule. iii. Weight of the leaves, root and shoot were taken individually and were then labelled according to treatment and crop and placed to dry in a convection oven for 72 °C for 3 days or until constant weight, after which the dry weight was taken using an analytical balance.
  • 13. 13 Soil Analysis For the soil analysis, 100g of growth media was taken from each treatment. The samples were taken randomly from different plants within the treatments. The first batch of samples was taken before the application of fertilizers to the crops. These samples were taken to the lab and tested for Nitrogen (N), Phosphorous (P) and Potassium (K) content. i. Nitrogen was determined using the Kjeldah lmethod (Motsara et al 2008), ii. Phosphorous and potassium was determined using atomic absorption spectroscopy (Perkin Elmer Corp 1996). iii. A post fertilization analysis would have also been done on the soil samples 1 week after fertilizer application using the same procedure to determine N, P and K. iv. Similarly, a tissue analysis was also during destructive analysis to determine the amounts of N, P and K using the same procedures as would have been used for the soil analysis. Kjeldahl Method. a. Finely ground the sample and thoroughly mix. b. Weigh 1 g of sample. Place in a Kjeldahl flask. c. Add 0.7 g of copper sulphate, 1.5 g of K2SO4 and 30 ml of H2SO4. d. Heat gently until frothing ceases. If necessary, add a small amount of paraffin or glass beads to reduce frothing. e. Boil briskly until the solution is clear and then continue digestion for at least 30 minutes. f. Remove the flask from the heater and cool, add 50 ml of water, and transfer to a distilling flask. g. Place accurately 20–25 ml of standard acid (0.1M HCl or 0.05M H2SO4) in the receiving conical flask so that there will be an excess of at least 5 ml of the acid. Add 2–3 drops of methyl red indicator. Add enough water to cover the end of the condenser outlet tubes. h. Run tap-water through the condenser.
  • 14. 14 i. Add 30 ml of 35-percent NaOH in the distilling flask in such a way that the contents do not mix. j. Heat the contents to distil the ammonia for about 30–40 minutes. k. Remove the receiving flask and rinse the outlet tube into the receiving flask with a small amount of distilled water. l. Titrate excess acid in the distillate with 0.1M NaOH. m. Determine blank on reagents using the same quantity of standard acid in a receiving conical flask. The calculation is: 1.401 [(V1 M1 - V2M 2) - (V3M 1 - V4M 2)] Percent N = ———————————————————— × df W Where: V1 – millilitres of standard acid put in receiving flask for samples; V2 – millilitres of standard NaOH used in titration; V3 – millilitres of standard acid put in receiving flask for blank; V4 – millilitres of standard NaOH used in titrating blank; M1 – molarity of standard acid; M2 – molarity of standard NaOH; W – Weight of sample taken (1g); df – dilution factor of sample (if 1 g was taken for estimation, the dilution factor will be 100).
  • 15. 15 Atomic Absorption 1. Finely ground the sample and thoroughly mix. 2. Measure 5.0g of sample. 3. Sieve sample into an Erlenmeyer flask 4. Add 20ml of extracting solution (0.05N HCL + 0.025N H2SO4) 5. Place in a mechanical shaker for 15 minutes. 6. Filter through Whatman #42 filter paper into a 50ml volumetric flask 7. Dilute to 50 ml with extracting solution 8. Determine concentration of element of interest using Standard Conditions and Characteristic Concentration Checks for Atomic Absorption. Results/Data Presentation Table 1: Showing the data obtained for the corn plants and black eye bean plants under the control treatment for the first week. (Week 1) CONTROL Zea mays (Corn) Vigna unguiculata (Black Eye Beans) P1 P2 P3 P1 P2 P3 Leaf Number 6 6 6 16 17 17 Leaf Fresh Weight - - - 11.4 13.4 1.7 Leaf Area 584.5 729 770 126 180 292 Leaf Dry Weight - - - - - - Root Length 38 45 41 24.3 9.2 9.9 Root Fresh Weight 8.78 9.63 9.42 1.34 1.9 1 Root Dry Weight - - - - - - Shoot Length 65 68.5 64.5 38 40.3 36 Stem Fresh weight - - - 6.5 7.4 6.4 Stem Dry weight - - - - - - Number of pods - - - - - - Pod Fresh wt - - - - - - Pod dry wt - - - - -
  • 16. 16 Table 2: Showing the Data obtained for the corn plants and black eye bean plants under the foliar treatment for the first week. FOLIAR Zea mays Vigna unguiculata P1 P2 P3 P1 P2 P3 Leaf number 6 5 26 17 14 23 Leaf fresh weight - - 13.29 17.13 9.15 24.5 Leaf Area 580 412 748 941.11 532.2 1432.14 Leaf dry weight - - - - - - Root length 38.5 44 28 13.5 9.5 11.5 Root Fresh Weight 2.91 10.03 4.23 2.98 0.94 4.26 Root Dry weight - - - - - - Shoot length 68 79 53 53 36 56.7 Stem fresh weight - - 10.14 8.16 3.86 14.57 Stem dry weight - - - - - - Number of pods - - 5 - - - Pod Fresh Weight - - 1.15 - - - Pod dry Weight - - - - - - Table 3: Showing the Data Obtained for the corn plants and black eye bean plants under the manure treatment for the first week of the experiment. MANURE Zea mays Vigna unguiculata P1 P2 P3 P1 P2 P3 Leaf no. 6 7 6 27 17 16 Leaf fresh weight - - - 19.1 8.7 10.3 Leaf Area 1044.5 858 607 1292.99 537.95 722.92 Leaf dry weight - - - - - - Root length 40.5 49.5 42 19 15.5 9.5 Root Fresh Weight 4.21 7.24 7.42 2.3 0.9 1 Root dry Weight - - - - - - Shoot Length 68 73 78.5 51 31.5 42 Stem fresh Weight - - - 16.8 4.7 7.3 Stem Dry Weight - - - - - - Number of pods - - - - - - Pod Fresh Weight - - - - - - Pod dry Weight - - - - - -
  • 17. 17 Table 4: Showing the Data Obtained for the corn plants and black eye bean plants under the granular treatment for the first week of the experiment. GRANULAR Zea mays Vigna unguiculata P1 P2 P3 P1 P2 P3 Leaf no. 6 5 6 16 18 17 Leaf fresh Weight - - - 10.68 15.04 5.73 Leaf Area 436 462.5 457.5 404 648 288 Leaf dry Weight - - - - - - Root length 40 37 48 12 16.5 12.5 Root Fresh Weight 25.23 2.94 4.15 3.37 3.03 87 Root dry Weight - - - - - - Shoot Length 57 65 65 33 37.2 38.5 Stem fresh Weight - - - 4.57 9.22 3.17 Stem dry Weight - - - - - - Number of pods - - - - - - Pod Fresh Weight - - - - - - Pod dry Weight - - - - - - Table 5: Showing the data obtained for the corn plants and black eye bean plants under the control treatment for the second week. Control Zea Mays P1 P2 P3 Leaf no. 6 6 6 Leaf fresh weight - - - Leaf Area 584.5 792 770 Leaf dry weight - - Root length 38 45 47 Root Fresh wt 8.78 9.63 9.42 Root dry weight - - - Shoot length 65 68.5 64.5 Stem fresh weight - - - Stem dry weight - - - Number of pods - - - Pod Fresh wt - - - Pod dry wt - - -
  • 18. 18 Table 6: Showing the Data obtained for the corn plants and black eye bean plants under the foliar treatment for the second week. Zea mays P1 P2 P3 Leaf no. 6 5 6 Leaf fresh weight - - - Leaf Area 600 500 512 Leaf dry weight 5.42 5.14 5.2 Root length 38.5 44 46 Root Fresh wt 2.91 10.03 8.21 Root dry weight 3.07 2.44 3.66 Shoot length 68 79 80 Stem fresh weight - - - Stem dry weight 4.15 3.19 4.02 Number of pods - - - Pod Fresh wt - - - Pod dry wt - - - Table 7: Showing the Data Obtained for the corn plants and black eye bean plants under the manure treatment for the second week of the experiment. Zea mays P1 P2 P3 Leaf no. 6 7 6 Leaf fresh weight - - - Leaf Area 1044.5 858 607 Leaf dry weight 5.26 8.28 8.26 Root length 40.5 49.5 42 Root Fresh wt 4.21 7.24 7.42 Root dry weight 2.44 5.36 7.58 Shoot length 68 73 78.5 Stem fresh weight - - - Stem dry weight 3.14 5.99 7.56 Number of pods - - - Pod Fresh wt - - - Pod dry wt - - -
  • 19. 19 Table 8: Showing the Data Obtained for the corn plants and black eye bean plants under the granular treatment for the second week of the experiment. GRANULAR Zea mays Vigna unguiculata P1 P2 P3 P1 P2 P3 Leaf no. 7 9 9 11 11 11 Leaf fresh weight - - - 8.65 6.79 8.35 Leaf Area 916.45 897.15 874.37 392 360 412 Leaf dry weight 6.61 3.29 4.87 1.22 1.04 1.21 Root length 26 37.3 33.5 32 19 28 Root Fresh wt 6.71 8.79 9.81 3.84 2.06 3.17 Root dry weight 4.54 2.54 3.97 0.31 0.26 0.72 Shoot length 87.5 92.2 85.6 60 51 57 Stem fresh weight - - - 3.77 3.51 3.35 Stem dry weight 4.17 2.56 4.18 0.41 0.45 0.49 Number of pods - - - - - - Pod Fresh wt - - - - - - Pod dry wt - - - - - - Table 9: Showing the data obtained for the corn plants and black eye bean plants under the control treatment for the third week. CONTROL Zea mays P1 P2 P3 Leaf no. 5 6 5 Leaf fresh weight - - - Leaf Area 635 257.5 462.5 Leaf dry weight - - - Root length 44 48 40 Root Fresh wt 16.5 4.3 4.3 Root dry weight - - - Shoot length 87.4 64.6 73 Stem fresh weight - - - Stem dry weight - - - Number of pods - - - Pod Fresh wt - - -
  • 20. 20 Table 10: Showing the Data obtained for the corn plants and black eye bean plants under the foliar treatment for the third week. FOLIAR Zea mays P1 P2 P3 Leaf no. 8 6 8 Leaf fresh weight - - - Leaf Area 1086.88 425.69 1221.78 Leaf dry weight - - - Root length 43.4 41.3 38.9 Root Fresh wt 14.3 2.8 19.1 Root dry weight - - - Shoot length 99.5 74.2 101 Stem fresh weight - - - Stem dry weight - - - Number of pods - - - Pod Fresh wt - - - Pod dry wt - - - Table 11: Showing the Data Obtained for the corn plants and black eye bean plants under the manure treatment for the third week of the experiment. MANURE Zea mays P1 P2 P3 Leaf no. 9 8 6 Leaf fresh weight - - - Leaf Area 1989.88 1199..03 963.95 Leaf dry weight - - - Root length 40.2 34.5 30.3 Root Fresh wt 52.5 40.4 21 Root dry weight - - - Shoot length 105.8 108.5 95 Stem fresh weight - - - Stem dry weight - - - Number of pods - - - Pod Fresh wt - - - Pod dry wt - - -
  • 21. 21 Table 12: Showing the Data Obtained for the corn plants and black eye bean plants under the granular treatment for the third week of the experiment. GRANULAR Zea mays P1 P2 P3 Leaf no. 7 9 9 Leaf fresh weight - - - Leaf Area 96.45 8997.15 874.37 Leaf dry weight - - - Root length 26 37.3 33.5 Root Fresh wt 6.7 8.7 9.8 Root dry weight - - - Shoot length 87.5 92.2 85.6 Stem fresh weight - - - Stem dry weight - - - Number of pods - - - Pod Fresh Weight - - - Pod dry Weight - - -
  • 22. 22 Discussion A fertilizer is defined as a chemical or natural substance added to the soil or land to increase its fertility. In this nutrition study the agriculturalist determined the impact of four different types of fertilizer treatments on the growth and development of the corn plants and black eyed beans plants. The four different fertilizer treatment include, control (no fertilizer), foliar, manure and granular. A control fertilizer is defined as one which is gradually introduced into the soil at specific periods of time. A foliar fertilizer is a fertilizer product that is applied directly to the leaves of the plant. In foliar fertilizers the plants are able to absorb basic micro-nutrients and macro-nutrients through the leaf system. Foliar fertilizers usually take a short amount of time to enter the system of the plant. Manure is organic matter that is used as a major organic fertilizer in agriculture. Manure contains basic nutrients which are essential for growth and development of the plants and also influences the yield produced. Granular fertilizer is a dry fertilizer which is in the form of a pellet. Granular fertilizers are added to the soil around the area of the root zone. A granular fertilizer can either be natural or synthetic in form. It is important to find out the number of leaves on a plant to verify the increase in growth rate and also the number of leaves on a plant increase the amount of light absorbed together with the increase absorption of carbon dioxide to assist in photosynthesis. The leaf weight increases the accuracy of the net assimilation rate. The leaf area is very important because it is a measure of the photosynthetic active area, and at the same time of the area subjected to transpiration. Leaf dry rate allows the nutritionist to understand the percentage of the leaf which is dry matter and the percentage of the leaf which is moisture (H20). Root length is a controlling variable for water absorption and nutrient intake in the plant. Root dry weight is a measurement parameter by which plant growth is determined. The more roots in the plant there is an increase in the rate of photosynthesis. The shoot length is relatively important in as it determines the growth rate of plants and proves as evidence for the growth of the xylem and phloem vessels. Shoot fresh weight is defined as the weight of the shoot of them time directly after harvest. In table 1, the data obtained was for the fertilizer treatment control of the both crops Zea mays (Corn) and Black eyed beans (Vigna unguiculata). Three plants each were
  • 23. 23 selected at random from the two different species of crops. Each of the plants was analyzed in terms of tissue growth, crop production and the availability of nutrient deficiencies. The mean number of leaves in the corn was 6. The number of leaves in the plant increases the rate of photosynthesis as the increase in the amount of leaves will result in more carbon dioxide and sunlight being absorbed by the leaves. The number of leaves in the plant also affects the transpiration and the amount of water lost from the plant. The mean number of leaves for the black eyed beans was 16.7. In leguminous crops such as the black eyes bean plants there are compound leaves and there are leaflets. The amount of leaves on a plant influences the surface area of plants leading to the increase of gas exchange in the process of photosynthesis. Carbon dioxide is absorbed by the plant for photosynthesis and oxygen is given off as a by-product of photosynthesis. The leaf fresh weight for the black eyed bean plants is a parameter of growth in the tissue and the holistic development of the plant. The mean leaf fresh weight for the black eye plants was 8.8. The leaf fresh weight is determined directly after harvest when the plant is still fresh. The fresh weight of a leaf contains both dry matter and moisture and the dry weight of the leaf contains only the dry matter percentage. The higher the leaf fresh weight the more nutrients and water the leaf contains. The lower the leaf fresh weight the less nutrients and water the leaf contains. The leaf area of a plant measures the relationship between the plant and the environment and determines the growth of the plant tissue. The mean leaf area for the corn plants was 694.5. The mean leaf area for the black eye bean plants was 199.3. Most leaves are broad and so have a large surface area allowing them to absorb more light. A thin shape means a short distance for carbon dioxide to diffuse in and oxygen to diffuse out easily. The smaller the leaf surface area the fewer amounts of carbon dioxide and water is absorbed thus affecting the chemical and biological processes within the plant. The plant microbial processes as a result of the small surface area as microbes may not be able to maintain and sustain life due to a lack of basic nutrients to conduct daily activities. The root length in all plants and trees determine the amount of water and nutrients that are absorbed by the root hairs to assist in the chemical processes within the plant. The mean root length corn was 41.3. The root length the black eye bean plants was
  • 24. 24 14.5. Root length is a variable in plant nutrition that is used to determine nutrient intake and water uptake. The longer the root of the plant there is an increase in root density. Root density is defined as the soil substrata explored by the root system of the plant. The root fresh weight is provided directly after the harvest of plants from the greenhouse. The mean root fresh weight for the corn was 9.28. The mean root fresh weight for the black eye bean plants was 1.41. The fresh weight of the root determines the total root mass that goes through the soil structure. The fresh weight of the root determines the moisture together with the dry matter from the root. The heavier the fresh weight of the root is the higher the water content and dry matter will be. The shoot length is a parameter which describes the growth and development of plants which were used in the experiment. The mean shoot length for the corn was 66. The mean shoot length for the black eye bean plants was 38.1.The increase in shoot length in the incidence of the corn showed that growth and development was taking place in the corn plants over the period of treatment for week 1. The increase in shoot length for the black eye bean plants showed that growth was taking place in the plant which also increased the rate of photosynthesis. The stem fresh weight is determined in the lab was obtained by the weight of stem directly after harvesting from the greenhouse. Directly after the harvesting of the black eye bean plants from the greenhouse the fresh stem weights were taken. The heavier the stem is the more water and dry matter it contains. The lighter the stem is the less water and dry matter it contains. The mean stem fresh weight for the black eye bean plants was 6.8. The stem fresh weight for plant 2 of the black eye bean plants was 7.4. The stem fresh weight for plant 3 of the black eye bean plants was 6.4 In table 2, the data recorded is due to the growth and development of the corn and black eye bean plants under the foliar treatment in week 1. Three samples from each species of plants were collected in the greenhouse. The mean number of leaves collected for the corn was 6.3. The mean number of leaves collected for the black eye bean plants was 18. The fresh weight of the leaves contain both moisture and dry matter. The heavier the weight of the leaf the more moisture and dry matter the leaf contains. The lighter
  • 25. 25 the weight of the leaf the less moisture and dry matter the leaf contains. The leaf weight also affects the surface area which affects the exchange of gases in the atmosphere. The mean leaf fresh weight for the black eye bean plants was 16.92. Leaf area index is the total one‐ sided area of leaf tissue per unit ground surface area. Leaf area affects the exchange of gases in the atmosphere and also contributes to the amount of water lost from the leaves of the plants through the process of transpiration. The mean leaf area for the corn plants was 497.3. The mean leaf area the black eye bean plants was 968.48. The mean root length for the corn plant was 42.8. The mean root length for the black eye bean plants was 11.5. The mean root fresh weight for the corn plants was 7.05. The mean root fresh weight for the black eye bean plants was 2.72. The increase in the shoot length of the plant shows that growth and development is taking place in the structure of the plant. The mean shoot length for the corn plants was 75.7. The mean shoot length for the black eye plants was 48.6. The mean stem fresh weight for the black eye plants was 8.86. In table 3, the data obtained was for the impact of the manure treatment on the growth and development of corn and black eye bean crops. The amount of leaves influences the surface area of the plant. The mean amount of leaves for the corn plants was 6.3. The mean number of leaves for the black eye beans plants was 20. The mean leaf fresh weight for the black eye bean plants was 12.7. Leaf area affects the overall absorption of the basic nutrients in the plants. The mean leaf area for the corn plants was 836.5. The mean leaf area for black eye bean plants was 851.3. The root length may have elementary branches known as root hairs which increase rooting density across the soil. The mean root length for the corn plants is 44. The mean root length for the black eye bean plants is 14.7. The mean root fresh weight for the corn plants is 6.29. The mean root fresh weight for the black eye bean plants is 1.4.
  • 26. 26 The mean shoot length for the corn plants is 73.16. The mean shoot length for the black eye bean plants is 41.5. The moisture and dry matter will affect the weight of the plants and also the general characteristic rate at which photosynthesis occurs in the plant. The mean stem fresh weight for the black eye bean plants is 9.6. In table 4, the data was obtained based on the evidence of growth and development of the corn and black eye plants in the granular treatment. Three corn plants were chosen at random to assist in the destructive analysis process. Three black eye bean plants were chosen at random to assist in the destructive analysis process. The number of leaves for plant 1 in the corn plants is 6. The number of leaves for plant 2 in the corn plants is 5. The number of leaves for plant 3 in the corn plants is 6. The number of leaves for plant 1 in the black eye bean plants is 16. The number of leaves for plant 2 in the black eye bean plants is 18. The number of leaves for plant 3 in the black eye bean plants is 17. Leaf dry mass per unit area is considered to represent the photosynthetic capacity, which actually implies a hypothesis that foliar water mass (leaf fresh weight minus leaf dry weight) is proportional to leaf dry weight during leaf growth. The leaf fresh weight for plant 1 in the black eye bean plants is 10.68. The leaf fresh weight for plant 2 in the black eye bean plants is 15.04. The leaf fresh weight for plant 2 for the black eye bean plants is 5.73. The larger the leaf is the chlorophyll will absorb sunlight and speed up the rate of photosynthesis. The leaf area for plant 1 in the corn plants is 436. The leaf area for plant 2 in the corn plants is 462.5. The leaf area for plant 3 in the corn plants is 457.5. The leaf area for plant 1 in the black eye plants is 404. The leaf area for plant 2 in the black eye plants is 648. The leaf area for plant 3 in the black eye plants is 288. The root length of the plant increases the root area in the ground increasing the process of physical, chemical and biological weathering in the soil. The root length also increases the high incidence of microbial activity in the soil. The more microbes there are in the soil, the higher the soil fertility is. The root length for plant 1 in the corn plants is 40. The root length for plant 2 in the corn plants is 37. The root length for plant 3 in the corn plants is 48. The root length for plant 1 in the black eye bean plants is 12. The root length for plant 2
  • 27. 27 in the black eye bean plants is 16.5. The root length for plant 3 in the black eye bean plant is 12.5. The weight of the roots as it now comes out of the soil is referred to as the root fresh weight. The fresh weight of the root contains moisture together with dry matter in the plant itself. The root fresh weight for plant 1 in the corn plants is 25.23. The root fresh weight for plant 2 in the corn plants is 2.94. The root fresh weight for plant 3 in the corn plants is 4.15. The root fresh weight for plant 1 in the black eye bean plants is 3.37. The root fresh weight for plant 2 in the black eye plants is 3.03. The root fresh weight for plant 3 in the black eye plants is 87. The shoot and the root of the plant play a major role in the surface area of the plant and the amount of nutrients that is absorbed by the plant. The shoot length for plant 1 in the corn plants is 57. The shoot length for plant 2 in the corn plants is 65. The shoot length for plant 3 in the corn plants is 65. The shoot length for plant 1 in the black eye bean plants is 33. The shoot length for plant 2 in the black eye bean plants is 37.2. The shoot length for plant 3 in the black eye bean plants is 38.5. The stem fresh weight for plant 1 in the black eye beans plant is 4.57. The stem fresh weight for plant 2 in the black eye beans plant is 9.22. The stem weight for plant 3 in the black eye beans plant is 3.17. In table 5, the data was recorded for the growth and development of corn and black eye beans plants over the second week of study in the control fertilizer treatment. The destructive analysis was conducted every 7 days (1 week) to determine the growth and progress of the plants. The amount of leaves for plant 1 in the corn plants is 6. The amount of leaves for plant 2 in the corn plants is 6. The amount of leaves for plant 3 in the corn plants is 6. The leaf area for a plant can increase stomata activity depending on its size. The leaf area has a major role to play in the surface area of plants which can affect the processes of evaporation and transpiration. The leaf area for plant 1 of the corn plants is 584.5. The leaf area for plant 2 of the corn plants is 792. The leaf area for plant 3 of the corn plants is 770. . Fibrous roots hold more water and tap roots are used to prevent soil erosion as they are deep anchor roots that burrow deep into the ground. The root length for plant 1 of the
  • 28. 28 corn plants is 38. The root length for plant 2 of the corn plants is 45. The root length for plant 3 of the corn plant is 47. The root fresh weight is determined when the plant is now harvested and the roots are dissected during destructive analysis. The root fresh weight for plant 1 of the corn plants is 8.78. The root fresh weight for plant 2 of the corn plant is 9.63. The root fresh weight for plant 3 of the corn plant is 9.42. The shoot length of a plant is a parameter which shows that growth is taking place. An increase in size of the shoot shows growth of tissue. The shoot length for plant 1 of the corn plant is 65. The shoot length for plant 2 of the corn plant is 68.5. The shoot length for plant 3 of the corn plants is 64.5. In table 6, the data collected by based on growth and development parameters of corn and black eye plants in the foliar treatment. The growth of leaves in the presence of foliar fertilizers will be increased. Nitrogen is an essential nutrient in the structure of the leaf. The number of leaves for plant 1 of the corn plants is 6. The number of leaves for plant 2 of the corn plants is 5. The number of leaves for plant 3 of the corn plant is 6. The leaf area of a plant studies the relationship between the plant and environmental changes. Leaf area optimizes yields in changing climates. The leaf area for plant 1 of the corn plants is 600. The leaf area for plant 2 of the corn plants is 500. The leaf area for plant 3 of the corn plants is 512. The leaf dry weight of a plant is the full dry matter content without the moisture in the leaves. The leaves were dried in the oven to remove the excess water from the leaf surface. The leaf dry weight for plant 1 of the corn plants is 5.42. The leaf dry weight for plant 2 of the corn plants is 5.14. The leaf dry weight for plant 3 of the corn plants is 5.2. The root length of a plant increases the root density of root mass in the soil. The root mass and structure also improves the soil structure and prevents soil erosion. The root length for plant 1 of the corn plants is 38.5. The root length for plant 2 of the corn plants is 44. The root length for plant 3 of the corn plants is 46. Length of a plant is an indicator of the growth and development of a plant. In increase in shoot length there is an increase in the meristematic tissue in the plant increasing elongation. The shoot length for plant 1 of the corn plants is 68. The shoot length for plant 2 of the corn plants is 79. The shoot length for plant 3 of the corn plants is 80. The stem dry weight of a plant is the mass of the stem after moisture extraction in the furnace. The dry
  • 29. 29 weight of a stem shows evidence of growth and development. The stem dry weight of a plant 1 of the corn plants is 4.15. The stem dry weight of a plant 2 of the corn plants is 3.19. The stem dry weight for plant 3 of the corn plants is 4.02. In table 7 the data obtained was for the growth of development of corn plants and black eye bean plants under the manure treatment in the greenhouse. Plants grow better in the manure treatment because manure contains basic micro-nutrients and macro-nutrients that the plants need to conduct daily chemical activities. The number of leaves on plant 1 for the corn plants is 6. The number of leaves for plant 2 of the corn plants is 7. The number of leaves for plant 3 of the corn plants is 6. The leaf area of plant 1 of the corn plants is 1044.5. The leaf area of plant 2 for the corn plants is 858. The leaf area of plant 3 of the corn plants is 607. The leaf dry weight of plant 1 of the corn plants is 5.26. The leaf dry weight for plant 2 of the corn plants is 8.28. The leaf dry weight for plant 3 of the corn plants is 8.26. The root length for plant 1 of the corn plants is 40.5. The root length for plant 2 of the corn plant is 49.5. The root length for plant 3 of the corn plant is 42. The root fresh weight varies greatly depending on the temperature of the environment, the water availability and type of soil. The root fresh weight for plant 1 of the corn plants is 4.21. The root fresh weight for plant 2 of the corn plants is 7.24. The root fresh weight for plant 3 of the corn plants is 7.42. The root dry weight is recorded after the root is placed in the furnace to remove the excess moisture leaving the dry matter in the root alone. The root dry weight for plant 1 of the corn plant is 2.44. The root dry weight for plant 2 of the corn plant is 5.36. The root dry weight for plant 3 of the corn plant is 7.58. The shoot length of plant 1 of the corn plants is 68. The shoot length of plant 2 of the corn plants is 73. The shoot length of plant 3 of the corn plants is 78.5. The stem dry weight for plant 1 in the corn plants is 3.14. The stem dry weight for plant 2 in the corn plants is 5.99. The stem dry weight for plant 3 in the corn plants is 7.56. In table 8 the data obtained was for the growth and development of corn and black eye bean plants in the granular fertilizer treatment. The granular fertilizer is applied directly to the soil in around the area of the root zone.. The number of leaves of plant 1 of the corn
  • 30. 30 plants is 7. The number of leaves for plant 2 of the corn plants is 9. The number of leaves for plant 3 of the corn plants is 9. The number of leaves for plant 1 in the black eye bean plants is 11. The number of leaves for plant 2 in the black eye bean plants is 11. The number of leaves for plant 3 of the black eye bean plants is 11. The leaf fresh weight for plant 1 of the black eye bean plants is 8.65. The leaf fresh weight for plant 2 of the black eye bean plants is 6.79. The leaf fresh weight for plant 3 of the black eye bean plants is 8.35. The larger the leaf area of a plant is the higher the rate of photosynthesis in the plant as the leaves will be able to absorb more sunlight. The leaf area for plant 1 in the corn plants is 916.45. The leaf area for plant 2 in the corn plants is 897.15. The leaf area for plant 3 in the corn plants is 874.37. The leaf area for plant 1 in the black eye plants is 392. The leaf area for plant 2 in the black eye plants is 360. The leaf area for plant 3 in the black eye plants is 412. The leaf dry weight is a parameter which can be studied to determine growth in the plant. The leaf dry weight for plant 1 of the corn plants is 6.61. The leaf dry weight for plant 2 of the corn plants is 3.29. The leaf dry weight for plant 3 of the corn plants is 4.87. The leaf dry weight for plant 1 of the black eye bean plants is 1.22. The leaf dry weight for plant 2 of the black eye bean plants is 1.04. The leaf dry weight for plant 3 of the black eye bean plants is 1.21. The root length increases the root mass of the plant and increases the absorption if minerals and water from the soil according to available capacity. The root length for plant 1 of the corn plants is 26. The root length for plant 2 of the corn plants is 37.3. The root length for plant 3 of the corn plants is 33.5. The root length for plant 1 of the black eye bean plants is 32. The root length for plant 2 of the black eye bean plants is 19. The root length for plant 3 of the black eye bean plants is 28. The root fresh weight for plant 1 in the corn plants is 6.71. The root fresh weight for plant 2 in the corn plants is 8.79. The root fresh weight for plant 3 in the corn plants is 9.81. The root fresh weight for plant 1 in the black eye bean plants is 3.84. The root fresh weight for plant 2 in the black eye bean plants is 2.06. The root fresh weight for plant 3 in the black eye bean plants is 3.17. The root dry weight is determined directly after the roots are placed in the furnace to remove the moisture. The root dry weight for plant 1 of the corn plants is 4.54. The root dry weight for plant 2 of the corn plants is 2.54. The root dry weight for plant
  • 31. 31 3 of the corn plants is 3.97. The root dry weight for plant 1 of the black eye bean plants is 0.31. The root dry weight for plant 2 of the black eye bean plants is 0.26. The root dry weight for plant 3 of the black eye bean plants is 0.72. The shoot length for plant 1 in the corn plants is 87.5. The shoot length for plant 2 in the corn plants is 92.2. The shoot length for plant 3 in the corn plants is 85.6. The shoot length for plant 1 in the black eye bean plants is 60. The shoot length for plant 2 in the black eye bean plants is 51. The shoot length for plant 3 in the black eye bean plants is 67. The stem fresh weight for plant 1 of the black eye bean plants is 3.77. The stem fresh weight for plant 1 of the black eye bean plants is 3.51. The stem fresh weight for the black eye bean plants is 3.35. The stem dry weight for plant 1 of the corn plants is 4.17. The stem dry weight for plant 2 of the corn plants is 2.56. The stem dry weight for plant 3 of the corn plants is 4.18. The stem dry weight for plant 1 of the black eye bean plants is 0.41. The stem dry weight for plant 2 of the black eye bean plants is 0.45. The stem dry weight for plant 3 of the black eye bean plants is 0.49. In table 9, the data was recorded for the growth and development for growth of plants in the control treatment for week 3. The leaf number of plant 1 of the corn plants is 5. The leaf number of plant 2 of the corn plants is 6. The leaf number of plant 3 of the corn plants is 5. The leaf area of plant 1 of the corn plants is 635. The leaf area of plant 2 of the corn plants is 257.5. The leaf area of plant 3 of the corn plants is 462.5. The root length for plant 1 of the corn plants is 44. The root length for plant 2 of the corn plants is 48. The root length for plant 3 of the corn plants is 40. The root fresh weight for plant 1 of the corn plants is 16.5. The root fresh weight for plant 2 of the corn plants is 4.3. The root fresh weight for plant 3 of the corn plants is 4.3. The shoot length of a plant is an indicator of the growth rate in a plant. The shoot length of plant 1 of the corn plants is 87.4. The shoot length of plant 2 for the corn plants is 64.6. The shoot length for plant 3 for the corn plants is 73. In table 10, the data recorded was for the growth and development of plants in the foliar treatment for week 3. The number of leaves for plant 1 of the corn plants was 8. The number of leaves for plant 2 of the corn plants was 6. The number of leaves for plant 3 of the corn plants was 8. The leaf area for plant 1 of the corn plants was 1086.88. The leaf area for
  • 32. 32 plant 2 of the corn plants was 425.69. The leaf area for plant 3 of the corn plants was 1221.78. The root length for plant 1 of the corn plants was 43.4. The root length for plant 2 of the corn plants was 41.3. The root length for plant 3 of the corn plants was 38.9. The root fresh weight for plant 1 of the corn plants was 14.3. The root fresh weight for plant 2 of the corn plants was 3.8. The root fresh weight for plant 3 of the corn plants was 19.1. The shoot length for plant 1 of the corn plants was 99.5. The shoot length for plant 2 of the corn plants was 74.2. The shoot length for plant 3 of the corn plants was 101. In table 11 the data recorded was for the growth and development of plants in a manure fertilizer treatment. The number of leaves for plant 1 of the corn plants was 9. The number of leaves for plant 2 of the corn plants was 8. The number of leaves for plant 3 of the corn plants was 6. The leaf area for plant 1 of the corn plants was 1989.88. The leaf area for plant 2 of the corn plants was 1199.03. The leaf area for plant 3 of the corn plants was 963.95. The root length for plant 1 of the corn plants was 40.2. The root length for plant 2 of the corn plants was 34.5. The root length for plant 3 of the corn plants was 30.3. The root fresh weight for plant 1 of the corn plants was 52.5. The root fresh weight for plant 2 of the corn plants was 40.4. The root fresh weight for plant 3 of the corn plants was 21. The shoot length for plant 1 of the corn plants was 105.8. The shoot length for plant 2 of the corn plants was 108.5. The shoot length for plant 3 of the corn plants was 95. In table 12 the data recorded was for the growth and development of plants in a granular fertilizer treatment. The number of leaves for plant 1 of the corn plants was 7. The number of leaves for plant 2 of the corn plants was 9. The number of leaves for plant 3 of the corn plants was 9. The leaf area for plant 1 of the corn plants was 96.45. The leaf area for plant 2 of the corn plants was 8997.15. The leaf area for plant 3 of the corn plants was 874.37. The root length for plant 1 of the corn plants was 26. The root length for plant 2 of the corn plants was 37.3. The root length for plant 3 of the corn plants was 33.5. The root fresh weight for plant 1 of the corn plants was 52.5. The root fresh weight for plant 1 of the corn plants was 6.7. The root fresh weight for plant 2 of the corn plants was 8.7. The root fresh weight for plant 3 of the corn is 9.8. The shoot length for plant 1 of the corn plants was 87.5. The shoot length for plant 2 of the corn plants was 92.2. The shoot length for plant 3 of the corn plants was 85.6.
  • 33. 33 Conclusion In doing this project/experiment we saw that plants grow differently but yet in the same way when different nutrient sources are supplied to the plant. Though four conditions was used and each have shown productivity in the growth of plant for food production, each types have their cons and pros. In retrospect we can conclude that optimum growth would be a combination of nutrients being up taken through the roots and leaves. Over time manure will continue to break down and condition the soil to make growth much easier. Over all each plant grows well in different conditions. Recommendation/things affected the project  Place plants in bigger bags to maximise root growth and not concealed the dimension of the smaller bag. In addition to help the plant as it grows to stand sturdy and not fall over.  Take the volume of water given to the plants as water plays an important role in dissolving nutrients to make it easier for nutrients to be taken in by the plant.  try to eliminate human error as much as possible  cover plants with netting to avoid pest from affecting them, this may result in stunted growth, spread of disease  Covid-19 caused the project to end for safety purposes therefore data/results were not complete
  • 34. 34 Apendix Symptoms of insect pest and disease on corn and Black eye beans. Symptom Causal agent Symptoms Slight intra- veinal chlorosis Possible mite damage as well Tunnels or blotches. Leaf minor The flies do not directly cause damage. It’s the larva of the fly that’s cause the problem. Larva literally bored their way through the leaf surface leaving tunnels or blotches. Mottling Mite damage on topside of leaf show a stippled appearance to leaf surface causing it to appear with bumps or mottled color. Mites use their mouthparts to pierce plant cells usually from underside of the leaf and suck out the sap. After which dry to brittle discoloration onto leaf appears
  • 35. 35 chlorosis Mite damage underside of leaf chlorosis and leaf margin necrosis Boron toxicity, yellowing of leaf tips and between the veins. Mites use their mouthparts to pierce plant cells usually from underside of the leaf and suck out the sap. After which dry to brittle discoloration onto leaf appears brown necrotic margin and tips mottled spots leaves. Potassium- necrosis of the leaf tips. Potassium deficiency shows brown necrotic margin and tips and mottled spots leaves. Venal Chlorosis Nitrogen deficiency yellowing on lower leaves that begins at the tip and progresses toward the stalk.
  • 36. 36 .extreme Chlorosis Sulphur is essential in protein synthesis. It is also involved in plant photosynthesis and respiration. It is a constituent of some essential amino acids such as cystine and methionine The leaves show thin, yellowish stripes Magnesium leaf tip and leaf blade turns yellowish brown scorching and curling of leaf tips Yellowing between leaf veins. Potassium - Chlorosis starts on the lower leaves on leaf margins progressing towards the midrib with tip and margin dieback