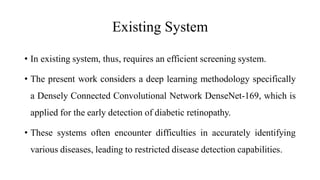
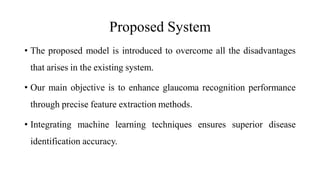
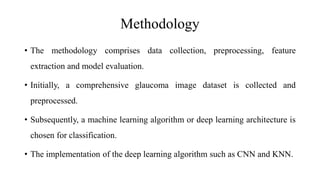
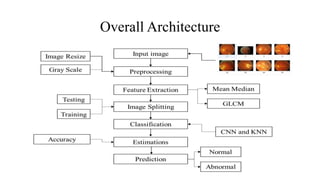
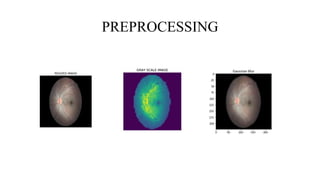
PHASE 2: GLAUCOMA DISEASE
CLASSIFICATION USING DEEP LEARNING
Presented
By
N. ROOBIKA
22MECSE01
Supervisor
Mr. Dr. R. PERUMALRAJA M.E., PHD.,
(HOD/CSE)
Contents
Introduction
Objectives
Existing System
Disadvantages
Literature Survey
Proposed System
Methodology
Overall Architecture
System Requirements
Modules
Performance Metrics
Conclusion
Future Enhancement
Reference
Introduction
• The Leading causes of blindness and low vision in the
United States are primarily age-related eye diseases.
• Eye diseases such as Age-related mascular degeneration
cataract, Diabetic retinopathy, and Glaucoma.
• Other common eye disorders include Amblyopia and
Strabismus.
• The primary focus of this paper is to introduce an
innovative and non-invasive approach for variety of
diseases within the human body using an glaucoma
classification algorithm.
Objectives
The main objective of our project is,
•To predict or to classify the diabetic is
normal or abnormal effectively.
•To predict the type of diabetic.
•To implement the machine and deep
learning algorithm.
•To enhance the overall performance
for classification algorithms.
Existing System
• In existing system, thus, requires an efficient screening system.
• The present work considers a deep learning methodology specifically
a Densely Connected Convolutional Network DenseNet-169, which is
applied for the early detection of diabetic retinopathy.
• These systems often encounter difficulties in accurately identifying
various diseases, leading to restricted disease detection capabilities.
Disadvantages
• When compared with the other methods, the classification accuracy is
low.
• Feature stability is low, so the feature classification rate is low.
• It doesn’t efficient for large volume of data’s.
• Time consumption is high.
Literature Survey
S.
No
Author name Title Published
year
Journal
name
Methodology Observation
1 Deepak
parashar,
Dheeaj
kumar
agrawal.
Automatic
Classification
of Glaucoma
Stages Using
Two-
Dimensional
Tensor
Empirical
Wavelet
Transform.
2021 IEEE
Signal
Processing
Letter
2D-Tensor-
Empirical
Wavelet
Transform
The proposed
method
achieved the
accuracy of
93.65% using
tenfold cross-
validation.
S.
No
Author name Title Published
year
Journal
name
Methodology Observation
4 Luciano
Quaranta,
Ivano Riva,
Chiara
Gerardi,
Francesco
Oddone,
Irene Floiano
Quality of Life in
Glaucoma
2023 IEEE
journal of
bio medical
and health
infomatics
short Form
Health Survey
(SF-36)
Training time is
high.
The accuracy of
96.2%.
5 Faizan
Abdullah,
Rakhshanda
Imtiaz,
Hussain
Ahmad Madni
Glaucoma Disease
Detection Using
Computerized
Techniques
2021 IEEE
Transaction
on medical
imaging
Ostu
thresholding and
global
thresholding
The accuracy of
87.4%.
Proposed System
• The proposed model is introduced to overcome all the disadvantages
that arises in the existing system.
• Our main objective is to enhance glaucoma recognition performance
through precise feature extraction methods.
• Integrating machine learning techniques ensures superior disease
identification accuracy.
Methodology
• The methodology comprises data collection, preprocessing, feature
extraction and model evaluation.
• Initially, a comprehensive glaucoma image dataset is collected and
preprocessed.
• Subsequently, a machine learning algorithm or deep learning architecture is
chosen for classification.
• The implementation of the deep learning algorithm such as CNN and KNN.
Overall Architecture
System Requirements
SOFTWARE REQUIREMENTS:
• Python is utilized as the primary programming language.
• NumPy and Pandas for data processing and analysis.
• ScikitLearn for implementing classical machine learning algorithms.
• Grayscale for image preprocessing.
HARDWARE REQUIREMENTS:
The hardware requirements for this project include a computer with
sufficient processing and illumination system.
Modules
1. INPUT IMAGE:
• The input dataset contains the five types such as:
Mild
Moderate
No DR
Proliferate DR
Severe
• In this step load, the input image by using the
imread() function.
INPUT IMAGE
Modules
2. IMAGE PREPROCESSING:
• In our process, we have to resize the image and convert the image into
gray scale.
• The function doesn't modify the used image instead returns another
image with the new dimensions.
• Convert an image to grayscale using the standard RGB to grayscale
conversion
• In gaussian blur operation, the image is convolved with a gaussian
filter instead of the box filter.
PREPROCESSING
Modules
3. FEATURE EXTRACTION:
• In this step, we can extract the features from pre-processed image by
using mean, median, variance and GLCM.
• The GLCM functions characterize the texture of an image by
calculating how often pairs of pixel with specific values and in a
specified spatial relationship occur in an image, creating a GLCM, and
then extracting statistical measures from this matrix.
FEATURE EXTRACTION
Modules
4. IMAGE SPLITTING:
• In our process, we considered 70% of the input dataset to be the training
data and the remaining 30% to be the testing data.
• Data splitting is the act of partitioning available data into two portions,
usually for cross-validator purposes.
• One Portion of the data is used to develop a predictive model and the other
to evaluate the model's performance.
Image Splitting
Modules
5.CLASSIFICATION:
• In our process, we can implement machine and deep learning such as
KNN and CNN.
• The k-nearest neighbors algorithm, also known as KNN or k-NN, is a
non-parametric, supervised learning classifier, which uses proximity to
make classifications or predictions about the grouping of an individual
data point.
• A CNN is a kind of network architecture for deep learning algorithms
and is specifically used for image recognition and tasks that involve
the processing of pixel data.
Classification
Modules
6. PERFORMANCE ESTIMATION:
• The Final Result will get generated based on the overall classification
and prediction. The performance of this proposed approach is
evaluated using some measures like,
• Accuracy: Accuracy of classifier refers to the ability of classifier. It
predicts the class label correctly and the accuracy of the predictor
refers to how well a given predictor can guess the value of predicted
attribute for a new data.
AC= (TP+TN)/ (TP+TN+FP+FN)
Performance Estimation
Performance of Test And Train Data
Conclusion
• We are developed the machine and deep learning algorithm such as
KNN and CNN. We are extracted the features from pre-processed
image.
• Finally, the results show that accuracy and predict normal or abnormal
effectively. And also predict what type of diabetic.
Future Enhancement
• In future work, we will focus on striking deep learning into other
issues in the ophthalmology field, along with diabetic retinopathy
detection, exudates detection in early stage.
• The structure of the blood vessels and minute changes in pattern will
be exploited.
Reference
• Deepak parashar, Dheeaj kumar agrawal, “Automatic Classification of Glaucoma Stags Using
Two-Dimensional Tensor Empirical Wavelet Transform”, in IEEE ACCESS,2021, pp. 236-244
• Quigley HA, Broman AT, “Diagnosis of diabetic retinopathy using machine learning Techniques ”
IEEE journal of bio medical and health informatics, 2020;52:114–124.
• Robert N. Weinreb, Tin Aung, Felipe A. Medeiros, “The Pathophysiology and Treatment of
Glaucoma”, IEEE Transaction on medical imaging in Springer,vol.9,pp.188960-188124,2015.
• Luciano Quaranta,Ivano Riva,Chiara Gerardi, Francesco Oddone,Irene Floiano, ‘‘Quality of Life in
Glaucoma,’’ IEEE journal of bio medical and health infomatics., vol. 37, nos. 78, pp. 581596,
2023.
• Faizan Abdullah, Rakhshanda Imtiaz,Hussain Ahmad Madni, ‘‘Glaucoma Disease Detection Using
Computerized Techniques,’’ IEEE Transaction on medical imaging, vol. 28, no. 1, pp. 4356, 2021.
Thanks for your kind attention

PHASE 2 GLAUCOMA PPT (2).pdf56255555555555555

  • 1.
    PHASE 2: GLAUCOMADISEASE CLASSIFICATION USING DEEP LEARNING Presented By N. ROOBIKA 22MECSE01 Supervisor Mr. Dr. R. PERUMALRAJA M.E., PHD., (HOD/CSE)
  • 2.
    Contents Introduction Objectives Existing System Disadvantages Literature Survey ProposedSystem Methodology Overall Architecture System Requirements Modules Performance Metrics Conclusion Future Enhancement Reference
  • 3.
    Introduction • The Leadingcauses of blindness and low vision in the United States are primarily age-related eye diseases. • Eye diseases such as Age-related mascular degeneration cataract, Diabetic retinopathy, and Glaucoma. • Other common eye disorders include Amblyopia and Strabismus. • The primary focus of this paper is to introduce an innovative and non-invasive approach for variety of diseases within the human body using an glaucoma classification algorithm.
  • 4.
    Objectives The main objectiveof our project is, •To predict or to classify the diabetic is normal or abnormal effectively. •To predict the type of diabetic. •To implement the machine and deep learning algorithm. •To enhance the overall performance for classification algorithms.
  • 5.
    Existing System • Inexisting system, thus, requires an efficient screening system. • The present work considers a deep learning methodology specifically a Densely Connected Convolutional Network DenseNet-169, which is applied for the early detection of diabetic retinopathy. • These systems often encounter difficulties in accurately identifying various diseases, leading to restricted disease detection capabilities.
  • 6.
    Disadvantages • When comparedwith the other methods, the classification accuracy is low. • Feature stability is low, so the feature classification rate is low. • It doesn’t efficient for large volume of data’s. • Time consumption is high.
  • 7.
    Literature Survey S. No Author nameTitle Published year Journal name Methodology Observation 1 Deepak parashar, Dheeaj kumar agrawal. Automatic Classification of Glaucoma Stages Using Two- Dimensional Tensor Empirical Wavelet Transform. 2021 IEEE Signal Processing Letter 2D-Tensor- Empirical Wavelet Transform The proposed method achieved the accuracy of 93.65% using tenfold cross- validation.
  • 9.
    S. No Author name TitlePublished year Journal name Methodology Observation 4 Luciano Quaranta, Ivano Riva, Chiara Gerardi, Francesco Oddone, Irene Floiano Quality of Life in Glaucoma 2023 IEEE journal of bio medical and health infomatics short Form Health Survey (SF-36) Training time is high. The accuracy of 96.2%. 5 Faizan Abdullah, Rakhshanda Imtiaz, Hussain Ahmad Madni Glaucoma Disease Detection Using Computerized Techniques 2021 IEEE Transaction on medical imaging Ostu thresholding and global thresholding The accuracy of 87.4%.
  • 10.
    Proposed System • Theproposed model is introduced to overcome all the disadvantages that arises in the existing system. • Our main objective is to enhance glaucoma recognition performance through precise feature extraction methods. • Integrating machine learning techniques ensures superior disease identification accuracy.
  • 11.
    Methodology • The methodologycomprises data collection, preprocessing, feature extraction and model evaluation. • Initially, a comprehensive glaucoma image dataset is collected and preprocessed. • Subsequently, a machine learning algorithm or deep learning architecture is chosen for classification. • The implementation of the deep learning algorithm such as CNN and KNN.
  • 12.
  • 13.
    System Requirements SOFTWARE REQUIREMENTS: •Python is utilized as the primary programming language. • NumPy and Pandas for data processing and analysis. • ScikitLearn for implementing classical machine learning algorithms. • Grayscale for image preprocessing. HARDWARE REQUIREMENTS: The hardware requirements for this project include a computer with sufficient processing and illumination system.
  • 14.
    Modules 1. INPUT IMAGE: •The input dataset contains the five types such as: Mild Moderate No DR Proliferate DR Severe • In this step load, the input image by using the imread() function.
  • 15.
  • 16.
    Modules 2. IMAGE PREPROCESSING: •In our process, we have to resize the image and convert the image into gray scale. • The function doesn't modify the used image instead returns another image with the new dimensions. • Convert an image to grayscale using the standard RGB to grayscale conversion • In gaussian blur operation, the image is convolved with a gaussian filter instead of the box filter.
  • 17.
  • 18.
    Modules 3. FEATURE EXTRACTION: •In this step, we can extract the features from pre-processed image by using mean, median, variance and GLCM. • The GLCM functions characterize the texture of an image by calculating how often pairs of pixel with specific values and in a specified spatial relationship occur in an image, creating a GLCM, and then extracting statistical measures from this matrix.
  • 19.
  • 20.
    Modules 4. IMAGE SPLITTING: •In our process, we considered 70% of the input dataset to be the training data and the remaining 30% to be the testing data. • Data splitting is the act of partitioning available data into two portions, usually for cross-validator purposes. • One Portion of the data is used to develop a predictive model and the other to evaluate the model's performance.
  • 21.
  • 22.
    Modules 5.CLASSIFICATION: • In ourprocess, we can implement machine and deep learning such as KNN and CNN. • The k-nearest neighbors algorithm, also known as KNN or k-NN, is a non-parametric, supervised learning classifier, which uses proximity to make classifications or predictions about the grouping of an individual data point. • A CNN is a kind of network architecture for deep learning algorithms and is specifically used for image recognition and tasks that involve the processing of pixel data.
  • 23.
  • 24.
    Modules 6. PERFORMANCE ESTIMATION: •The Final Result will get generated based on the overall classification and prediction. The performance of this proposed approach is evaluated using some measures like, • Accuracy: Accuracy of classifier refers to the ability of classifier. It predicts the class label correctly and the accuracy of the predictor refers to how well a given predictor can guess the value of predicted attribute for a new data. AC= (TP+TN)/ (TP+TN+FP+FN)
  • 25.
  • 26.
    Performance of TestAnd Train Data
  • 27.
    Conclusion • We aredeveloped the machine and deep learning algorithm such as KNN and CNN. We are extracted the features from pre-processed image. • Finally, the results show that accuracy and predict normal or abnormal effectively. And also predict what type of diabetic.
  • 28.
    Future Enhancement • Infuture work, we will focus on striking deep learning into other issues in the ophthalmology field, along with diabetic retinopathy detection, exudates detection in early stage. • The structure of the blood vessels and minute changes in pattern will be exploited.
  • 29.
    Reference • Deepak parashar,Dheeaj kumar agrawal, “Automatic Classification of Glaucoma Stags Using Two-Dimensional Tensor Empirical Wavelet Transform”, in IEEE ACCESS,2021, pp. 236-244 • Quigley HA, Broman AT, “Diagnosis of diabetic retinopathy using machine learning Techniques ” IEEE journal of bio medical and health informatics, 2020;52:114–124. • Robert N. Weinreb, Tin Aung, Felipe A. Medeiros, “The Pathophysiology and Treatment of Glaucoma”, IEEE Transaction on medical imaging in Springer,vol.9,pp.188960-188124,2015. • Luciano Quaranta,Ivano Riva,Chiara Gerardi, Francesco Oddone,Irene Floiano, ‘‘Quality of Life in Glaucoma,’’ IEEE journal of bio medical and health infomatics., vol. 37, nos. 78, pp. 581596, 2023. • Faizan Abdullah, Rakhshanda Imtiaz,Hussain Ahmad Madni, ‘‘Glaucoma Disease Detection Using Computerized Techniques,’’ IEEE Transaction on medical imaging, vol. 28, no. 1, pp. 4356, 2021.
  • 30.
    Thanks for yourkind attention