Downloaded 64 times


![Pharmacokinetic 49
the critically ill given the paucity of
well-
controlled clinical trials in vulnerable
populations.
Pharmacokinetics
Pharmacokinetics refers to the study of the
absorption and distribution of an administered
drug, the chemical changes of the substance in
the body (metabolism), and the effects and
routes of excretion of the metabolites of the
drug (elimination).
Absorption
Absorption is the process of drug transfer from
its site of administration to the blood stream.
The rate and efficiency of absorption depend
on the route of administration. For intrave-
nous administration, absorption is complete;
the total dose reaches the systemic circulation.
Drugs administered enterally may be absorbed
by either passive diffusion or active transport.
The bioavailability (F) of a drug is the fraction
of the administered dose that reaches the sys-
temic circulation. If a drug is administered
intravenously, then bioavailability is 100% and
F = 1.0. When drugs are administered by
routes other than intravenous, the bioavailabil-
ity is usually less. Bioavailability is reduced by
incomplete absorption, first-
pass metabolism
(defined below), and distribution into other
tissues.
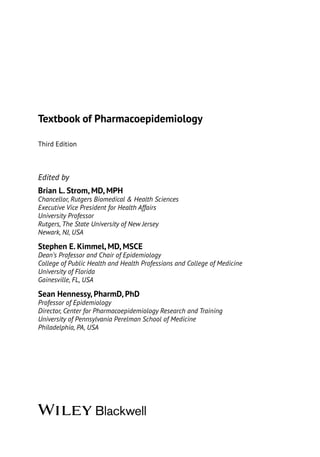
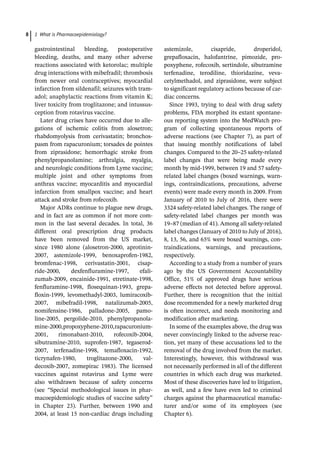
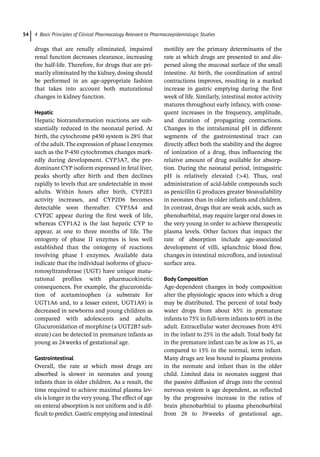
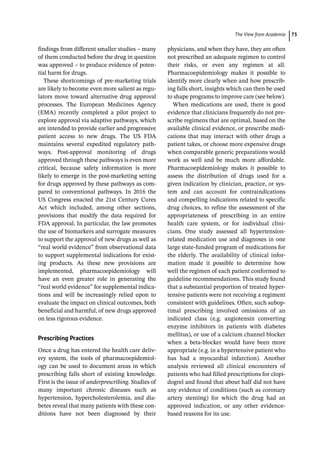
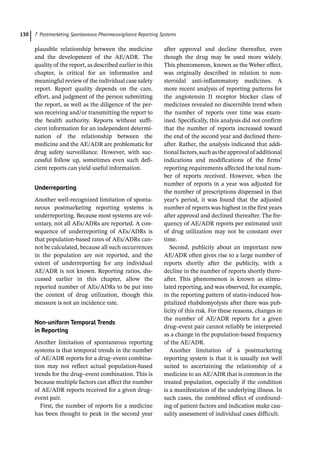
Volume of Distribution
The apparent volume of distribution (Vd) is a
hypothetical volume of fluid through which a
drug is dispersed. A drug rarely disperses solely
into the water compartments of the body.
Instead, the majority of drugs disperse to sev-
eral compartments, including adipose tissue
and plasma proteins. The total volume into
which a drug disperses if it were only fluid is
called the apparent volume of distribution.
This volume is not a physiologic space, but
rather a conceptual parameter. It relates the
total amount of drug in the body to the concen-
tration of drug (C) in the blood or plasma:
Vd = Drug/C..
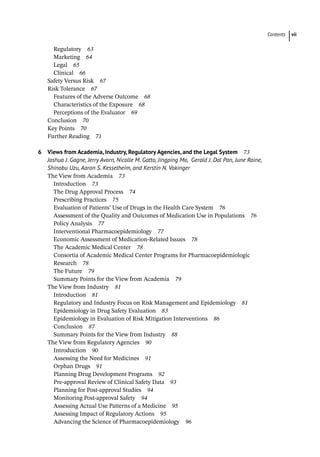
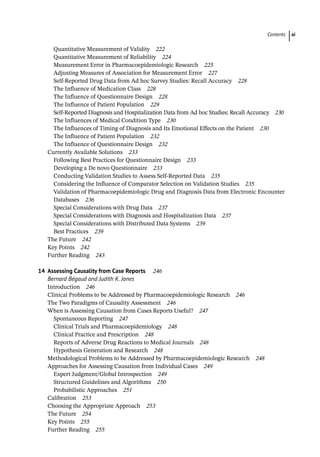
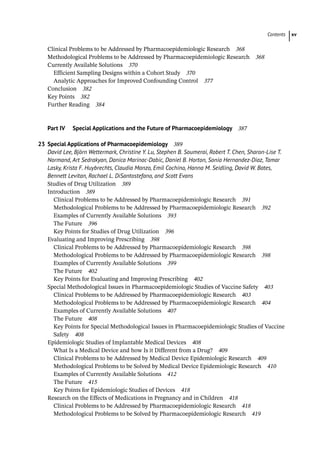
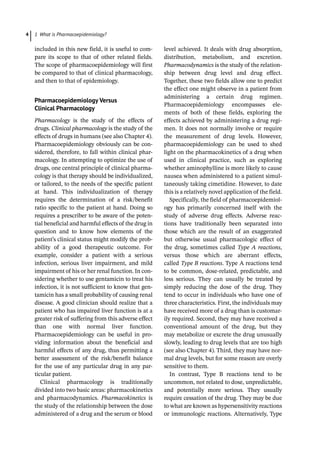
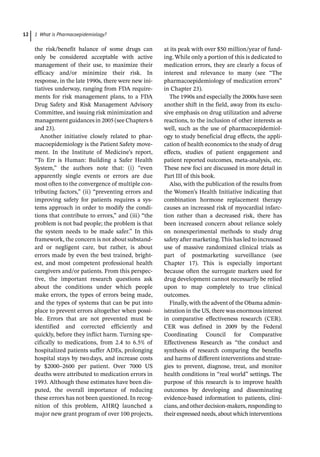
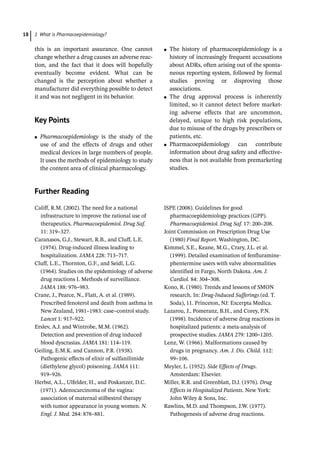
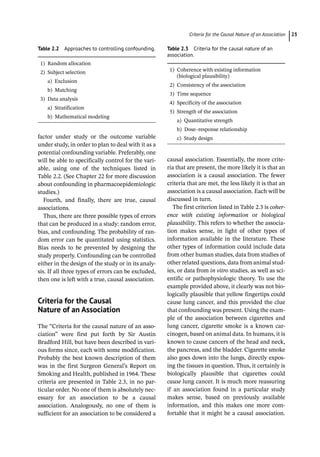
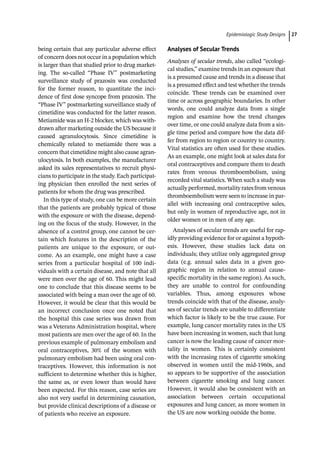
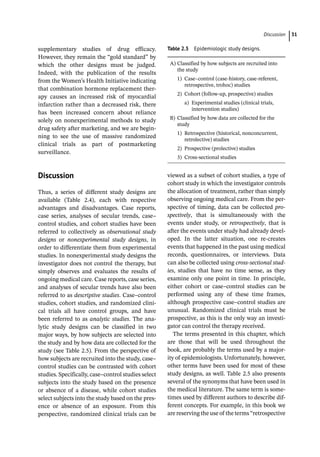
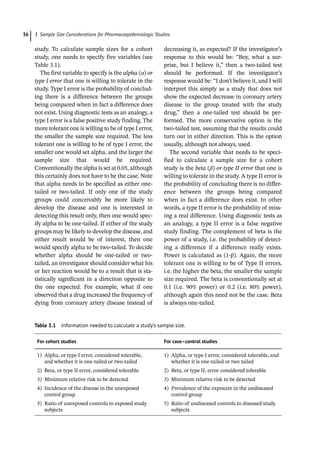
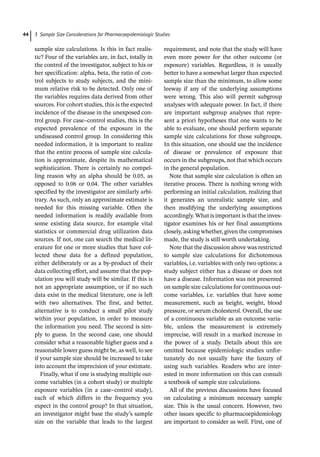
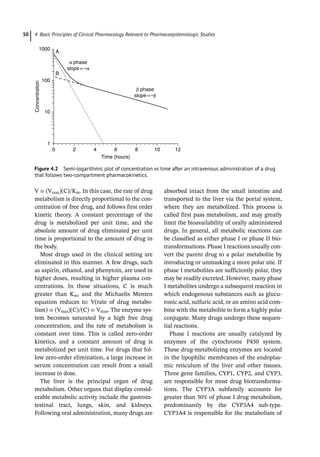
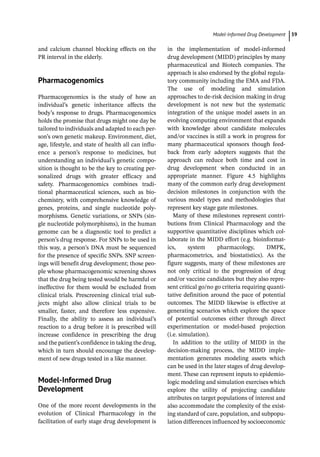
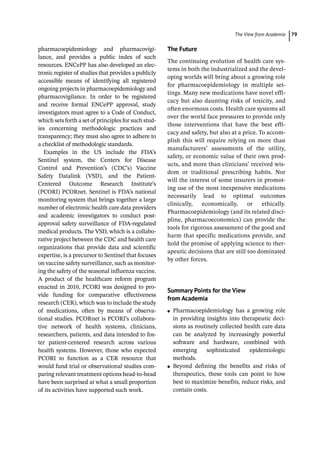
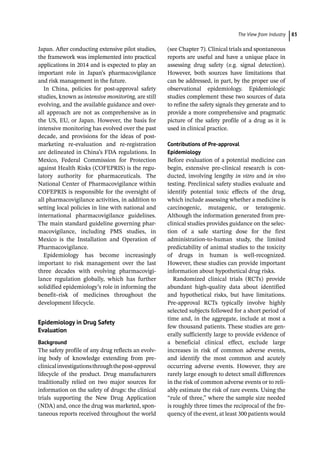
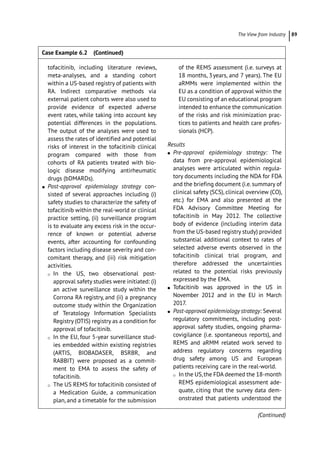
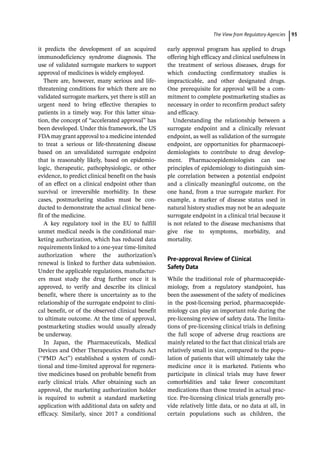
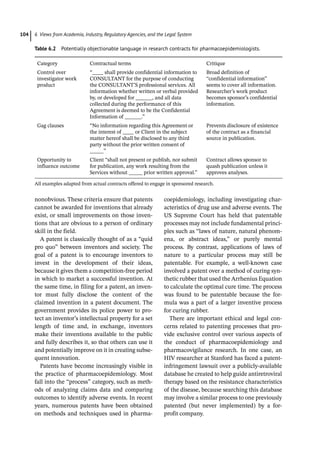
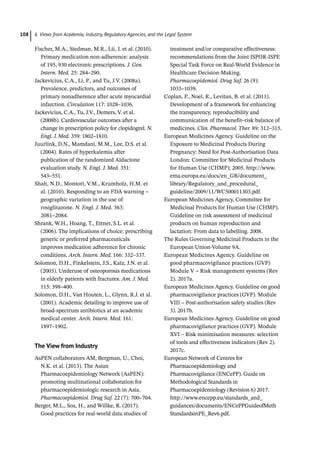
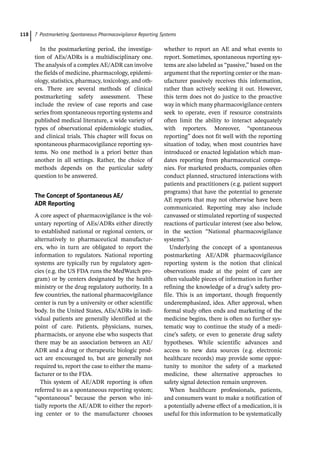
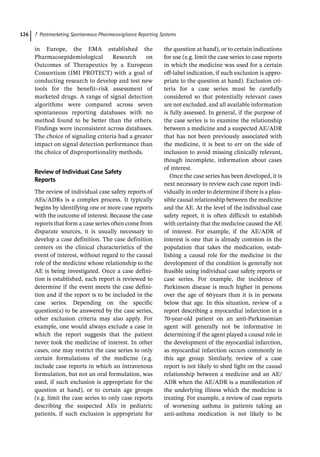
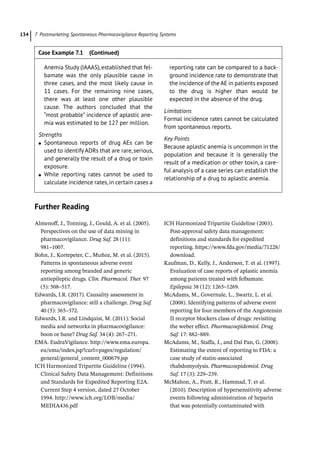
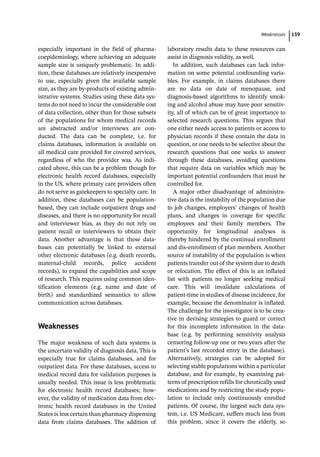
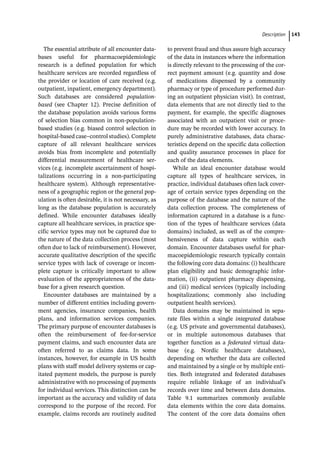
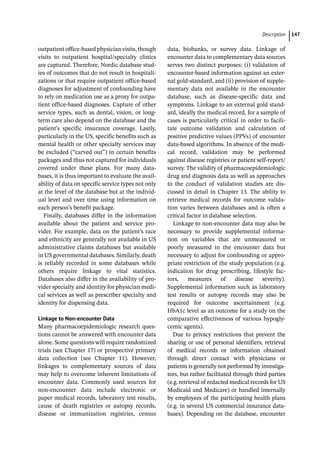
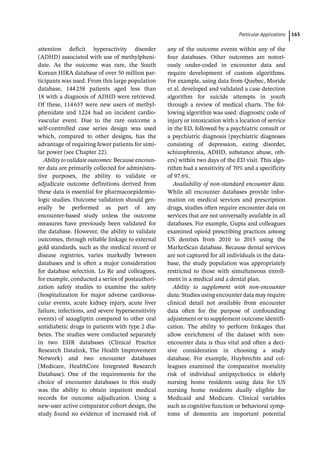
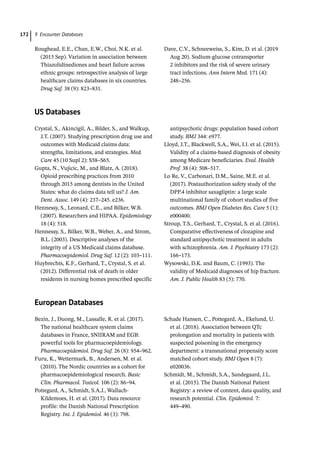
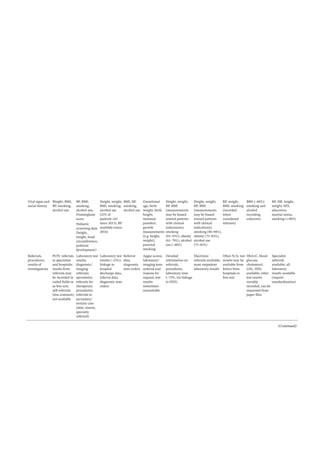
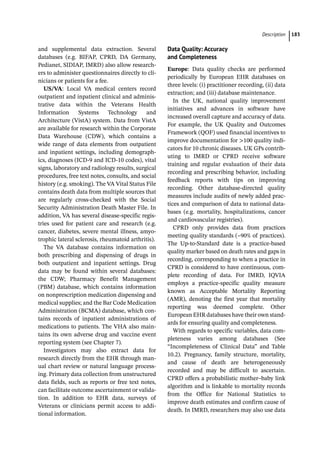
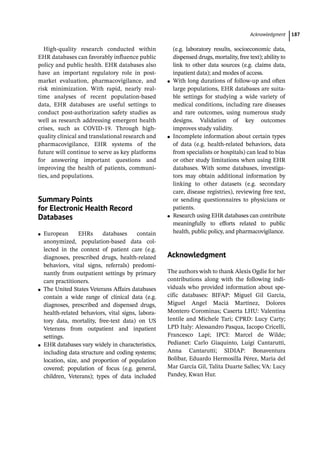
Figure 4.2 represents the fate of a drug after
intravenous administration. After administra-
tion, maximal plasma concentration is
achieved, and the drug is distributed. The
plasma concentration then decreases over
time. This initial alpha (α) phase of drug distri-
bution indicates the decline in plasma concen-
tration due to the distribution of the drug.
Once a drug is distributed, it undergoes metab-
olism and elimination. The second beta (β)
phase indicates the decline in plasma concen-
tration due to drug metabolism and clearance.
The terms A and B are intercepts with the ver-
tical axis. The extrapolation of the β phase
defines B. The dotted line is generated by sub-
tracting the extrapolated line from the original
concentration line. This second line defines α
and A. The plasma concentration can be esti-
mated using the formula: C = Ae −
αt
+Be −
βt
.
The distribution and elimination half lives can
be determined by: t1/2α = 0.693/α and
t1/2β = 0.693/β, respectively.
For drugs in which distribution is homoge-
nous across the various physiologic spaces,
the distinction between the alpha and beta
phase may be subtle and essentially a single
phase best describes the decline in drug
concentration.
Metabolism
The metabolism of drugs is catalyzed by
enzymes, and most reactions follow Michaelis
Menten kinetics: V (rate of drug metabo-
lism) = [((Vmax) (C)/Km)+(C)], where C is the
drug concentration, Vmax is the maximum rate
of metabolism in units of amount of product
over time, typically μmol/min, and Km is the
Michaelis Menten constant (substrate concen-
tration at which the rate of conversion is half
of Vmax) also in units of concentration. In most
situations, the drug concentration is much less
than Km and the equation simplifies to:](https://image.slidesharecdn.com/pe-240724213222-aa326c35/85/Pharmacoepidemiology-pharmacoeconomics-77-320.jpg)


![6 Views from Academia, Industry, Regulatory Agencies, and the Legal System
74
faithfully patients are adhering to the pre-
scribed regimen. Increasingly, more attention
is being paid to assessing the outcomes of med-
ication use on a population level, considering
what its useful and harmful outcomes are
when it is taken by hundreds, thousands, or
even millions of patients rather than by single
individuals in a clinical trial or in routine prac-
tice. It is now widely appreciated that some
adverse events can be identified and their risk
quantified only by observing a drug’s use in
large numbers of patients. The best perspective
on the impact of a medication on the health of
the public requires measuring those outcomes
in the health care system itself, rather than one
person at a time. It is here that the insights of
pharmacoepidemiology are playing an increas-
ingly central role.
Driven by the pressures noted above, this
situation is evolving, with growing apprecia-
tion of several important problems, each of
which can be informed by the methods and
tools of pharmacoepidemiology: (i) medica-
tions that seem acceptably safe on approval
may prove to have important risks which were
under-
appreciated at the time of approval; (ii)
in typical practice, clinicians often make pre-
scribing decisions that do not reflect the best
evidence-
base or guideline recommendations;
(iii) even this evidence base is often thinner
than it should be because head-
to-
head com-
parisons of drug effectiveness or safety – either
trial-
based or observational – have not been
done; (iv) as a result, inadequate information
is available to inform decisions about which
drugs work best, or most cost-
effectively, for
specific indications; and (v) patients fre-
quently fail to take their medications as
directed.
Pharmacoepidemiology is the core discipline
required for a rigorous understanding of each
of these areas, and to guide the development
and evaluation of programs to address them.
Many of these topics are discussed in detail in
the chapters that follow; this chapter provides
an overview of how the field and its methods
can contribute to these larger themes in
medical care delivery and health services
research, from the perspective of academia.
The Drug Approval Process
Each national health care system must grapple
with the following inherent paradox of phar-
macology: A new therapy must be evaluated
for approval when the available data on its
benefits and harms are still modest. Yet wait-
ing until “all the evidence is in” can pose its
own public health threat, if this prevents an
important new treatment from being used by
patients who need it. Since any medication
that is effective is bound to have some adverse
effect in some organ system in some patients at
some doses, any approval must by definition be
based on a judgment that a drug’s efficacy is
“worth it” in light of the known risks of the
treatment. However, the trials conducted by a
given drug manufacturer to win approval are
often powered statistically (see Chapter 3) to
demonstrate success for that single product in
achieving a pre-
specified therapeutic end-
point. Especially when this is demonstration of
superiority over placebo, and/or when the
required endpoint is reaching a surrogate out-
come (e.g. a change in a laboratory test such as
hemoglobin A1c or low density lipoprotein
[LDL] cholesterol), the number of subjects
required for these exercises, and the duration
of the studies, are often inadequate to reveal
important safety problems if they are present.
This is exacerbated by the extensive exclusion
criteria for study participation, a particular
problem for high-
risk populations such as the
frail elderly, pregnant women, and children
(see also Chapter 23).
As a result, additional methods need to be
applied even to pre-
approval data to aggregate
adverse events from multiple study popula-
tions to provide the power needed to assess
safety. Meta-
analysis (see Chapter 20) of
adverse effects data from multiple pre-
approval
trials represents the first opportunity to use
these tools to inform the appropriate use of
medications. This makes it possible to combine](https://image.slidesharecdn.com/pe-240724213222-aa326c35/85/Pharmacoepidemiology-pharmacoeconomics-102-320.jpg)
![The View from Industr 85
pilot and/or user test assessment materials
such as surveys, and generally contribute to
the design and implementation of these pro-
grams. Furthermore, many regulatory
agencies
are utilizing various benefit–risk assessment
frameworks in their reviews. Epidemiologists
can provide inputs or lead both quantitative
and qualitative benefit-
risk assessments such
as multi-
criteria decision analysis (MCDA),
stochastic multicriteria acceptability analysis
(SMAA), and the PhRMA Benefit-
Risk Action
Team (BRAT) framework, among others (see
Chapter 23). Lastly, several accelerated/condi-
tional approval pathways and regulations exist
in the EU, and are anticipated for the US and
other regions, which have requirements for
Real World Data and Evidence (RWD/RWE) to
complement the incomplete or uncertain data
from abbreviated development programs in
areas of high unmet needs. Epidemiologists’
expertise in regulatory-
quality RWD/RWE
generation is often critical to the success of
these accelerated options.
Contributions of Post-
approval
Epidemiology
The need for a post-
approval epidemiology
study can be known and devised pre-
approval
or can arise once a new drug is marketed. Post-
approval signals may come from clinical trial
extension data (e.g. long-
term extension [LTE]
studies), spontaneous reports, published case-
series, or signal detection of electronic health-
care data. Once a drug is marketed,
epidemiologists execute post-
approval com-
mitments (e.g. epidemiology studies, active
surveillance studies, other registries, REMS/
aRMM evaluations, PIP observational studies,
etc.); conduct studies evaluating the effective-
ness of risk mitigation activities; perform sig-
nal detection in existing cohorts (e.g. via
claims or electronic patient record data); and
design and implement new studies as addi-
tional signals arise (e.g. from spontaneous
reports, signal detection or other sources).
Epidemiologists also communicate scientific
findings through oral and poster presentations
at scientific conferences and peer-
reviewed
publications.
Spontaneous reporting systems are the most
commonly used pharmacovigilance method to
generate signals on new or rare adverse events
not discovered in clinical trials (see Chapter 7).
However, there are several important limita-
tions in interpreting spontaneous report data.
Due to the lack of complete numerator (num-
ber of cases) and the need to estimate the
denominator (total number of patients actu-
ally exposed to the drug) data, it is not possible
to determine the incidence of a particular
event from spontaneous reports. Further eval-
uation of an apparent association between a
drug and an adverse reaction usually requires
post-
approval epidemiologic studies.
Likewise, the nature of pre-
approval clinical
trials often necessitates further safety evalua-
tion through post-
approval epidemiology. In
addition to the limited sample size and length
of follow-
up of pre-
approval RCTs, with
respect to drug safety, an additional limitation
of these studies is the common strict inclu-
sion/exclusion criteria. Patients included in
pre-
approval clinical studies may be the
healthiest segment of that patient population.
Special groups such as the elderly, pregnant
women, or children are frequently excluded
from trials. Patients in clinical trials also tend
to be treated for well-
defined indications, have
limited and well-
monitored concomitant drug
use, and are closely followed for early signs
and symptoms of adverse events which may be
reversed with proper treatment.
In contrast, once a drug is marketed, it is
used in a “real-
world” clinical context.
Patients using the drug may have multiple
co-
morbidities for which they are being
treated simultaneously. Patients may also be
taking over-
the-
counter medications, “natu-
ral” remedies, or illicit drugs unbeknownst to
the prescribing physician. The interactions of
various drugs and treatments may result in a
particular drug having a different safety pro-
file in a post-
marketing setting compared to
the controlled premarketing environment.](https://image.slidesharecdn.com/pe-240724213222-aa326c35/85/Pharmacoepidemiology-pharmacoeconomics-113-320.jpg)
![6 Views from Academia, Industry, Regulatory Agencies, and the Legal System
86
An example is the drug mibefradil, which
was voluntarily withdrawn from the market
by the manufacturer after less than a year
as a result of new information about multi-
ple potentially serious drug interactions.
Adherence to medications also often differs
between closely monitored trials and general
post-
approval use, as is the case with
antihypertensives.
Because of the logistical complexity, high
cost, and low external validity, large controlled
trials have not been widely used for the post-
marketing evaluation of drugs. Regulators and
the medical community have communicated a
desire for safety data from the populations that
actually use the drugs in “real-
world” clinical
practice. This has led to a greater emphasis on
the use of observational methods to under-
stand the safety profile of new medications
after they are marketed.
In addition to typical epidemiologic designs,
depending on the specific safety research
hypothesis, epidemiologists design and imple-
ment active surveillance studies, pragmatic
trials (including the most naturalistic version,
the large simple trial [LST]), and self-
controlled designs such as the case-
crossover
study and self-
controlled case series. Active
surveillance studies can be defined as descrip-
tive studies intended to solicit information on
adverse events among a specified population,
such that the numerator and denominator are
as complete as possible, potentially allowing
calculation of incidence.
Purely observational epidemiologic stud-
ies may not always be the most appropriate
method of evaluating safety signals or com-
paring the safety profile of different medica-
tions, especially when there are concerns of
confounding by indication. Confounding by
indication occurs when the risk of an adverse
event is related to the indication for medica-
tion use such that in the absence of the med-
ication, those actually exposed are at higher
or lower risk of the adverse event than those
unexposed. As with any other form of con-
founding, one can, in theory, control for its
effects if the severity of the underlying ill-
ness (i.e. any conditions specified as labeled
indications or contraindications, or included
in the precautions or warnings) can be val-
idly measured (see Chapter 22). Confounding
by indication is more of an issue when a par-
ticular property of the drug is very likely to
affect the type of patient it is used by or pre-
scribed to. In these cases, studies using rand-
omization to treatment may be necessary. A
pragmatic clinical trial (PCT) is an RCT with
one or more pragmatic elements and an LST
is a type of PCT that combines randomiza-
tion to treatment with observational follow-
up of patients. The characteristics of LSTs
are further described in Chapter 17.
Epidemiology in Evaluation of Risk
Mitigation Interventions
Epidemiology not only plays an important role
in evaluation of the drug safety profile pre-and
post-
approval but, as noted earlier, also makes
significant contributions to the evaluation of
the effectiveness of risk mitigation interven-
tion measures (see also Section 23.6). This
component of biopharmaceutical risk man-
agement has grown considerably in the last
decade, with the US, EU, Taiwan, Egypt,
Australia, and a number of other countries
implementing legislation that supports risk
mitigation interventions.
Under FDAAA, the FDA can require a
sponsor to submit a proposed Risk
Evaluation and Mitigation Strategies
(REMS) as part of its initial application if
the FDA finds that a REMS is necessary to
ensure the benefits of the drug or biological
product outweigh the risks. The FDA may
also require a REMS post-
approval based
upon new safety information. FDAAA has
defined this as any information obtained
during the initial review process, as a result
of post-
approval studies, or spontaneous
reports. REMS are intended to be utilized to
reduce known or hypothetical risks when
traditional minimization approaches (i.e.](https://image.slidesharecdn.com/pe-240724213222-aa326c35/85/Pharmacoepidemiology-pharmacoeconomics-114-320.jpg)

![The View from the Legal Syste 101
the alleged injury in the individual plaintiff. In
some cases, like instantaneous allergic reac-
tions, the causal link is clear. For more suba-
cute or later onset responses, however, specific
causation may be hard to demonstrate. For
example, in one case against Merck brought by
a plaintiff who suffered a myocardial infarc-
tion shortly after starting rofecoxib, the manu-
facturer argued that the outcome was
attributable to the plaintiff’s prior existing cor-
onary artery disease. The plaintiff countered
with the fact that he was in a state of stable car-
diovascular health prior to initiation of
rofecoxib and that he simultaneously devel-
oped two coronary artery clots after the drug’s
initiation (a rare presentation for ischemic
heart disease). While the trial court held for
the plaintiff, the decision was reversed on
appeal; the appeals court ruled, “although
plaintiffs were not required to establish spe-
cific causation in terms of medical certainty,
nor to conclusively exclude every other reason-
able hypothesis, because [the plaintiff’s] preex-
isting cardiovascular disease was another
plausible cause of his death, the plaintiffs were
required to offer evidence excluding that cause
with reasonable certainty.”
Pharmacoepidemiologic Expertise and
Daubert
In product liability cases, pharmacoepidemi-
ologists serve as expert witness, helping explain
data about drugs and determine whether risk
information was acted upon appropriately.
Experts usually describe the current state of
knowledge about the adverse event at issue,
and may analyze available data to present
before the court.
As federal Circuit Court Judge Richard Posner
has explained, “the courtroom is not the place
for scientific guesswork, even of the inspired
sort.” Pharmacoepidemiologists seeking to pre-
sent expert evidence in litigation will routinely
face judicial inquiry to determine whether they
are fit to serve in that role. Traditionally, the
judge evaluated whether expert witnesses lack
qualifications or espouse scientific theories out
of step with accepted knowledge. In the 1993
case of Daubert v. Merrell Dow, the US Supreme
Court outlined a number of markers for review-
ing the appropriateness of expert witness testi-
mony, including whether the theory was current
and whether it had been tested or subjected to
peer review and publication. A subsequent case
applied these rules and further refined them in
evaluating a debate over the admissibility of
expert testimony suggesting that polychlorin-
ated biphenyls (PCBs) can cause lung cancer.
The research was excluded because the experts
did not validate their conclusions – the epide-
miologic studies did not report a statistically sig-
nificant causal link between PCBs and lung
cancer, lacked proper controls, and examined
substances other than PCBs. In the US, some
state courts have embraced the Daubert guide-
lines, which have also been taken up by revised
Federal Rules of Evidence; others adhere to a
more basic doctrine that excludes testimony
containing theories that do not enjoy “general
acceptance in the relevant scientific
community.”
Intersection Between Drug Regulation
and Product Liability Litigation
In most countries, when the government regu-
latory authority charged with overseeing sales
of pharmaceutical products approves a drug
for widespread use, the drug comes with an
official drug labeling. The labeling presents a
description of drug’s efficacy, including the tri-
als performed in the premarket period, as well
Table 6.1 Bradford Hill criteria.
1) Strength of association
2) Consistency and replication of findings
3) Specificity with respect to both the substance
and injury at issue
4) Temporal relationship
5) Biological gradient and evidence of a
dose–response relationship
6) Plausibility
7) Coherence
8) Experimental removal of exposure
9) Consideration of alternative explanation](https://image.slidesharecdn.com/pe-240724213222-aa326c35/85/Pharmacoepidemiology-pharmacoeconomics-129-320.jpg)
![The View from the Legal Syste 103
public health findings and changes in health
care delivery.
However, contract research may pose vari-
ous potential concerns, generally centering
around: (i) trial design, (ii) access to data and
data analysis, and (iii) publication of results.
Investigators should be wary of performing
contract research in which the sponsor has
the right to unduly influence the design of the
trial. Many sponsors prefer to retain control
of the data and insert their own statistical
analyses. They argue that such efforts guard
against “investigators [who] want to take the
data beyond where the data should go,” while
investigators argue that this arrangement pro-
vides the company with an opportunity to
“provide the spin on the data that favors
them.” Examples from both government and
industry abound. In the case of rosiglitazone,
a clinical trial organized by the manufacturer
sought to compare the product against other
treatment options for diabetes, and an inde-
pendent academic steering committee was
organized to oversee the data analysis.
Company documents suggest that the clinical
trial database was exclusively controlled by
the company, which provided limited access
to the investigators. When members of the
steering committee questioned the presenta-
tion of the results, their concerns were largely
overlooked.
There have also been numerous conflicts
over so-
called “gag clauses” that prevent con-
tract investigators from publishing their ulti-
mate results. For example, after a University
of Toronto physician identified safety issues
related to an experimental drug used to
treat iron overload in transfusion-
dependent
patients with thalassemia, she was not granted
permission to publish her results. When she
ultimately exposed her findings, she was the
subject of a breach of contract lawsuit from the
sponsor on the basis that her research contract
provided that the published work-
product was
“secret and confidential” and could not be dis-
closed except with the manufacturer’s “prior
written consent.”
For researchers based in academic medical
centers, institutional research administration
offices usually handle the details of contract
negotiation with research sponsors. However,
surveys of academic medical centers have
found that academic institutions routinely
engage in industry-
sponsored research with-
out sufficient protection for investigators. For
example, improper contracts can pass through
such offices that allow contract provisions per-
mitting the research sponsor to insert its own
statistical analyses and draft the manuscript,
while prohibiting investigators from sharing
data with third parties after a trial had ended.
Whether or not they receive support from
research administration offices, pharmacoepi-
demiologists must thoroughly evaluate con-
tracts guiding research for inappropriate
language regarding control of design of the
trial, access to data, and reporting of results
(see Table 6.2). Problematic language includes
overly broad confidentiality clauses, clauses
that define and assign ownership of intellec-
tual property, and clauses that require approval
from a sponsor prior to publication. It may be
reasonable to allow sponsors a limited amount
of time to review proposed publications for
inadvertent release of proprietary company
information or to contribute suggestions based
on their expertise. However, researchers have
an ethical obligation to ensure that contracts
do not unreasonably delay the publication of
potentially important results. Poorly written
contracts can lead to inappropriate secrecy of
results, which can have public health ramifica-
tions, as well as result in litigation against
researcher.
Pharmacoepidemiology
and Intellectual Property Law
A patent is a formal grant of market exclusiv-
ity authorized by the federal government,
lasting for 20years. Patents can be issued for
any process, machine, manufacture, or com-
position of matter. To be worthy of a patent,
an innovation must be useful, novel, and](https://image.slidesharecdn.com/pe-240724213222-aa326c35/85/Pharmacoepidemiology-pharmacoeconomics-131-320.jpg)
![ Further Readin 109
Food and Drug Administration. Guidance for
Industry Postmarketing Studies and Clinical
Trials 2011. https://www.federalregister.gov/
documents/2011/04/01/2011-7707/
guidance-for-industry-on-postmarketing-
studies-and-clinical-trials-implementation-of-
section-505o3.
Food and Drug Administration. Guidance for
Industry and FDA Staff: Best Practices for
Conducting and Reporting
Pharmacoepidemiologic Safety Studies Using
Electronic Healthcare Data. 2013.
Food and Drug Administration. Guidance for
industry: Establishing pregnancy exposure
registries Rockville 2002. http://www.fda.gov/
downloads/Drugs/GuidanceComplianceRegul
atoryInformation/Guidances/ucm071639.pdf.
Food and Drug Administration. Draft Guidance
for Industry: FDA’s Application of Statutory
Factors in Determining When a REMS Is
Necessary. 2016.
Institute of Medicine (IOM). The Future of Drug
Safety: Promoting and Protecting the Health
of the Public 2006. http://www.iom.edu/
Reports/2006/The-
Future-
of-
Drug-
Safety-
Promoting-
and-
Protecting-
the-
Health-
of-
the-
Public.aspx.
International Society for Pharmacoepidemiology
(2008). Guidelines for good
pharmacoepidemiology practices (GPP).
Pharmacoepidemiol. Drug Saf. 17 (2): 200–208.
Ishiguro, C.T.Y., Uyama, Y., and Tawaragi, T.
(2016). The MIHARI project: establishing a
new framework for pharmacoepidemiological
drug safety assessments by the
Pharmaceuticals and Medical Devices Agency
of Japan. Pharmacoepidemiol. Drug Saf. 25:
854–859.
Klungel, O.H., Kurz, X., de Groot, M.C.H. et al.
(2016). Multi-
centre, multi-
database studies
with common protocols: lessons learnt from
the IMI PROTECT project.
Pharmacoepidemiol. Drug Saf. 25 (Suppl 1):
156–165.
Mussen, F., Salek, S., and Walker, S. (2007). A
quantitative approach to benefit–risk
assessment of medicines – part 1: the
development of a new model using multi-
criteria decision analysis. Pharmacoepidemiol.
Drug Saf. 16: S2–S15.
Nyeland, M.E.L.M. and Callréus, T. (2017).
Evaluating the effectiveness of risk
minimisation measures: the application of a
conceptual framework to Danish real-
world
dabigatran data. Pharmacoepidemiol. Drug
Saf. 26 (6): 607–614.
Platt, R., Wilson, M., Chan, K.A., et al. (2009).
The new sentinel network-
-
improving the
evidence of medical-
product safety. N. Engl. J.
Med. 361 (7): 645–647.
Suissa, S., Henry, D., Caetano, P., et al. (2012).
CNODES: the Canadian network for
observational drug effect studies. Open Med. 6
(4): e134–e140.
Wang, S.V., Schneeweiss, S., and On behalf of
the joint ISPE-
ISPOR Special Task Force on
Real World Evidence in Health Care Decision
Making (2017). Reporting to improve
reproducibility and facilitate validity
assessment for healthcare database studies
V1.0. Pharmacoepidemiol. Drug Saf. 26 (9):
1018–1032.
The View from Regulatory Agencies
Braun, M.M., Farag-
El-
Massah, S., Xu, K., and
Cote, T.R. (2010). Emergence of orphan drugs
in the United States: a quantitative assessment
of the first 25years. Nat. Rev. Drug Discov. 9:
519–522. https://doi.org/10.1038/nrd3160.
Fleming, T.R. and Powers, J.H. (2012).
Biomarkers and surrogate endpoints in
clinical trials. Stat. Med. 10: 2973–2984.
https://doi.org/10.1002/sim.5403.
Goedecke, T., Morales, D., Pacarariu, A., and
Kurz, X. (2017 Nov 5). Measuring the impact
of medicines regulatory interventions –
systematic review and methodological
considerations. Br. J. Clin. Pharmacol. https://
doi.org/10.1111/bcp.13469 [Epub ahead of
print].
Hunter, N.L., Rao, G.R., and Sherman, R.E.
(2017). Flexibility in the FDA approach to
orphan drug development. Nat. Rev. Drug](https://image.slidesharecdn.com/pe-240724213222-aa326c35/85/Pharmacoepidemiology-pharmacoeconomics-137-320.jpg)


![Descriptio 117
A reaction, in contrast to an event, is character-
ized by the fact that a causal relationship
between the drug and the occurrence is sus-
pected. If an event is spontaneously reported,
even if the relationship is unknown or
unstated, it meets the definition of an adverse
drug reaction.
The principal difference between an AE and
an ADR is that a causal relationship is sus-
pected for the latter, but is not required for the
former. In this framework, ADRs are a subset
of AEs. In some countries, postmarketing
pharmacovigilance reporting systems are
focused on ADRs, while in others data on AEs
are collected. In the United States, for example,
the scope of reporting requirements is “[a]ny
adverse event associated with the use of a drug
in humans, whether or not considered drug
related . . .”
While many of the principles discussed in
this chapter apply equally to AEs and ADRs,
it is important to understand the distinction
between these two concepts. Specifically,
some databases may contain only ADRs,
while others may contain AEs. These data-
bases may behave differently when used for
data mining. However, because many of the
principles of drug safety surveillance apply
to both AEs and ADRs, we will use the term
“AE/ADR” to refer to these two terms col-
lectively in this chapter, for convenience.
When needed, we will use the individual
terms if a distinction between the two is
required.
Overview of Pharmacovigilance
Reporting Systems
The goal of a postmarketing, or post-
approval, safety program is to identify drug-
related AEs or ADRs that were not identified
prior to a drug’s approval, to refine knowl-
edge of the known adverse effects of a drug,
and to understand better the conditions
under which the safe use of a drug can be
assured.
The scope of pharmacovigilance is broad.
The core activity is usually the identification of
previously unrecognized AEs/ADRs with the
use of the drug. However, it is not sufficient
simply to note that use of a drug can lead to an
AE/ADR. Rather, an investigation into not
only the potential causal role of the drug in the
development of the AE/ADR, but also into
the conditions leading to the occurrence of the
AE/ADR in one person or population and not
in others must be the focus of any postmarket
drug safety effort. Factors such as dose–
response relationships, drug–drug interac-
tions, drug–disease interactions, drug–food
interactions, and the possibility of medication
errors must be carefully considered. A full
understanding of the factors that can lead to an
AE/ADR may yield ideas for effective interven-
tions to minimize the severity or occurrence of
the AE/ADR, and thus enhance the safe use of
the drug. For this reason, the approach to
detecting and understanding clinically impor-
tant AEs/ADRs in the postmarketing period
must be as comprehensive as possible.
The identification of a new safety issue with
a medicinal product often begins with a single
observation. In the postmarketing period, such
observations are usually clinical observations,
often made at the point of care in the course of
clinical practice. A practitioner or patient notes
the development of symptoms or signs that
were not present, or were present in less severe
form, prior to the patient’s using the medicine.
If this sign or symptom is not listed in the
product’s approved labeling, patients and
healthcare professionals may not think to
attribute it to the medicine. If further evalua-
tion reveals a clinically significant process (e.g.
liver injury, rhabdomyolysis, agranulocytosis),
it is important to keep in mind the possibility
of a side effect due to a medication in the dif-
ferential diagnosis of the event. If a medication
side effect is not included in the list of possible
conditions or diseases that could be causing
the observed problem, the patient may not be
treated appropriately.](https://image.slidesharecdn.com/pe-240724213222-aa326c35/85/Pharmacoepidemiology-pharmacoeconomics-145-320.jpg)
![8 Overview of Electronic Databases in Pharmacoepidemiology
138
The quality of disease data in these data-
bases is somewhat less perfect. If a patient is
admitted to a US hospital, the hospital charges
for the care and justifies that charge by assign-
ingdiagnosiscodes(untilrecentlyInternational
Classification of Diseases-
Ninth Revision-
Clinical Modification [ICD-
9-
CM] codes) and
a Diagnosis Related Group (DRG). Hospital
diagnosis codes are reasonably accurate diag-
noses that are used for clinical purposes, based
primarily on the discharge diagnoses assigned
by the patient’s attending physician (of course,
this does not guarantee that the physician’s
diagnosis is correct). The amount paid by the
insurer to the hospital is based on the DRG, so
there is no financial incentive to provide incor-
rect diagnosis codes. In fact, most hospitals
have mapped each set of diagnosis codes into
the DRG code that generates the largest
payment.
In contrast, however, outpatient diagnoses
are assigned by the practitioners themselves,
or by their office staff. Once again, reimburse-
ment in the US does not usually depend on
the actual diagnosis, but rather on the visit
intensity during the outpatient medical
encounter, and the resulting procedure codes
indicate the intensity of the services provided.
Thus, there is no incentive for the practitioner
to provide incorrect diagnosis codes, but there
is also no incentive for them to be particularly
careful or complete about the diagnoses
provided. For these reasons, the outpatient
diagnoses are the weakest link in claims
databases.
Some other databases are not made up of
actual claims, but derive from other adminis-
trative processes, e.g. data from US Health
Maintenance Organizations or other data
sources. The characteristics of these data are
similar in many ways to those of claims data,
and they are discussed together as encounter-
based databases in Chapter 9.
Electronic Health Record Databases
In contrast, electronic health record databases
are a more recent development, arising out of
the increasing use of computerization in med-
ical care. Initially, computers were used in
Medicine primarily as a tool for literature
searches. Then, they were used for billing.
Now, however, there is increasing use of com-
puters to record medical information at the
point of care. In most instances, this is replac-
ing the paper medical record as the primary
medical record. As medical practices increas-
ingly become electronic, this opens up a
unique opportunity for pharmacoepidemiol-
ogy, as larger and larger numbers of patients
are available in such systems. The best-
known
and most widely used example of this
approach is the UK Clinical Practice Research
Database (CPRD), along with the newer data-
base, The Health Improvement Network
(THIN), both described in Chapter 10. As gen-
eral practice databases, these contain primar-
ily outpatient data. In addition, recently there
are inpatient electronic health record data-
bases available.
Electronic health record databases have
unique advantages. Importantly among them
is that the validity of the diagnosis data in
these databases is probably better than that in
claims databases, as these data are being used
to document medical care rather than just for
billing purposes. When performing a pharma-
coepidemiologic study using these databases,
there is no purpose in validating the data
against the actual medical record, since one is
analyzing the data from the actual medical
record. However, there are also unique issues
one needs to be concerned about, especially
the uncertain completeness of the data from
other physicians and sites of care. Any given
practitioner provides only a piece of the care a
patient receives, and inpatient and outpatient
care are unlikely to be recorded in a common
medical record.
Strengths
Computerized databases have several impor-
tant advantages. These include their potential
for providing a very large sample size. This is](https://image.slidesharecdn.com/pe-240724213222-aa326c35/85/Pharmacoepidemiology-pharmacoeconomics-166-320.jpg)
![Descriptio 157
contain clinical data related to hospital dis-
charges from acute or chronic care units, or
rehabilitation centers, as well as day surgeries.
With the exception of Quebec, which main-
tains its own hospital discharge database
(MED-
ECHO), all provinces contribute to the
Discharge Abstract Database (DAD) main-
tained by the Canadian Institute for Health
Information (CIHI). The information is there-
fore homogeneous across provinces. In the
hospitalization databases, diagnosis was coded
with ICD-
9-
CM until 31 March 2006 and with
ICD-
10 thereafter. In the DAD database, infor-
mation on mental health resources, cancer
staging, and reproductive history were added
in 2009–2010. Hospitalization databases are
typically available six months after the end of
the fiscal year (March 31st).
Province-
specific prescription drug data-
bases record all prescription drugs dispensed
in an outpatient setting to individuals covered
by the public drug plan. Drugs acquired out-
of-
pocket/OTC, in-
hospital, long-
term care
units, not included in the formulary, or cov-
ered only by private insurance programs are
not usually included in the database. One
exception is PharmaNet in British Columbia
that links all pharmacies to a central data sys-
tem. Every prescription dispensed in the out-
patient setting is recorded regardless of
coverage; hence, it includes medications cov-
ered by the public drug plan, private insurance
programs, as well as those acquired out-
of-
pocket. Drugs are coded according to the
Canadian-
specific Drug Information Number
(DIN) as well as the American Hospital
Formulary Service (AHFS). For each dispens-
ing, the following information is recorded:
drug (date of dispensing, drug name, dose per
unit, mode of administration, prescribed dura-
tion [the latter is not recorded in
Saskatchewan], cost including dispensing
fees), pharmacist (identifier, pharmacy loca-
tion), and prescriber (identifier, specialty).
Indication for a drug prescription is not
recorded in any of the dispensing databases.
While data and coding systems are similar
across provinces, inclusion of individual drugs
in the formulary and type of listing (general or
restricted) may vary. For each patient, the year
of entry and exit from the drug program are
available in the beneficiary database. This is
important information for studies that include
segments of the population whose member-
ship in the drug program may be transitory,
such as membership based on income or
access to private insurance programs. Only 7
of the 10 Canadian provinces make prescrip-
tion data available for pharmacoepidemio-
logic research. Approximately half of these
databases are accessible through custodians
located in a university setting while the other
half are accessible through provincial govern-
ment agencies. In addition to the drug data-
bases, custodians also act as a repository for
other provincial databases and are responsible
for their linkage.
Database access varies across provinces.
Some provinces (Saskatchewan, Quebec, and
Nova Scotia), provide raw anonymized data-
sets to researchers (from academic or industry
settings) while others (Ontario, BC) require
data to be analyzed in-
house by specific
research organizations. To maintain confiden-
tiality of the data, no patient, healthcare pro-
vider (including pharmacist), or institution
identifiers are transmitted to researchers.
Additional restrictions are in place in individ-
ual provinces. For example, in Quebec only a
random sample of approximately 75% of the
population eligible for a given study (capped at
a maximum of 125000 eligible patients) may
be obtained, and no birthdates are transmitted.
Exceptions can be granted through a request to
the Provincial Access to Information
Commission, which substantially increases
the delay in data extraction. Although
Canadian encounter databases are much
smaller than the US encounter databases, their
greatest advantage is that they include a stable
population, thereby allowing longer follow-
up
periods. This is, for example, illustrated
through a study on benzodiazepines and
Alzheimer’s disease by Billioti de Gage and](https://image.slidesharecdn.com/pe-240724213222-aa326c35/85/Pharmacoepidemiology-pharmacoeconomics-185-320.jpg)
![9 Encounter Databases
158
colleagues, in which a 10 year follow-
up was
available. The time required for database
extraction varies across provinces, ranging
from 10 to 20weeks to 1 year, more if a request
to the Provincial Access to Information
Commission is required.
Access to linked data (prescription, medical
services, hospitalizations) is possible on a pro-
vincial basis. At a national level, the CIHI
houses encounter databases from multiple pre-
scription claims-
level data, from public drug
programs of British Columbia, Alberta,
Saskatchewan, Manitoba, Ontario, New
Brunswick, Nova Scotia, Prince Edward Island,
Newfoundland and Labrador, and Yukon.
These data have been linked at CIHI to the
hospital discharge database (DAD), although
those multi-
province linked data are not acces-
sible to external researchers. In addition, the
IQVIA Private Drug Plan Database houses
adjudicated prescription claims from approxi-
mately 83% of the total private (direct-
pay)
business in Canada. These data are useful for
the conduct of drug utilization studies but are
currently not linked to medical services or hos-
pitalization data.
Encounter Databases in Europe
The Nordic Prescription Databases
The Nordic countries (Denmark, Iceland,
Norway, Sweden, and Finland) have tax-
supported universal health coverage. All citi-
zens (a combined population of over 25 million
people ranging from ~300000 in Iceland to
more than 9 million in Sweden) are provided
with unrestricted access to health services
including partial or complete reimbursement
of medications. Pharmacies electronically sub-
mit information on dispensed prescriptions to
national databases without a requirement for
informed consent by the patient (available
since 1994 in Finland and Denmark, since
2004 in Norway, since 2005 in Sweden, and
since 2006 in Iceland). Unique civil registra-
tion codes facilitate unambiguous linkage to
various national databases using a central
patient router file. Linkable national databases
include but are not limited to hospital dis-
charge databases, laboratory data including
results, pathology databases, medical birth
databases, cancer registries, and cause of death
databases, as well as census data, health sur-
veys, biobanks, and patient records. Together,
these databases create a federated database
network that provides exposure information
from the prescription database as well as
patient and clinical outcome data from the
patient router file and multiple linked autono-
mous databases.
The prescription databases largely include
similar data elements with slight variations
between countries. Besides a patient identifier
(which also encodes birth year and sex), data
includes drug data (dispensing date, Nordic
article number, a unique identifier similar to
the NDC code used in the US, Anatomical
Therapeutic Chemical [ATC] classification,
quantity dispensed in defined daily doses), a
prescriber identifier (which can be linked to
prescriber data such as basic demographics,
profession, specialty, practice site), and phar-
macy data (name and location). OTC drugs are
not included unless they are obtained via pre-
scription. Importantly, some drugs that are
also available OTC are used primarily via pre-
scription, to ensure reimbursement. Besides
the difference in the age of the databases, the
most noticeable difference is the fact that non-
reimbursed drugs are not covered by the
Finnish database.
Outcome data are primarily based on
national hospital discharge databases (regis-
tries). While comparable, some differences
exist in the age of the patient databases with
the Finnish database dating back to 1969, fol-
lowed by the Danish (1977), Swedish (1987),
and Norwegian registry (2008). Numerous
other databases including cancer, birth, and
death, together with pathology and laboratory
results further complement the dataset.
Importantly, no large-
scale data are available
that provide details regarding general practice
visits or other non-
hospital health services.
This is often referred to as a lack of “ou
tpatient”](https://image.slidesharecdn.com/pe-240724213222-aa326c35/85/Pharmacoepidemiology-pharmacoeconomics-186-320.jpg)
![9 Encounter Databases
168
●
● In Canada, there is no single national linked
encounter database. Owing to the structure
of the healthcare system, each province and
territory maintains encounter databases that
include prescription and medical services
claims of the public healthcare programs,
which can be linked to hospital discharge
data.
●
● All Canadian residents are covered for medi-
cal services regardless of age or income.
However, drug coverage varies between
provinces and access to raw data is also
restricted in some provinces; these aspects
are important to consider in the selection of
a Canadian database.
●
● Owing to coverage characteristics, patients
can be followed long term in Canadian
databases.
●
● The Nordic countries provide nationwide
coverage of prescription fills with easy link-
age to other health registries on, e.g.
hospitalizations.
●
● Multiple other countries throughout Europe
hold data sources covering sizeable propor-
tions of the population, e.g. Italy, Germany,
France, United Kingdom, and Holland.
●
● Many long established databases in the Asia-
Pacific region cover high proportions of the
population due to single-
payer, nationwide
healthcare coverage.
●
● Despite variation in healthcare systems and
languages used throughout the region many
of the databases conform to world standard
medical vocabularies such as the WHO ATC
classification system for medicines and ICD-
10 codes for diagnoses.
●
● Use of Asian databases have historically
been limited due to restrictions in the acces-
sibility of these data. Access to databases
may only be provided to local researchers
while other databases do not provide direct
success to raw data with only summary level
data available for researchers.
Case Example 9.1 US Commercial Insurance Databases (Dave et al. 2019)
Background
●
● Sodium–glucose cotransporter-
2 inhibi-
tors (SGLT2i) are a class of antidiabetic
medications that reduce serum glucose by
inhibiting its reabsorption in the proximal
tubule.
●
● Based on their mechanism of action, they
are thought to increase the risk of severe
Urinary Tract Infections (UTIs); however,
findings from case-
reports and meta-
analysis of randomized controlled trials
are inconclusive.
Question
Are type 2 diabetes patients initiating an
SGLT2i at a higher risk of developing severe
UTIs compared to those initiating non-
SGLT2i therapies?
Approach
●
● Aretrospective cohort studywas
conducted
using the two US based commercial claims
databases: IBM MarketScan and Optum
Clinformatics Datamart between March
2013 to September 2015.
●
● Within each database, patients aged
18years or older with type 2 diabetes ini-
tiating SGLT2i versus dipeptidyl pepti-
dase-
4 (DPP4i) were identified and
matched using 1:1 propensity score
matching using 90 baseline covariates.
●
● The primary outcome was a severe UTI
event, defined as a composite outcome of
hospitalization for primary UTI, sepsis with
UTI, or pyelonephritis. Hazard ratios (HR)
were estimated using Cox regression.
Results
●
● After 1:1 propensity score matching, the
study identified 61876 patients in each
group.
●
● New initiators of SGLT2i had 61 severe
UTI events (incidence rate [IR] per 1000](https://image.slidesharecdn.com/pe-240724213222-aa326c35/85/Pharmacoepidemiology-pharmacoeconomics-196-320.jpg)
![Key Point 169
Case Example 9.2 Canada (Faure et al. 2020)
Background
●
● Despite the existence of clear clinical rec-
ommendations, previous studies have
shown that 19–50% of patients who expe-
rienced an acute ischemic stroke (AIS) do
not receive secondary prevention, consist-
ing mainly of antiplatelet therapy (e.g.
dipyridamole, clopidogrel, acetylsalicylic
acid (ASA), or ticlopidine), or anticoagu-
lants (e.g. vitamin K antagonist (VKA) or
nonvitamin K antagonist oral anticoagu-
lants (NOAC)).
●
● Although the efficacy of pharmacological
secondary prevention has been demon-
strated in clinical trials, evidence gaps
remain regarding the effectiveness of sec-
ondary prevention in the real-
world clini-
cal practice setting; available data are
either not recent, involved a short-
term
follow-
up (e.g. 30days), or restricted to
specific subpopulations.
Questions
●
● What are the patterns of secondary stroke
prevention treatments in the real-
world
clinical practice setting?
●
● What is the long-
term effect of secondary
stroke prevention on the risk of death or
AIS recurrence?
Approach
●
● Population-
based cohort study of adult
patients (age≥18years) who were dis-
charged following a hospitalization for an
incident AIS between January 1, 2011, and
December 31, 2012 and who survived
beyond the short-
term period (30days).
Data sources were the linked prescription
and medical services claims databases of
Quebec (RAMQ databases).
●
● The main study outcome was the compos-
ite of death or AIS recurrence between
31 and 365days post discharge. Cox
person-
years, 1.76), compared with 57
events in the DPP-
4 inhibitor group (IR,
1.77), corresponding to an adjusted HR of
0.98 [95% confidence interval, 0.68–1.41]).
Strengths
●
● This cohort study utilized a large, diverse
cohort of patients with diabetes from two
commercial insurance databases.
●
● The study was able to follow patients for
longitudinal exposures and important
clinical outcomes, including hospitaliza-
tions due to severe UTIs.
Limitations
The small number of outcomes precluded
detailed evaluation of the associations
between individual agents and the risk of
diabetes. Although the study adjusted for
more than 90 potential confounders, it could
not directly control for important variables
such as duration of diabetes or body mass
index.Hemoglobin A1c results were available
for 15% of sample further limiting the study
ability to adjust for diabetes severity.
Key Points
●
● In this large population-
based cohort
study of patients with type 2 diabetes,
SGLT2i was not associated with an
increased risk of severe UTIs. On the basis
of our findings, other factors beyond the
risk of severe UTIs should be considered in
decisions about whether to prescribe
SGLT2i for patients with diabetes in rou-
tine care settings.
Case Example 9.1 (Continued)
(Continued)](https://image.slidesharecdn.com/pe-240724213222-aa326c35/85/Pharmacoepidemiology-pharmacoeconomics-197-320.jpg)
![9 Encounter Databases
170
proportional hazard models were used to
compare the risk of death or AIS recur-
rence across treatments using no pre-
scribed treatment as the reference. In
order to account for treatment switches
and discontinuation during follow-
up,
exposure was time-
dependent.
Results
●
● In the month after discharge, 44.3% of the
patients did not receive the recommended
treatment and20% did not have any
treatment.
●
● Untreated patients were younger, had less
comorbidities, and a more severe index AIS
(using hospital length of stay as a proxy for
severity).
●
● Anticoagulants and antiplatelets were
associated with a lower risk of death or
recurrence (hazard ratio [HR] 0.27; 95%
confidence interval [CI] 0.20–0.36 and HR
0.25; 95% CI 0.16–0.38, respectively) com-
pared with the untreated group.
Strengths
●
● This was a population-
based study that
reflected current prescription patterns for
secondary AIS prevention in the commu-
nity practice setting.
●
● Compared with previous studies that were
mainly limited to the short-
term period
after a stroke, treatment effectiveness was
evaluated over a one-
year period.
●
● The use of a time-
dependent exposure
variable accounted for treatment hetero-
geneity during follow-
up.
Limitations
●
● Information on drugs acquired OTC were
not available, which may have overesti-
mated the proportion of untreated patients
owing to the availability of ASA OTC.
However, for cost consideration, patients
chronically treated favor acquiring ASA by
prescription.
●
● Absence of data on previous AIS events
that predated the one year look back
period may have resulted in misclassifica-
tion of incident cases.
Key Points
●
● The risk of death or AIS recurrence was
reduced by 50–75% in patients receiving a
secondary prevention treatment when
compared with the untreated patients.
●
● Findings confirm treatment benefits
shown in clinical trials and emphasize the
importance of AIS secondary prevention.
Case Example 9.2 (Continued)
Case Example 9.3 Encounter Databases in Asia (Roughead et al. 2015)
Background
Thiazolidinediones (rosiglitazone and piogl-
itazone), are associated with heart failure
and edema. Many of the published studies
investigating these adverse events were
conducted in caucasian populations. Due to
the differences in metabolizing enzymes and
pharmacodynamic-
based variation in
response to the thiazolidinediones there
may be a difference in the prevalence of
adverse events across different ethnic
groups.
Questions
Do the risks of heart failure and edema asso-
ciated with the thiazolidinediones vary
between populations located in Asia,
Australia and Canada?
Approach
●
● Sequence symmetry analysis (SSA), a sig-
nal detection method for adverse drug
events utilizing administrative claims data,
was used to assess the association
between the thiazolidinediones and](https://image.slidesharecdn.com/pe-240724213222-aa326c35/85/Pharmacoepidemiology-pharmacoeconomics-198-320.jpg)
![Textbook of Pharmacoepidemiology, Third Edition. Edited by Brian L. Strom, Stephen E. Kimmel, and Sean Hennessy.
© 2022 John Wiley Sons Ltd. Published 2022 by John Wiley Sons Ltd.
174
Introduction
Electronic health record (EHR) databases are
longitudinal patient record databases that are
used by clinicians in caring for their patients
and anonymized for the purpose of research.
They often record information unavailable in
administrative databases, such as symptoms of
illness, historical data, family history, smoking
and alcohol use, vital signs (e.g. body mass
index [BMI]), and laboratory data. Further,
EHR data recorded in the provision of patient
care may more accurately represent patients’
true clinical states than administrative claims
data, which are maintained primarily for bill-
ing or administrative purposes.
Despite their advantages, EHR databases
have certain limitations. Certain available data
may have high rates of missingness (e.g. race,
disease severity, smoking history). The validity
of diagnostic codes cannot be presumed with-
out formal validation. Some EHR databases,
including the Veterans Affairs (VA) and other
US EHRs, may not capture information from
out-
of-
system care. Other EHR databases,
including some from Europe, may lack data
from secondary care (e.g. hospitals and special-
ists) or linkage to these datasets. While EHR
databases usually contain data on prescribed
outpatient drugs, many lack information on
drug dispensing or inpatient medications.
In this chapter, we focus on selected
European primary care EHR databases and a
national EHR database for United States
Veterans. While there are similarities among
EHR databases, there are also important differ-
ences (see Tables 10.1 and 10.2).
Description
Overview of Health Care Systems
and Populations
Europe: Many European nations (e.g. Italy,
Netherlands, UK) have either universal
government-
funded health care or universal
health insurance. General practitioners (GPs),
and sometimes family pediatricians, act as
gatekeepers for medical care in many coun-
tries. As a result, many European primary
10
Electronic Health Record Databases
Daniel B. Horton1
, Harshvinder Bhullar2
, Francesca Cunningham3
, Janet Sultana4
,
and Gianluca Trifirò5
1
Rutgers Robert Wood Johnson Medical School, Rutgers Center for Pharmacoepidemiology and Treatment Science, Rutgers School of
Public Health, New Brunswick, NJ, USA
2
Independent Consultant, London, UK
3
US Department of Veterans Affairs, Hines, IL, USA
4
Mater Dei Hospital, Msida, Malta and Exeter College of Medicine and Health, University of Exeter, Exeter, UK
5
Department of Diagnostics and Public Health, University of Verona, Verona, Italy](https://image.slidesharecdn.com/pe-240724213222-aa326c35/85/Pharmacoepidemiology-pharmacoeconomics-202-320.jpg)
![Descriptio 181
care-
based EHR databases capture most of
their patients’ health information, including
data from specialty and secondary care (e.g.
consultations, hospitalizations). European
EHR databases may contain regional or nation-
wide data, depending on the structure of the
health care system and the database. Notably,
EHR databases from countries where GPs have
less of a gatekeeper role (e.g. France, Germany)
have less complete records of patients’ health
information.
US/VA: The VA’s Veterans Health
Administration (VHA) is one of the largest
integrated health care systems in the United
States. Funded by the US government, the VA
provides medical, surgical, and rehabilitative
caretomilitaryVeterans,activedutyReservists,
and National Guard across nearly 150 hospi-
tals, 1200 outpatient clinics, and100 nurs-
ing homes organized within 18 regional
integrated networks. In contrast to the general
US population, the VA population consists of
predominantly older men (87% male, 47% over
age 65 as of 2017) who often have multiple
chronic medical or mental health conditions,
although the proportion of younger female
Veterans is rising. Most medications within the
VHA are prescribed by VA clinicians and dis-
pensed by VA pharmacies. Dual-
care Veterans
with Medicare coverage (which covers virtu-
ally all US citizens aged 65years and older)
may receive medications through both the VA
and the Medicare Part D Plan. Because the
VHA is not a closed medical system, Veterans
may receive out-
of-
network care, limiting one’s
ability to study certain outcomes (See
“Incompleteness of Clinical Data” below).
Overview of Databases
Europe: The UK was the setting of the first
European EHR database, now called the
Clinical Practice Research Datalink (CPRD)
(formerly General Practice Research Database
[GPRD]), a research service of the UK
Government that was established in 1987 for
conducting public health research. CPRD
encompasses two datasets – CPRD Gold from
practices across the UK, and CPRD Aurum
predominantly from English practices – which
collectively contain data from about 25% of the
UK population and represent one of the largest
European EHR databases. IQVIA Medical
Research Data (IMRD) (formerly The Health
Improvement Network [THIN]) was later
established as a collaboration between soft-
ware and database companies (respectively,
Cegedim and Epic Database Research
Company Ltd., now part of IQVIA). The same
practices may contribute to both CPRD and
IMRD, but the proportion of overlap changes
over time as new practices join or leave each
database. Information from both databases
may be combined to increase sample size and
improve statistical power and generalizability.
Merging data between CPRD and IMRD
requires identification and singular inclusion
of practices contributing to both databases in a
given year.
The IQVIA Disease Analyzer databases
(DA, previously known as Mediplus) contain
anonymized patient records from primary
care practices and office-
based specialists
(e.g. cardiologists, dermatologists, gynecolo-
gists, orthopedists) in France, Germany, and
the UK. To preserve confidentiality, patients
who see both GPs and specialists have differ-
ent database identity codes, making it chal-
lenging to track patients across settings of
care.
Italy’s Health Search Longitudinal Patient
Database (LPD Italy from IQVIA) is the coun-
try’s largest EHR database. The Caserta Local
Health Unit (LHU) database contains EHR
data from approximately 60% of inhabitants in
a province of southern Italy and represents the
only Italian database that systematically links
EHR and administrative claims data, including
drug dispensing and hospital discharge data.
Caserta LHU data may also be linked to com-
prehensive, multi-
dimensional geriatric
assessments for almost three-
quarters of the
local elderly population, making it valuable for
geriatric research. Another Italian database,](https://image.slidesharecdn.com/pe-240724213222-aa326c35/85/Pharmacoepidemiology-pharmacoeconomics-209-320.jpg)
![10 Electronic Health Record Databases
182
Pedianet, contains data on over 400000 chil-
dren throughout Italy.
In Spain, Base de Datos para la Investigación
Farmacoepidemiológica en Atención Primaria
(BIFAP) contains primary care data from 9 of
17 autonomous communities representing
nearly 20% of the Spanish population. Sistema
de Información para el Desarrollo de la
Investigación en Atención Primaria (SIDIAP)
contains data from 85% of the population of a
single autonomous community, Catalonia.
GPs across the Netherlands contribute data to
Integrated Primary Care Information (IPCI, pre-
viously Interdisciplinary Processing of Clinical
Information), which contains data from approx-
imately 14% of the Dutch population.
US/VA: The VA database contains demo-
graphic, clinical, and administrative data since
1997 along with prescription data since 1999 and
laboratorydatastartingin2000.In2017,thenum-
ber of Veterans in the VA database was about 2%
of the US population and 32% of US Veterans.
Data Collection and Structure
Europe: Primary care practitioners use EHRs
to document clinical information about their
patients, which can then be electronically
extracted for research purposes, examined for
completeness and accuracy, and anonymized.
Some EHR databases receive frequent data
updates (e.g. Pedianet, CPRD, IMRD) while
others receive data updates just one to two
times per year (e.g. BIFAP, IPCI, LPD Italy).
Primary care EHR databases generally contain
a minimum common set of patient informa-
tion, including demographics, medical diagno-
ses, and drug prescriptions, but they differ
from one another in types of variables and data
included (see Table 10.2).
European EHR databases record diagnoses
using a variety of standardized coding systems:
Read codes (IMRD, CPRD); International
Classification of Diseases, 9th edition (ICD-
9)
(Caserta LHU Caserta, one autonomous region
in BIFAP, LPD Italy, Pedianet); ICD-
10 (IQVIA
DA, SIDIAP, Pedianet, Hospital Episode
Statistics [HES] data linked with CPRD and
IMRD); and the International Classification of
Primary Care (ICPC) (IPCI, most autonomous
regions in BIFAP) (see Table 10.1).
The European EHR databases also vary in
how they record drug data. CPRD and IMRD
employ British National Formulary (BNF)
codes through the Gemscript system. Non-
UK
European databases record medications using
Anatomical Therapeutic Chemical (ATC) clas-
sification codes; most countries also have
national drug codes. All European EHR data-
bases discussed contain data on prescribed
medications. Caserta LHU, BIFAP, Pedianet,
and SIDIAP also contain drug dispensing data.
Additionally, Caserta LHU, BIFAP, Pedianet,
and (for roughly half of drugs) DA databases
specify drug indications.
All the above databases are generally repre-
sentative of their underlying populations in
terms of age/sex distribution and prevalence of
most diseases and drugs used. However, cer-
tain diseases may vary in frequency across
databases depending on local or disease-
specific patterns of clinical care. BIFAP, CPRD,
DA France and Germany, IPCI, Pedianet, LPD
Italy, and IMRD include most regions of their
respective countries.
Hospitalizations, referrals, and the resulting
consultation letters are recorded to varying
degrees in European EHR databases (see
Table 10.2). Data from social history, including
smoking and alcohol usage, is available to var-
ying extents in most EHR databases See “Data
Quality: Accuracy and Completeness” below
and Table 10.2). Substance exposure informa-
tion is less consistently recorded in DA data-
bases and IPCI. Pedianet contains information
on parental smoking habits.
In most European EHR databases, data are
more commonly recorded using structured
(coded) fields rather than unstructured free
text. BIFAP and IPCI also contain large vol-
umes of unstructured data. These and certain
other databases (e.g. Pedianet, SIDIAP) make
information from anonymized free text entries
available to researchers for outcome validation](https://image.slidesharecdn.com/pe-240724213222-aa326c35/85/Pharmacoepidemiology-pharmacoeconomics-210-320.jpg)
![10 Electronic Health Record Databases
188
Case Example 10.1 Electronic Health Record Database in Spain (see de Abajo et al.,
Lancet, 2020)
Background
●
● Angiotensin-
converting enzyme 2 (ACE2)
is the molecular receptor used by severe
acute respiratory syndrome coronavirus 2
(SARS-
CoV-
2) to enter cells and cause
infection.
●
● Renin–angiotensin–aldosterone system
(RAAS) inhibitors (e.g. ACE inhibitors,
angiotensin-
receptor blockers [ARBs])
increase ACE2 expression in some animal
models and may reduce angiotensin II-
associated lung injury, raising questions
about the role of RAAS inhibitors in
increasing or decreasing the risk of SARS-
CoV-
2 infection and severity of coronavirus
disease-2019 (COVID-19).
●
● Early in the COVID-
19 pandemic, associa-
tions between certain comorbidities (e.g.
diabetes, hypertension) and severe
COVID-
19 led to questions about the
safety of continuing RAAS inhibitors.
Issue
Using BIFAP and another local EHR database
(HORUS), a population-
based study was con-
ducted to evaluate the association between
use of RAAS inhibitors and severe
COVID-
19 in Madrid, Spain.
Approach
●
● A case-
population design was used.
●
● Cases were adults consecutively admitted
in March 2020 to hospitals in Madrid with
a diagnosis of COVID-
19, stratified by
severity; patients with severe COVID-
19
required intensive care unit (ICU) admis-
sion or died.
●
● Each case was matched by age, sex, and
index date (day and month of hospital
admission) to 10 random controls in
Madrid using 2018 data from BIFAP
(2019–2020 BIFAP data were not
available).
●
● Exposure was defined as a prescription for
RAAS inhibitors lasting until onemonth
before the index date (current use), com-
pared with current use of other antihyper-
tensives (e.g. calcium channel blockers,
beta blockers, diuretics).
●
● Potential confounders were a history of
diabetes, hyperlipidemia (defined as use of
lipid-
lowering drugs), atrial fibrillation,
heart failure, ischemic heart disease,
thromboembolic disease, cerebrovascular
accident, asthma, cancer, chronic kidney
disease, or chronic obstructive pulmonary
disease; underlying cardiovascular disease
(composite of comorbidities); cardiovascu-
lar risk factors (composite of comorbidities
including hypertension).
●
● Associations were estimated using multi-
variable conditional logistic regression,
adjusted for confounders. Potential effect
modification by age, sex, and comorbidity
(e.g. hypertension, diabetes) was exam-
ined. Models were also stratified by
COVID-19 severity.
●
● Secondary analyses considered associa-
tions for individual drug classes (e.g. ACE
inhibitors versus calcium channel
blockers).
●
● Sensitivity analyses considered impact of
secular trends of RAAS use (given the two-
year gap between case and control data)
and media alerts about the safety of RAAS
inhibitors, among others.
Results
●
● Data were collected from 1139 cases and
11390 matched controls. Comorbidities
and use of antihypertensives were more
prevalent among cases than controls.](https://image.slidesharecdn.com/pe-240724213222-aa326c35/85/Pharmacoepidemiology-pharmacoeconomics-216-320.jpg)

![Introductio 193
validation can also be important for safety
studies that use the patient as the primary
reporter of potential adverse events (AEs), and
clinical validation may be needed to confirm
the endpoint of interest. For example, in the
European PROTECT (Pharmacoepidemio
logical Research on Outcomes of Therapeutics)
Consortium, funded by the Innovative
Medicines Initiative, data were collected
directly from pregnant women recruited on-
line from the UK, Denmark, The Netherlands
and Poland. Researchers learned that women
could accurately report serious birth defects,
but there were many reports of potential
abnormalities that were difficult to classify
without more clinical information.
Some observational as well as interventional
studies, especially those designed to meet
post-
marketing requirements with safety or
effectiveness outcomes that require an addi-
tional level of rigor, may include a full or mod-
ified approach to clinical outcome review or
adjudication by a central committee over and
above the reporting by individual study sites.
Reasons supporting the need for additional
outcome adjudication include concerns
regarding investigator bias, if they hold strong
opinions as to the benefit or harm associated
with a treatment under study, the need to
apply consistent standard definitions given
variability in diagnostic criteria in usual prac-
tice, and lack of detail or inconsistent use of
standard coding practices in accessible sec-
ondary data sources.
Clinical assessments not consistently captured
in secondary data – Even as the collection of
health care data from routine care is increas-
ingly recorded and available from electronic as
well as paper medical records, substantial vari-
ability in performing assessments on the part
of HCPs according to individual and local
practice, magnified by patients’ variability in
coming in for recommended routine visits,
limits the extent to which clinical data from
secondary sources can be used to address some
research questions. See section on “Clinician
or site-
reported outcomes” below.
Commonly, prospective studies including
planned analysis of laboratory data or imaging
studies over time may incorporate primary
data collection to ensure complete collection
of assessments and that timing of assessments
is aligned with the study follow-
up period.
Additionally, use of a central lab to reduce vari-
ability in laboratory measures may be consid-
ered to further increase the validity of study
results. The PROVALID study, (PROspective
cohort study in patients with type 2 diabetes
[T2D] mellitus for VALIDation of biomarkers),
launched in 5 EU countries (Austria, Hungary,
Netherlands, Poland and Scotland), will obtain
laboratory measurements on 4000 enrolled
patients with type-
2 diabetes treated in the pri-
mary care setting to examine the impact of
medication and predict the clinical course of
disease, including renal and cardiovascular
events. Sites that participate in PROVALID are
required to collect a minimum set of clinical
data parameters, with the option to collect
many additional laboratory and medical his-
tory characteristics on enrolled patients.
Characterization of patient-
reported out-
comes not captured in secondary data – It is
often important to evaluate the burden of dis-
ease on patients and how that burden is
affected by various treatments. Burden can
include measures of disease related or general
quality of life, ability to complete activities or
attend work, assessment of pain or symptoms
related to the underlying condition. Additional
detail is provided in the section on “Patient-
Generated Data” below.
Studies of rare populations – when necessary
to assemble as large and representative a sam-
ple as possible from a rare population, one or
more existing data sources may not capture
enough of the patient population of interest to
address study aims. Registries of rare disease
and of pregnancy exposures commonly face
the challenge of a small number of patients
with the condition or exposure of interest, dis-
tributed over many countries, for which no
single existing data source likely includes
enough patients to address research aims.](https://image.slidesharecdn.com/pe-240724213222-aa326c35/85/Pharmacoepidemiology-pharmacoeconomics-221-320.jpg)
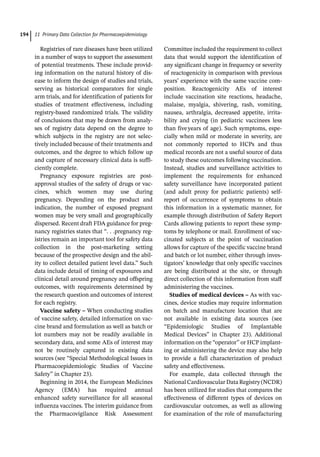
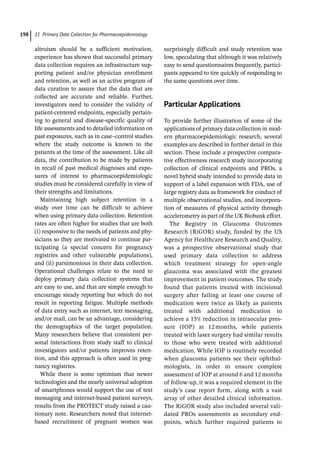
![Further Reading 201
Further Reading
Coleman, A., Lum, F., Velentgas, P. et al. (2016).
RiGOR: a prospective observational study
comparing the effectiveness of treatment
strategies for open-
angle glaucoma. J. Comp.
Eff. Res. 5 (1): 65–78.
Doherty, A., Jackson, D., Hammerla, N. et al.
(2017). Large scale population assessment of
physical activity using wrist worn
accelerometers: the UK Biobank study. PLoS
One 12 (2): e0169649. https://doi.org/10.1371/
journal.pone.0169649.
Dreyer, N.A., Blackburn, S.C.F., Mt-
Isa, S. et al.
(2015 Jul-
Dec). Direct-
to-
patient research:
piloting a new approach to understanding
drug safety during pregnancy. JMIR Public
Health Surveill. 1 (2): e22.
Eder, S., Leirer, J., Kershbaum, J. et al. (2018). A
prospective cohort study in patients with type
2 diabetes mellitus for validation of
biomarkers (PROVALID) – study design and
baseline characteristics. Kidney Blood Press.
Res. 43: 181–190.
EuroBioBank Network. http://www.
eurobiobank.org
Gliklich RE, Leavy MB, Dreyer NA (sr eds).
Registries for Evaluating Patient Outcomes:
A User’s Guide. 4th ed. (Prepared by LM
Policy Research, LLC, under Contract No.
290–2014-
00004-
C with partners OM1 and
IQVIA) AHRQ Publication No. 19(20)-
EHC020. Rockville, MD: Agency for
Healthcare Research and Quality;
September 2020. Posted final reports are
located on the Effective Health Care
Program search page. DOI: 10.23970/
AHRQEPCREGISTRIES4.
Heinzel, A., Kammer, M., Mayer, G. et al. (2018
Sep). Validation of plasma biomarker
candidates for the prediction of eGFR decline
in patients with type 2 diabetes. Diabetes Care
41 (9): 1947–1954. https://doi.org/10.2337/
dc18-
0532.
Hobbs MN. “Registries Rising: FDA Looking At
TNF Inhibitors; AHRQ Updates Standards.”
The Pink Sheet. August 2009;71(34):8–9.
Pharmacoepidemiological Research on
Outcomes of Therapeutics by a European
ConsorTium (PROTECT). http://www.
imi-
protect.eu accessed 13 October 2020.
Jansen-
van der Weide, M.C., Gaasterland,
C.M.W., Roes, K.C.B. et al. (2018). Rare
disease registries: potential applications
towards impact on development of new drug
treatments. Orphanet J. Rare Dis. 13: 154.
https://doi.org/10.1186/s13023-
018-
0836-
0.
Mack C, Pavesio A, Kelly K, Wester T, Jones J,
Maislin G, Irwin D, Brinkley E, Zura RD.
Breaking News: Study of Fracture Healing in
Patients at Risk of Non-
Union. Poster. 33rd
ICPE: International Conference on
Pharmacoepidemiology Therapeutic Risk
Management, Montreal, Canada, August
23–27, 2017.
Marra, C., Chen, J.L., Coravos, A. et al. (2020).
Quantifying the use of connected digital
products in clinical research. NPJ Digit. Med.
3: 50. https://doi.org/10.1038/
s41746-
020-
0259-
x.
National Cancer Institute, Surveillance,
Epidemiology, and End Results Program.
Overview of the SEER Program (web page).
Available at http://seer.cancer.gov/about
accessed 13 October 2020.
Pharmacovigilance Risk Assessment Committee
(PRAC) [Internet] Interim guidance on
enhanced safety surveillance for seasonal
influenza vaccines in the EU. London:
European Medicines Agency (EMA) 2014.
Available at: http://www.ema.europa.eu/docs/
en_GB/document_library/Scientific_
guideline/2014/04/WC500165492.pdf
accessed 13 October 2020.
Resnic, F.S., Majithia, A., Marinac-Dabic, D. et
al. (2017). Registry-
based prospective, active
surveillance of medical-
device safety. N. Engl.
J. Med. 376: 526–535. https://doi.org/10.1056/
NEJMoa1516333.
Seltzer, J.H., Heise, T., Carson, P. et al. (2017).
Use of endpoint adjudication to improve the
quality and validity of endpoint assessment](https://image.slidesharecdn.com/pe-240724213222-aa326c35/85/Pharmacoepidemiology-pharmacoeconomics-229-320.jpg)
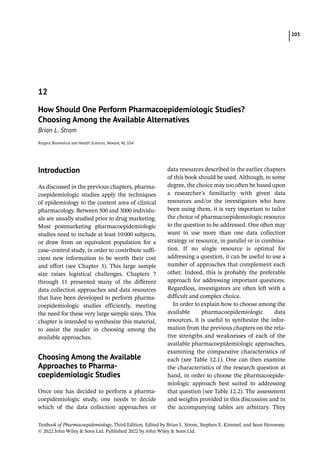


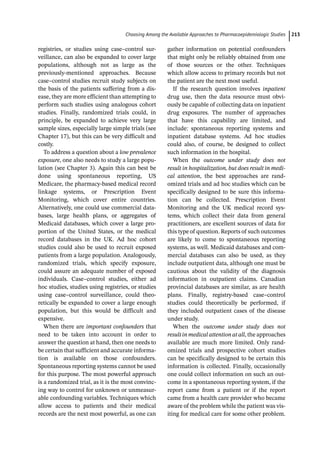


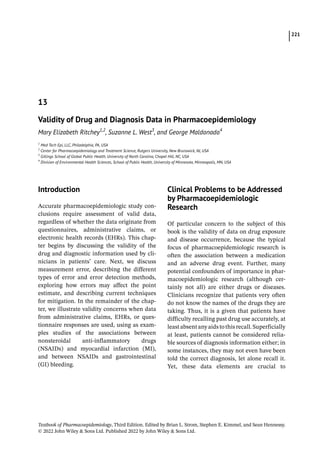
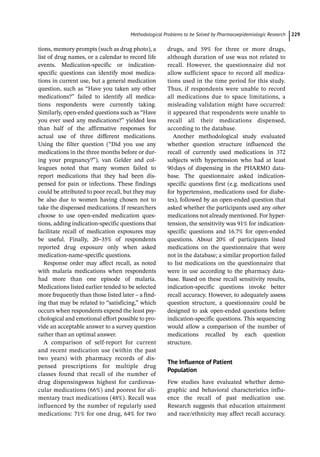
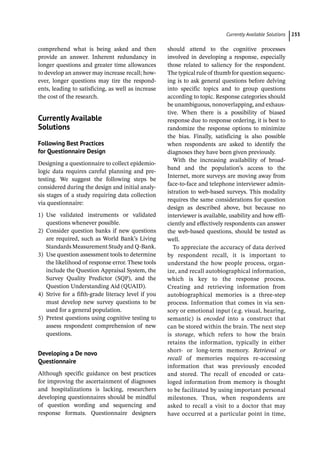
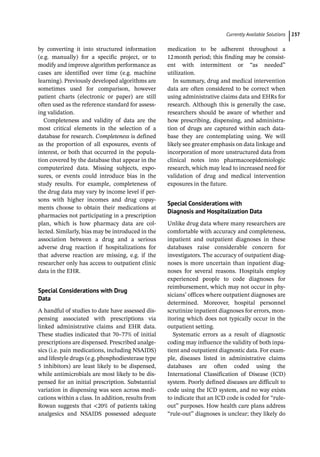
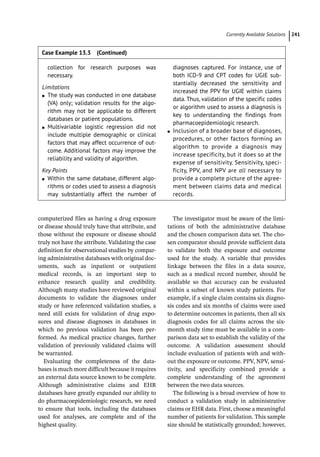
![Further Reading 243
Further Reading
Abraham, N.S., Cohen, D.C., Rivers, B., and
Richardson, P. (2006). Validation of
administrative data used for the diagnosis of
upper gastrointestinal events following
nonsteroidal anti-
inflammatory drug
prescription. Alimentary Pharmacology
Therapeutics 24 (2): 299–306.
Bank, T.W. (2018). Living Standards
Measurement Survey -Questionnaires. [cited
27 January 2018] Available from: http://go.
worldbank.org/HZVSQMD5S0.
Biemer, P. Measurement errors in sample
surveys. In: Handbook of Statistics –
Sample Surveys: Design, Methods and
Applications (eds. D. Pfeffermann and C.R.
Rao), 281–316. The Netherlands:
North-
Holland.
Bland, J.M. and Altman, D.G. (1986). Statistical
methods for assessing agreement between two
methods of clinical measurement. Lancet 1
(8476): 307–310.
Bustamante, R., Earles, A., Murphy, J.D. et al.
(2019). Ascertainment of aspirin exposure
using structured and unstructured large-
scale
electronic health record data. Medical Care 57
(10): e60–e64.
Copeland, K.T., Checkoway, H., McMichael, A.J.,
and Holbrook, R.H. (1977). Bias due to
misclassification in the estimation of relative
risk. American Journal of Epidemiology 105
(5): 488–495.
Dean, E., Caspar, R., McAvinchey, G. et al.
(2007). Developing a low-
cost technique for
parallel cross-
cultural instrument
development: the Question Appraisal System
(QAS-
04). International Journal of Social
Research Methodology 10 (3): 227–241.
Dosemeci, M., Wacholder, S., and Lubin, J.H.
(1990). Does nondifferential misclassification
of exposure always bias a true effect toward
the null value? American Journal of
Epidemiology 132 (4): 746–748.
Fischer, M.A., Stedman, M.R., Lii, J. et al.
(2010). Primary medication non-
adherence:
analysis of 195,930 electronic prescriptions.
Journal of General Internal Medicine 25 (4):
284–290.
Flegal, K.M., Keyl, P.M., and Nieto, F.J. (1991).
Differential misclassification arising from
nondifferential errors in exposure
measurement. American Journal of
Epidemiology 134 (10): 1233–1244.
Fourrier-
Reglat, A., Cuong, H.M., Lassalle, R.
et al. (2010). Concordance between prescriber-
and patient-
reported previous medical history
and NSAID indication in the CADEUS cohort.
Pharmacoepidemiology and Drug Safety 19 (5):
474–481.
Gama, H., Correia, S., and Lunet, N. (2009).
Questionnaire design and the recall of
pharmacological treatments: a systematic
review. Pharmacoepidemiology and Drug
Safety 18 (3): 175–187.
Geisen, E. and Bergstrom, J.R. (2017).
Respondent-
survey interaction. In: Usability
Testing for Survey Research (ed. M.
Kaufmann), 21–49. Cambridge, MA:
Elsevier.
Graesser, A.C., Wiemer-
hastings, K., Kreuz, R.
et al. (2000). QUAID: a questionnaire
evaluation aid for survey methodologists.
Behavior Research Methods, Instruments, and
Computers 32: 254–262.
Greenland, S. (2005). Multiple-
bias modelling
for analysis of observational data [with
discussion]. Journal of the Royal Statistical
Society: Series A (Statistics in Society) 168 (2):
267–306.
Greenland, S., Lash, T.L., and Rothman, K.J.
(2008). Bias analysis. In: Modern Epidemiology
(eds. K.J. Rothman, S. Greenland and T.L.
Lash), 345–380. Philadelphia, PA: Wolters
Kluwer Health/Lippincott Williams Wilkins.
Greenland, S. (2001). Sensitivity analysis, Monte
Carlo risk analysis, and Bayesian uncertainty
assessment. Risk Analysis: An Official
Publication of the Society for Risk Analysis 21
(4): 579–583.](https://image.slidesharecdn.com/pe-240724213222-aa326c35/85/Pharmacoepidemiology-pharmacoeconomics-271-320.jpg)
![13 Validity of Drug and Diagnosis Data in Pharmacoepidemiology
244
Horwitz, R.I. and Feinstein, A.R. (1978).
Alternative analytic methods for case–control
studies of estrogens and endometrial cancer.
The New England Journal of Medicine 299
(20): 1089–1094.
Jurek, A.M., Maldonado, G., Greenland, S., and
Church, T.R. (2006). Exposure-
measurement
error is frequently ignored when interpreting
epidemiologic study results. European Journal
of Epidemiology 21 (12): 871–876.
Jurek, A.M., Greenland, S., Maldonado, G., and
Church, T.R. (2005). Proper interpretation of
non-
differential misclassification effects:
expectations vs observations. International
Journal of Epidemiology 34 (3): 680–687.
Jurek, A.M., Maldonado, G., and Greenland, S.
(2013). Adjusting for outcome
misclassification: the importance of
accounting for case–control sampling and
other forms of outcome-
related selection.
Annals of Epidemiology 23 (3): 129–135.
Krosnick, J. (2000). The threat of satisficing in
surveys: the shortcuts respondents take in
answering questions. Survey Methods
Newsletter 20: 4–8.
Lash, T.L., Fox, M.P., and Fink, A.K. (2009).
Applying Quantitative Bias Analysis to
Epidemiologic Data. New York: Springer.
Lash, T.L., Fox, M.P., MacLehose, R.F. et al.
(2014). Good practices for quantitative bias
analysis. International Journal of
Epidemiology 43 (6): 1969–1985.
Lash, T.L. and Fink, A.K. (2003). Semi-
automated sensitivity analysis to assess
systematic errors in observational data.
Epidemiology (Cambridge, Massachusetts) 14
(4): 451–458.
Lessler, J.T. and Harris, B.S.H. (1984). Medicaid
Data as a Source for Postmarketing
Surveillance Information. Research Triangle
Park, NC: Research Triangle Institute.
Maclure, M. and Willett, W.C. (1987).
Misinterpretation and misuse of the kappa
statistic. American Journal of Epidemiology
126 (2): 161–169.
Madow, W.G. (1967). Interview data on chronic
conditions compared with information
derived from medical records. Vital and health
statistics. Series 2. Data Evaluation and
Methods Research 23: 1–84.
Maldonado, G. (2008). Adjusting a relative-
risk
estimate for study imperfections. Journal of
Epidemiology and Community Health 62 (7):
655–663.
Maldonado, G., Greenland, S., and Phillips, C.
(2000). Approximately nondifferential
exposure misclassification does not ensure
bias toward the null. American Journal of
Epidemiology 151: S39.
Mitchell, A.A., Cottler, L.B., and Shapiro, S.
(1986). Effect of questionnaire design on recall
of drug exposure in pregnancy. American
Journal of Epidemiology 123 (4): 670–676.
Naleway, A.L., Belongia, E.A., Greenlee, R.T.
et al. (2003). Eczematous skin disease and
recall of past diagnoses: implications for
smallpox vaccination. Annals of Internal
Medicine 139 (1): 1–7.
Newton, K.M., Peissig, P.L., Kho, A.N. et al.
(2013). Validation of electronic medical
record-
based phenotyping algorithms: results
and lessons learned from the eMERGE
network. Journal of the American Medical
Informmatics Association 20 (e1): e147–e154.
Nichols, E., Olmsted-
Hawala, E., Holland, T.,
and Riemer, A.A. (2016). Best Practices of
Usability Testing Online Questionnaires at the
Census Bureau: How rigorous and repeatable
testing can improve online questionnaire
design. In: International Conference on
Questionnaire Design, Development,
Evaluation, and Testing (QDET2). Miami, FL.
Phillips, C.V. (2003). Quantifying and reporting
uncertainty from systematic errors.
Epidemiology (Cambridge, Massachusetts) 14
(4): 459–466.
Phillips, C.V. and LaPole, L.M. (2003).
Quantifying errors without random sampling.
BMC Medical Research Methodology 3: 9.
Poole, C. (1985). Exceptions to the rule about
nondifferential misclassification. American
Journal of Epidemiology 122: 508.
C.f.D.C.a. Q-
Bank. Prevention [cited 27 January
2018]. https://wwwn.cdc.gov/qbank](https://image.slidesharecdn.com/pe-240724213222-aa326c35/85/Pharmacoepidemiology-pharmacoeconomics-272-320.jpg)
![Further Reading 245
Ray, W. (2003). Evaluating medication effects
outside of clinical trials: new-
user designs.
American Journal of Epidemiology 158:
915–920.
Ritchey, M.E., West, S.L., and Maldonado, G.
(2019). Validity of pharmacoepidemiology drug
and diagnosis data. In: Pharmacoepidemiology,
6e (eds. B.L. Strom, S. Hennessy and S.E.
Kimmel), 948–990. Sussex: Wiley.
Rodgers, A. and MacMahon, S. (1995).
Systematic underestimation of treatment
effects as a result of diagnostic test inaccuracy:
implications for the interpretation and design
of thromboprophylaxis trials. Thrombosis and
Haemostasis 73 (2): 167–171.
Rothman, K.J., Greenland, S., and Lash, T.L.
(2008). Precision and statistics in
epidemiologic studies. In: Modern
Epidemiology, 3e (eds. K.J. Rothman, S.
Greenland and T.L. Lash), 148–167.
Philadelphia, PA: Lippincott, Williams
Wilkins.
Rothman, K.J., Greenland, S., and Lash, T.L.
(2008). Validity in epidemiologic studies. In:
Modern Epidemiology (eds. K.J. Rothman, S.
Greenland and T.L. Lash), 128–147.
Philadelphia, PA: Wolters Kluwer Health/
Lippincott Williams Wilkins.
Rowan, C.G., Flory, J., Gerhard, T. et al. (2017).
Agreement and validity of electronic health
record prescribing data relative to pharmacy
claims data: a validation study from a US
electronic health record database.
Pharmacoepidemiology and Drug Safety 26 (8):
963–972.
Smith, T.W. (2016). Optimizing Questionnaire
Design in Cross-
National and Cross-
Cultural
Surveys. In: International Conference on
Questionnaire Design, Development,
Evaluation, and Testing (QDET2). Miami, FL.
Survey Quality Predictor (SQP) 2.1. [cited
27 January 2018]. http://sqp.upf.edu
Stange, K.C. (2009). The problem of
fragmentation and the need for integrative
solutions. The Annals of Family Medicine 7
(2): 100–103.
Tourangeau, R., Rips, L.J., and Rasinski, K.
(2000). The Psychology of Survey Response.
Cambridge, MA: Cambridge University
Press.
Trifiro, G., Coloma, P.M., Rijnbeek, P.R. et al.
(2014). Combining multiple healthcare
databases for postmarketing drug and vaccine
safety surveillance: why and how? Journal of
Internal Medicine 275 (6): 551–561.
Tsou, A.Y., Lehmann, C.U., Michel, J. et al.
(2017). Safe practices for copy and paste in the
EHR. Systematic review, recommendations,
and novel model for health IT collaboration.
Applied Clinical Informatics 8 (1): 12–34.
Upadhyaya, S.G., Murphree, D.H., Ngufor, C.G.
et al. (2017). Automated diabetes case
identification using electronic health record
data at a tertiary care facility. Mayo Clinic
Proceedings. Innovations, Quality Outcomes
1 (1): 100–110.
van Gelder, M.M., van Rooij, I.A., de Walle,
H.E. et al. (2013). Maternal recall of
prescription medication use during
pregnancy using a paper-
based
questionnaire: a validation study in the
Netherlands. Drug Safety 36 (1): 43–54.
Wacholder, S., Armstrong, B., and Hartge, P.
(1993). Validation studies using an alloyed
gold standard. American Journal of
Epidemiology 137 (11): 1251–1258.
Watson, D.L. (1965). Health interview responses
compared with medical records. Vital and
Health Statistics 1 (46): 1–74.
West, S.L., Blake, C., Zhiwen, L. et al. (2009).
Reflections on the use of electronic health
record data for clinical research. Health
Informatics Journal 15 (2): 108–121.
West, S.L., Savitz, D.A., Koch, G. et al. (1995).
Recall accuracy for prescription medications:
self-
report compared with database
information. American Journal of
Epidemiology 142 (10): 1103–1112.](https://image.slidesharecdn.com/pe-240724213222-aa326c35/85/Pharmacoepidemiology-pharmacoeconomics-273-320.jpg)
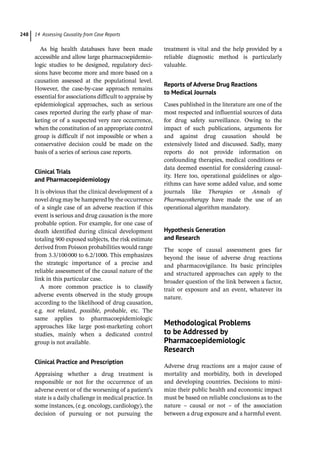
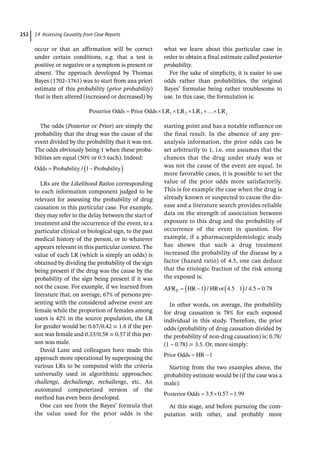
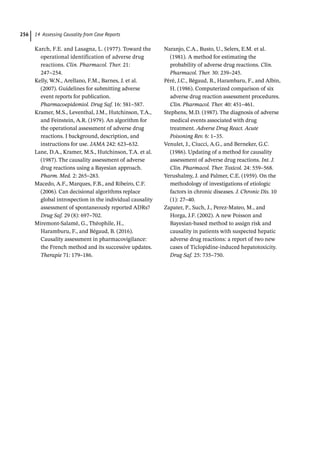

![Clinical Problems to be Addressed by Pharmacoepidemiologic Researc 261
Oceanians, and Middle Easterns (1% in each
of these populations). In contrast, diplotype
frequencies predicting ultrarapid metabolism
were highest in Oceanian (21.2%), followed by
Ashkenazi Jews and Middle Easterns (about
11% in each of these populations) and lowest
in East Asians (1.4%).
However, predicting clinical outcomes in
daily practice based on such CYP2D6 genetic
data in a valid fashion remains complex. Drug–
gene associations shown in one study cannot
always be replicated in another one. Obviously,
variance in drug response has many determi-
nants and singling out only one genetic factor
fails to account for the co-
occurrence, inter-
play, and interactions of several other factors
(e.g. disease severity, exposure variability over
time, physiological feedback mechanisms, and
testing bias), all also important for molecular
pharmacoepidemiology.
In addition to metabolism, genes that alter
the absorption and distribution of medications
may also alter drug levels at tissue targets.
These include, for example, genes that code for
transporter proteins such as the ATP-
binding
cassette transporter proteins (ABCB, also
known as the multidrug-
resistance [MDR]-
1
gene), which has polymorphisms that have
been associated with, for example, resistance
to antiepileptic drugs. Patients with drug-
resistant epilepsy (approximately one of three
patients with epilepsy is a nonresponder) are
more likely to have the CC polymorphism of
ABCB1, which is associated with increased
expression of this transporter drug-
efflux pro-
tein. Of note, the ABCB1 polymorphism falls
within an extensive block of linkage disequi-
librium (LD). LD is defined by a region in
which multiple genetic variants (e.g. SNPs) are
correlated with one another due to population
and evolutionary genetic history. As a result, a
SNP may be statistically associated with dis-
ease risk, but is also in LD with the true causa-
tive SNP. Therefore, the SNP under study may
not itself be causal but simply linked to a true
causal variant. One of the major challenges in
genetics research at this time is developing
methods that can identify the true causal
variant(s) that may reside in an LD block.
Pharmacodynamic Gene–Drug
Interactions
Once a drug is absorbed and transported to its
target site, its effect may be altered by differ-
encesintheresponseof drugtargets.Therefore,
polymorphisms in genes that code for drug tar-
gets may alter the response of an individual to
a medication.
For example, polymorphisms of the β(2)-
adrenergic receptor (β(2)-
AR) might affect
response to β-
agonists (e.g. albuterol) in
asthma patients. In particular, the coding vari-
ants at position 16 within the β(2)-
AR gene
(β(2)-
AR-
16) have been suggested to determine
patient response to albuterol treatment (see
Case Example 15.1).
Pharmacodynamic gene–drug interactions
may also affect the risk of adverse reactions.
One example is a polymorphism in the gene
coding for the bradykinin B2 receptor that has
been associated with an increased risk of angi-
otensin converting enzyme (ACE) inhibitor-
induced cough. Cough is one of the most
frequently seen adverse drug reactions (ADRs)
in ACE therapy and very often a reason for dis-
continuation of therapy. The TT genotype and
T allele of the human bradykinin B(2) receptor
gene were found to be significantly higher in
patients with cough. However, similar to many
other studies, replication of these findings has
been limited. Further research using genome-
wide association studies (GWAS) has sug-
gestedthatotherSNPsarerelatedtointolerance
to ACE inhibitors, but again requires
replication.
Gene–Drug Interactions and the
Causal Pathway of Disease
Along with altering the pharmacokinetic and
pharmacodynamic properties of medications,
genetic polymorphisms may also alter the dis-
ease state that is the target of drug therapy. For
example, antihypertensive medications that
work by a particular mechanism, such as the](https://image.slidesharecdn.com/pe-240724213222-aa326c35/85/Pharmacoepidemiology-pharmacoeconomics-289-320.jpg)
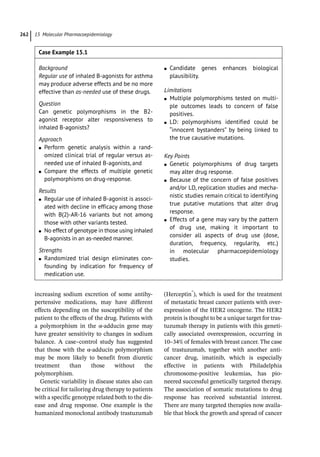
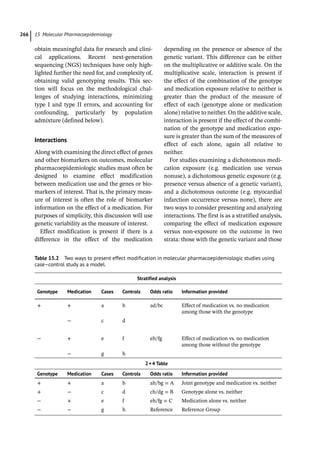
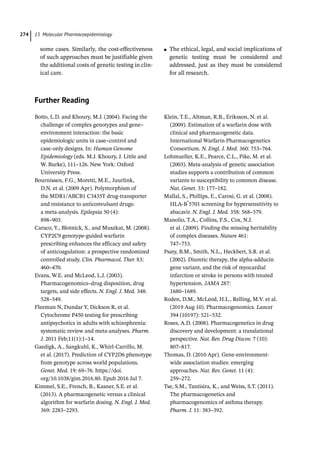

![Clinical Problems to be Addressed by Pharmacoepidemiologic Researc 277
birth defect which resulted in grossly visible
limb deformities, with maternal use of the pop-
ular new anti-
nausea medicine Contergan (tha-
lidomide). Images of thalidomide children
became an international symbol of the ethical
failure of the medical profession and the regu-
latory state to protect vulnerable populations
from the harmful effects of widely marketed
new drugs. Contergan had been extensively
marketed to physicians and consumers alike,
and its premarket testing and post-
market pro-
motion had emphasized its remarkably non
toxic safety profile by available standards of
clinical pharmacology. As Lenz’s work was
read internationally, his careful use of the cor-
relative techniques of infectious disease epide-
miology within the terrain of prescription drug
use documented not only the unseen dangers
of newly marketed drugs but also the need for a
new discipline of pharmaceutical epidemiol-
ogy to scour observational data for therapeutic
effects and adverse reactions that could clearly
be associated with drug use in clinical practice.
The recognition that the risks of new drugs
could be better understood when they were
consumed by broad numbers of patients had
been evident long before Lenz’s epidemiology
of thalidomide-
associated phocomelia. Indeed,
the history of federal drug regulation in the
United States can be recounted as a succession
of measures taken in response to dangers of
drugs that became apparent after widespread
consumption by the general public. However,
until the 1960s the Food and Drug
Administration (FDA) had very limited author-
ity in the post-
market regulation of drugs. The
agency had neither direct means to control
physician prescriptions nor resources to gather
data on prescribing of newly marketed drugs.
While the Committee on Pharmacy and
Chemistry of the American Medical
Association (AMA) nominally maintained
more influence in both arenas, it depended
entirely upon voluntary physician reports, and
Committee members complained loudly that
the system itself was doomed to failure; as one
report noted, “physicians reported only a small
fraction of all cases and the total number of
patients receiving a drug was unknown.”
The 1962 Kefauver-
Harris Amendments –
passed largely on the strength of popular moral
outrage over thalidomide – demanded phar-
maceutical manufacturers establish records
and make reports to the FDA of “data relating
to clinical experience and other data or infor-
mation, received or otherwise obtained” for all
new drugs. By 1967 the agency had developed
a protocol requiring manufacturers to seek and
report any reported or published case reports
related to putative side effects of their mar-
keted products. Any novel or unexpected
adverse effect was to be reported to the agency
within 15days; other information “pertinent to
the safety or effectiveness of the drug” was to
be reported quarterly for the first year after
approval, twice in the second year, and annu-
ally thereafter. Yet this kind of information
could become actionable only after years of
case reports, and then only if one of the rela-
tively few FDA staffers took active interest in
pursuit of a specific question of drug harm.
The hospital became the center of early pro-
grams of pharmacoepidemiologic surveillance.
By 1964, the FDA and AMA had built a surveil-
lance program involving more than 600 hospi-
tals, which became the focus of early
pharmacoepidemiologic research by Johns
Hopkins University’s Leighton Cluff, Harvard
University’s Thomas Chalmers, and Tufts
University’s Hershel Jick. Yet the data were
still only as good as the reporting physicians’
records. As Leighton Cluff noted, an early vali-
dation system of reporting efforts at the Johns
Hopkins Hospital “proved completely unsatis-
factory for detecting drug reactions. . .[d]uring
recent daily intensive surveillance of one hos-
pital service, four times as many reactions
were detected than had been reported on the
cards from the entire hospital.” Would-
be epi-
demiologists of adverse drug effects needed a
way to circumvent the physician as reporting
device – and the digitization of data provided
an appealing solution. Cluff’s attempts at com-
puterized drug monitoring involved the](https://image.slidesharecdn.com/pe-240724213222-aa326c35/85/Pharmacoepidemiology-pharmacoeconomics-305-320.jpg)
![16 Bioethical Issues in Pharmacoepidemiologic Research
278
creation of three linked datasets for every drug
received by every patient in a dedicated hospi-
tal ward. D. J. Finney, another early theorist of
computerized drug monitoring, expressed
these data sets as a linked “P-
D-
E system,” in
which P(atient) population data would be sys-
tematically gathered within a set geographic or
hospital catchment area, the D(rug) data
would include records of all relevant prescrip-
tions, and E(vent) collection would record all
untoward reactions potentially attributable to
the drugs prescribed.
Proponents of drug monitoring imagined a
linked system of inpatient surveillance wards
circling the globe, which could act as pharma-
covigilance sensors, detecting early signals of
possible drug harms and providing descriptive
data regarding their frequency, severity, and
relative strength of association. Finney pre-
dicted that surveillance would change phar-
macoepidemiology from a reactive into a
proactive field. Allowing that “much is due to
Lenz for his discovery in 1961 [that thalido-
mide was associated with phocomelia],” he
also boasted that “a monitor could have sig-
naled a warning 1½–2 years earlier.”
Automated inpatient surveillance systems lib-
erated pharmacoepidemiology from the “weak
link” of the reporting physician. With public
and private support from the United States
Public Health Service and the Pharmaceutical
Manufacturers Association, Dennis Slone,
Hershel Jick, and Ivan Borda demonstrated the
feasibility of implementing an automated
hospital-
based drug monitor system in 1966.
Based at the Lemuel Shattuck Hospital, the
Boston Collaborative Drug Surveillance
Program bypassed the physician by hiring a
drug surveillance nurse “whose primary role is
the acquisition of accurate data.” The Boston
team became a model for an automated drug
surveillance program that functioned “largely
independent of clinical judgment in establish-
ing a connection between a drug and an
adverse event.”
Early results showed that drug-
related
events were both more frequent and less severe
than had previously been anticipated. More
than one-
third of patients on the Shattuck
wards experienced at least one drug-
associated
adverse reaction during the first year of study.
By 1967 the Boston group had established a
numerator/denominator approach for com-
paring drug usage between long-
term and
acute hospitals through a network of five hos-
pitals in Boston. By 1968, over 2500 patients
had been entered and discharged from the sur-
veillance system, with over 26000 monitored
drug exposures, representing more than
700 individual drugs. Commonly-
prescribed
drugs, such as digoxin and heparin, could be
reported in detail, yielding novel information
related to their clinical pharmacology and
their interactions with other drugs. The system
enabled the observation of not only obvious
drug reactions (such as a rash) but also other
clinical events (such as heart attacks or kidney
failure) that could only be associated with
drugs by careful epidemiologic surveillance.
As the Boston Collaborative Drug
Surveillance Program escalated its activities
and exported its methods to other sites, these
new data provoked a series of drug scandals
that emphasized both the utility and the limi-
tations of the new forms of pharmacovigilance.
Clioquinol, an anti-
infective that had been in
use since the 1930s, was found to be associated
with subacute myelo-
optic neuropathy in 1970,
over three decades after its initial introduction.
An association between the synthetic estrogen
diethylstilbestrol (DES) and a rare form of cer-
vical clear cell adenoma was reported in 1971,
with evidence of a 20-
year latency period
between the use of the drug and detection of
the cancer. The beta-
blocker practolol became
the focus of a broad scandal after it was associ-
ated with a potentially fatal inflammation of
the skin and soft tissues (oculomucocutaneous
syndrome) some five years after its broad
release on the British market. These examples
simultaneously elucidated the scientific and
ethical necessity for drug surveillance units
and underscored the impossibility of inpatient
surveillance systems to capture drug-
disease](https://image.slidesharecdn.com/pe-240724213222-aa326c35/85/Pharmacoepidemiology-pharmacoeconomics-306-320.jpg)
![16 Bioethical Issues in Pharmacoepidemiologic Research
280
that this approach could be quite promising
indeed. Another hybrid form was introduced
by Noel Munson, a spokesman from
Prescription Card Services (PCS), a private pre-
scription data company that acted as a “fiscal
intermediary” for public payment groups like
Medicare and Medicaid and other groups that
paid for prescription drugs. But these individ-
ual companies (e.g. PCS) appeared to code
their data according to their own proprietary
software. Even within the Medicaid system,
the promise of effortless data linkage remained
a dream in the late 1970s, complicated by wide
state-
by-
state discrepancies in patterns of cod-
ing, storing, and retrieving prescription data.
If the 1980 publication of the Joint
Commission report represented a high point of
collaboration between market researchers, epi-
demiologists, policy reformers, and sociolo-
gists in imagining an early “big data” universe
for therapeutic surveillance, it also represented
a dream of collaborative work that would soon
dissipate. Like many other grand designs for
federally-
sponsored health programs con-
ceived in the later 1970s and proposed in the
early 1980s, its speculative structures would
never materialize, its measures would be left
unfunded, and subsequent calls for a center for
post-
marketing surveillance would be
repeated, and unfunded, every few years for
several decades. Only in the past decade, with
the passage of the Food and Drug
Administration Amendments Act of 2007
(FDAAA), would a substantial US public
investment be made in the construction of a
linked public prescription database for phar-
macoepidemiologic research with the creation
of the FDA’s new automated pharmacovigi-
lance program, the Sentinel Initiative, which
officially launched in 2016.
European Pharmacoepidemiologic
Trends and Ethics
In Europe, several nations with centralized
national health systems like England and
Sweden created prescription surveillance
systems by the second half of the twentieth
century. Scandinavian countries in particular
had long histories of centrally organized phar-
macy records and more tightly controlled
national formularies of allowable drugs.
Moreover, the World Health Organization had
set up a regional European Drug Utilization
Group in Oslo which held a prominent confer-
ence on the overprescribing of prescription
drugs in 1969 and then proceeded to develop
methods of comparing utilization across drug
classes and across national pharmacy stand-
ards. Ironically, even in countries such as
Sweden, much of the prescription data came
from the private sector. Still, pharmacoepide-
miologic research in Europe continued to
receive substantial public support throughout
the 1970s, 1980s, and 1990s.
The founding of the European Medicines
Agency (EMA) in 1995 was a crucial step
toward a pan-
European supervision of medi-
cines. The decentralized agency is critical to
the European Medicines Regulatory Network
(EMRN), partnering with the European
Commission (EC) and national authorities of
European Economic Area (EEA) member
states (the Heads of Medicines Agencies
[HMA] network). The EMRN’s main objective
is to achieve a consistent approach to medi-
cines regulation across the European Union
(EU). In collaboration with the network part-
ners, the EMA oversees the scientific evalua-
tion, safety and efficacy monitoring of human
(and veterinary) medicines in the EU. For most
innovative medicines, including those for rare
diseases, a central assessment and marketing
authorization coordinated by the EMA is com-
pulsory. In cases of human medicines, the
EMA’s Committee for Medicinal Products for
Human Use (CHMP) carries out a scientific
assessment, based on which the EC decides
whether to grant marketing authorization.
Once granted, such a centralized marketing
authorization is valid across the EU.
Predominantly though, medicines in the EU
are authorized by member states’ national
authorities.](https://image.slidesharecdn.com/pe-240724213222-aa326c35/85/Pharmacoepidemiology-pharmacoeconomics-308-320.jpg)
![Clinical Problems to be Addressed by Pharmacoepidemiologic Researc 281
Shared, key ethical requirements in
European pharmacoepidemiologic research
came to include beneficence, transparency, sci-
entific independence, and integrity. Yet, incon-
sistent application and authorization
procedures for clinical studies in EU and EEA
member states have long been criticized. This
also applies to pharmacoepidemiology and
pharmacovigilance. Especially for multi-
national, non-
interventional studies (NIS), it
has been lamented that “[. . .] a patchwork of
regulations and codes of conduct have to be
followed.”
Partly in response to some of these issues,
since the early 2000s new EU regulations,
directives and guidelines have been intro-
duced. These aim to facilitate ethical, effective
pharmacoepidemiologic practices in and
across different member states. Currently, cru-
cial regulatory changes are underway that will
affect pharmacoepidemiology and pharma-
covigilance in the EU.
The EU pharmacovigilance legislation aims
to minimize risks and harms posed by adverse
drug reactions (ADRs). Its implementation is
overseen by the EMA, EU member state
authorities, and the EC. Key legal documents
for the pharmacovigilance legislation and
pharmacoepidemiologic studies are EU regu-
lation No. 1235/2010 and directive 2010/84/
EC. In effect since 2012, the regulation out-
lines measures for safeguarding patients’
safety and rights and asserts the crucial role
of healthcare professionals in reporting
ADRs. It moreover acknowledges the neces-
sity to develop EU/EEA wide “[. . .] harmo-
nized guiding principles for, and regulatory
supervision of, post-
authorization safety stud-
ies that are requested by competent authori-
ties and that are non-
interventional, that are
initiated, managed or financed by the market-
ing authorization holder.” Among other deliv-
erables, the regulation established the
EudraVigilance database as a main platform
for the obligatory reporting of ADRs by mar-
keting authorization holders and respective
national authorities.
In response to the benfluorex scandal, the
legislation was amended in 2012. Servier phar-
maceuticals’ Mediator (benfluorex), marketed
as an add-
on for diabetes and hyperlipidemia,
was under pharmacovigilance investigation in
France since 1998. It was found in 2003 that
the drug caused cardiovascular complications.
In response, Servier did not re-
apply for mar-
keting authorization in Spain and Italy, effec-
tively withdrawing the product from the
market in those countries. However, benfluo-
rex continued to be available and approved for
diabetes treatment in France and other coun-
tries until 2009. Only then was the benfluorex
authorization fully revoked; its efficacy was
found to be limited and it risked causing car-
diac valvulopathy. Subsequently, EU regula-
tion No. 1027/2012 and Directive 2012/26/EC
were published, amending the 2010 EU phar-
macovigilance legislation. The amendments
especially addressed the issue that safety meas-
ures for medicinal products need to be imple-
mented consistently and in a timely fashion in
all member states where respective products
were authorized.
The benfluorex scandal points to broader
challenges regarding pharmacovigilance and
pharmacoepidemiologic research in the EU:
regulations and guidelines need to be applied
across multiple states and to different actors,
including national marketing authorization
holders and applicants. While the legislation
outlines fairly broad objectives, responsibili-
ties, and issues, these are specified in concrete
deliverables. One of these deliverables was the
founding of the EMA Pharmacovigilance Risk
Assessment Committee (PRAC) which moni-
tors and assesses drug safety in the EU.
Moreover, it initiated the development of the
EMA’s Good Pharmacovigilance Practices
(GVP) guideline, (described below).
The European Network of Centres for
PharmacoepidemiologyandPharmacovigilance
(ENCePP) was established in 2006 and is coor-
dinated by the EMA. It is an expertise and
resource network focused on pharmacoepide-
miology and
pharmacovigilance in Europe. It](https://image.slidesharecdn.com/pe-240724213222-aa326c35/85/Pharmacoepidemiology-pharmacoeconomics-309-320.jpg)
![Currently Available Solution 287
with local laws; research study registration;
and plans for disseminating study results.
However, ISPE GPP policies are nonbinding
and therefore do not resolve concerns regard-
ing national variations in ethical oversight and
requirements by regulatory agencies for post-
marketing pharmacoepidemiologic work.
EU policies provide a useful example of
transnational efforts at regulatory standardiza-
tion of GVPs. EU documents concerning bio-
medical research in general and
pharmacoepidemiologic research in particular
commonly speak of two types of clinical stud-
ies, broadly speaking: interventional, i.e.
experimental, and non-
interventional, some-
times called observational research. On the
one hand, pharmacoepidemiologic research
relies on non-
interventional study designs
such as case–control or cohort studies. On the
other hand, interventional, randomized clini-
cal trials (RCTs) are an important element of
post-
marketing pharmacoepidemiology stud-
ies (see Chapter 17).
The EMA defines GVPs as “a set of measures
drawn up to facilitate the performance of the
safetymonitoringof medicinesintheEuropean
Union.” It includes chapters on pharmacovigi-
lance processes as well as product- and
population-
specific considerations. For EU
pharmacoepidemiologic post-
authorization
safety studies (PASS), module VIII is particu-
larly relevant. PASS may be interventional or
non-
interventional. Although the module
touches upon interventional studies too,
emphasis is put on non-
interventional PASS.
In accordance with the EU pharmacovigi-
lance legislation, the GVP stipulates that the
EMA needs to ensure that protocols and
abstracts of PASS results are published. While
the primary/lead investigator is responsible for
the information provided, the registration may
be made by, for example, research center staff
or representatives of pharmaceutical compa-
nies funding a study. Where possible, this
should be done before the study commences.
Practically, registration and publication are
processed through the EU PAS register, hosted
by the ENCePP. As the ethics review procedure
and requirements for respective committees
depend on national legislation, information on
individual application procedures is not
included in the GVP. While there is no EU reg-
ulation or directive for NIS, interventional
studies are covered in the Clinical Trials
Regulation (CTR).
In the EU, methodological, ethical, and legal
requirements for pharmacoepidemiologic
research hinge significantly on whether a
study is categorized as a “clinical trial” or as
“non-
interventional/non-
experimental.” Both
categories are defined as “clinical studies”
aimed at discovering or confirming the
(adverse) effects of medicinal products. For
pharmacoepidemiologic studies involving
clinical trials, the introduction of the EU CTR
No. 536/2014 will soon be decisive. The CTR
was adopted on 16 April 2014 and entered into
force on 16 June 2014. For the regulation to
become applicable, an EU-
wide clinical trials
portal and database is required. Both need to
undergo an independent audit. According to
the EMA, the Regulation was supposed to
come into application in late 2019, starting a
transition period of three years. However, due
to technical difficulties concerning the plat-
form and database, this has been postponed
and EMA’s Management Board agreed to pro-
ceed with the audit in December 2020 (see
European Commission n.d.). The CTR is
meant to harmonize research practices and to
ensure the highest methodological and ethical
standards across all EU as well as EEA EFTA
(European Economic Area, European Free
Trade Association) member states. To what
extent it will deliver on these promises is under
discussion. The regulation replaces the
“Clinical Trials Directive” 2001/20/EC which
is said to have “[. . .] failed to achieve its goal of
simplifying the scientific and ethical review of
clinical trials in the EU.”
Moreover, the ENCePP had problematized
the NIS definition given in the 2001 directive.
The ENCePP raised the issue that the defini-
tion was not sufficiently specific and created](https://image.slidesharecdn.com/pe-240724213222-aa326c35/85/Pharmacoepidemiology-pharmacoeconomics-315-320.jpg)
![16 Bioethical Issues in Pharmacoepidemiologic Research
288
uncertainty as to what counts as NIS or RCT.
Pharmacoepidemiologic prospective case-
control studies − like the International Primary
Pulmonary Hypertension Study investigation
of primary pulmonary hypertension (PPH)
occurrence in association with anorectic
agents − would classify as a clinical trial
according to the 2001 directive. Its ambiguous
NIS definition was thus criticized for impeding
the conduct of pharmacoepidemiologic
studies.
The ENCePP Guide on Methodological
Standards in Pharmacoepidemiology (Revision
6, July 2017) lays down rules and principles for
transparency and scientific independence.
Chapter 9 of the Guide deals with ethical
aspects of pharmacoepidemiology, focusing on
patient and data protection and scientific
integrity and ethical conduct. It identifies key
values based on documents such as the
ADVANCE Code of Conduct for Collaborative
Vaccine Studies, the GPPs of the ISPE, and the
Good Epidemiology Practice (GEP) guidelines
of the International Epidemiological
Association. The Guide highlights that “[p]rin-
ciples of scientific integrity and ethical con-
duct are paramount in any medical research”
and points out that the abovementioned
ENCePP code of conduct “[. . .] offers stand-
ards for scientific independence and transpar-
ency of research in pharmacoepidemiology
and pharmacovigilance.” In addition, the
Guide highlights core values, such as best sci-
ence, strengthening public health, and improv-
ing transparency, as stressed by the ADVANCE
Code of Conduct. It moreover emphasizes the
need for ensuring scientific autonomy, benefi-
cence, non-
maleficence and justice, according
to the four general ethical principles defined in
the GEP guidelines.
Protections against Conflicts
of Interest for Drug Industry-
Sponsored Research
While industry-
sponsored research creates real
challenges for conflicts of interest, industry
also has an interest in maintaining public trust
in product integrity, as well as an interest in
compliance with regulatory ethical and meth-
odological requirements to obtain drug
approval. Thus, there is some incentive for
industry to address concerns about conflicts of
interest. The Board of Directors of the ISPE has
published a set of principles for academia-
industry collaboration that can be helpful in
managing industry conflicts of interest. It
includes the importance of transparent
research agreements, open and complete dis-
closure of conflicts of interest, registration of
research protocols in public sites such as the
ENCePP registry or http://ClinicalTrials.gov,
compliance with local laws, clarity on confi-
dentiality of proprietary information while
also ensuring reporting of all relevant and
important information to regulators, the
potential value of having a steering committee
and/or an independent advisory committee to
the research, and an obligation to disseminate
and publish research findings of potential sci-
entific or public health importance irrespec-
tive of results.
While all of these principles are helpful in
managing financial conflicts of interest, they
do not eliminate the inherent problem of drug
companies having a stake in the outcomes of
research that they sponsor or the ethical con-
cerns associated with the power dynamics of
industry directly funding investigators as
described above. To eliminate these underlying
ethical problems, the direct relationships in
which companies fund individual investigators
to assess specific products would need to be
severed. Alternative models that eliminate
these ethical conflicts can be easily envisaged.
For example, the British Drug Safety Research
Unit (DSRU), an independent charity sup-
ported by the National Health Service, con-
ducts publicly funded pharmacoepidemiologic
research. Still, the organization conducts a
large amount of research funded by uncondi-
tional donations from pharmaceutical compa-
nies. Yet, the companies have no control on the
conduct or the publication of the studies](https://image.slidesharecdn.com/pe-240724213222-aa326c35/85/Pharmacoepidemiology-pharmacoeconomics-316-320.jpg)
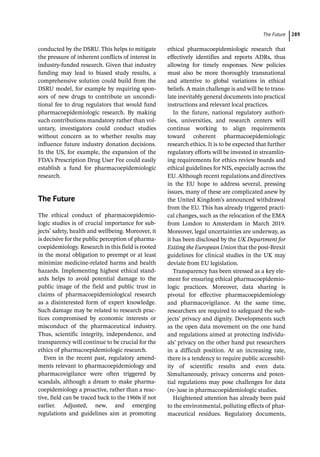
![16 Bioethical Issues in Pharmacoepidemiologic Research
290
such as the EU pharmacovigilance legislation,
acknowledge that “[t]he pollution of waters
and soils with pharmaceutical residues is an
emerging environmental problem.” Research
examining the adverse effects of pharmaceuti-
cals on the environment has been labeled as
pharmacoenvironmentology. With its focus on
the environmental impact of drugs given at
therapeutic doses, it is considered part of phar-
macovigilance. Assuming that environmental
issues will continue to be high on the political
and scientific agenda, pharmacoepidemiologic
expertise will be increasingly needed to assess
medicines as pollutants. In this context, phar-
macoepidemiologists will need to employ and
expand their methodological repertoire for
studies investigating medicines’ adverse effects
on the environment. This development might
also imply an amplified need for novel, inter-
disciplinary research collaboration involving
pharmacoepidemiologists. Such collaboration
is also characteristic for another emerging
intersection, between pharmacoepidemiology,
computer, and data science.
Research at the intersection of digital ser-
vices, big data, and public health is a poten-
tially promising, but precarious field. It has
been demonstrated that emerging, digital data
sources like social networking sites can func-
tion as complementary resources for pharma-
coepidemiology. The use of such data sources,
often referred to as a type of “big data,” is atypi-
cal for pharmacoepidemiologic studies, but
may become more common in the future.
Research drawing on “big data” may take place
outside of medical departments or hospitals,
e.g. conducted by data scientists. Big data and
emerging data science approaches have cre-
ated new possibilities for pharmacoepidemio-
logic research. For example, Freifeld et al. used
data from the social networking site and
microblogging service Twitter to monitor
ADRs.
The term “big data” has become associated
with various leaks and scandals. The United
Kingdom Science and Technology Committee
concluded in a 2015 report that data misuses
and leaks have led to public skepticism con-
cerning the use of big data. Not only such neg-
ative connotations, but also scientific concerns
regarding users’ consent, autonomy, and pri-
vacy raise ethical questions about big data
research. Pharmacoepidemiologic research
involving big data requires careful ethical con-
siderations for the individuals’ generating such
data, for example users of social networking
sites. Moreover, pharmacoepidemiologists
need to consider the biases inherent to digital
data sources: such bias can be caused by big
data retrieved from populations that do not
allow for generalizations. For instance, since
individuals included in a digital data sample
may represent only those using an expensive/
innovative technical device or service, these
users could be on average younger or above
average in access to health-
promoting
resources. In addition, the quality of such data
may differ from other sources of data (e.g.
medical records).
Research involving these alternative sources
of data is subject to different laws and regula-
tory frameworks when conducted in different
global settings. For the United States, access to
health relevant information via social net-
working sites such as Facebook is at present
legally possible, due to the lack of protection
for health-
relevant data retrieved outside of
the traditional health care and research sys-
tem. With regards to medical privacy, the
Electronic Frontier Foundation (EFF) points
out that social networking sites and other
online services compromise US citizens’ con-
trol over their health data: “The baseline law
for health information is the Health Insurance
Portability and Accountability Act (HIPAA).
HIPAA offers some rights to patients, but it is
severely limited because it only applies to an
entity if it is what the law considers to be either
a ‘covered entity’ − namely: a health care pro-
vider, health plan, or health care clearinghouse
− or a relevant business associate (BA).” This
also implies that content such as Facebook or
Twitter data, despite their actual use as health
indicators, are currently not protected under](https://image.slidesharecdn.com/pe-240724213222-aa326c35/85/Pharmacoepidemiology-pharmacoeconomics-318-320.jpg)
![16 Bioethical Issues in Pharmacoepidemiologic Research
292
Approach
In a retrospective approach, the authors
retrieved data from the social networking
site Facebook and the microblogging service
Twitter. These were scanned for signals cor-
relating with 10 post-
marketing safety sig-
nals reported in FAERS and flagged by the
FDA. For example, the authors examined
whether tweets indicated symptoms of vas-
culitis caused by Dronedarone or angi-
oedema caused by Pradaxa. Potentially
relevant posts were then compared with
those reported in FAERS, assessing where
symptoms were reported first.
Results
The study did not yield a clear outcome.
While some relevant social media data indi-
cated adverse effects for Multaq
(Dronaderone) before these were reported
by the FDA, this was not the case for others.
Strengths
Provided that approaches like these were to
become effective and reliable, harvesting
and analyzing data from social media could
complement existing pharmacoepidemio-
logic methods. Data from social media might
particularly serve as early warning signals.
Limitations
In a letter to the editor, Wiwanitkit (2017)
raised concerns over this study, questioning
the validity and reliability of social media
data. The commentator criticized that “[. . .]
the basic issue with these social media plat-
forms is of confidentiality and privacy.” This
raises the issue of whether it is ethical to use
social media data in the first place. In this
context, one should also consider the com-
plexity and challenge of fully anonymizing
big data. Moreover, others have pointed out
that when entering public-
private collabora-
tions, researchers need to go beyond ques-
tions concerning the quality of research or
privacy (Sharon 2016). Studies such as the
one conducted by Pierce et al. need to be
carefully examined with regard to power
asymmetries in access to data and control
over technology platforms. For example,
while some of the authors were employed by
the US FDA, others indicated that they were
employees of a technology company intend-
ing to commercialize the software platform
used in the research – a conflict of interest.
Such public–private partnerships also lead
to dependencies between partners and put
involved companies in a powerful position:
this concerns the corporate ownership of
public health data on the one hand and
researchers’ reliance on commercial tech-
nologies on the other. Ethical issues aside,
one should also not forget that the effective-
ness of such novel approaches and their
place in the methodological repertoire of
pharmacoepidemiology are still under
scrutiny.
Key Points
●
● Data, in this case user-
generated content,](https://image.slidesharecdn.com/pe-240724213222-aa326c35/85/Pharmacoepidemiology-pharmacoeconomics-320-320.jpg)
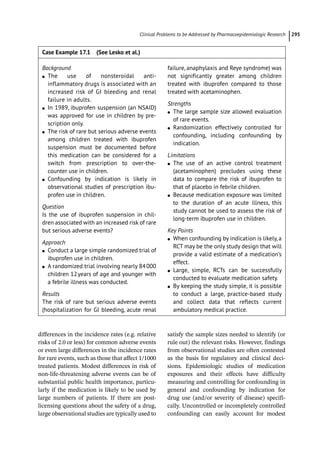
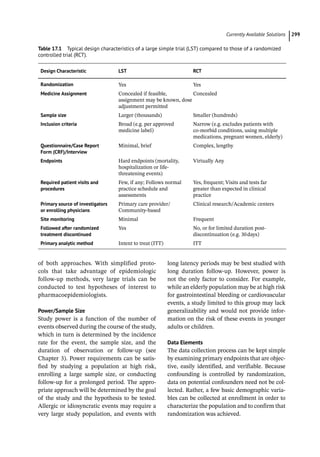
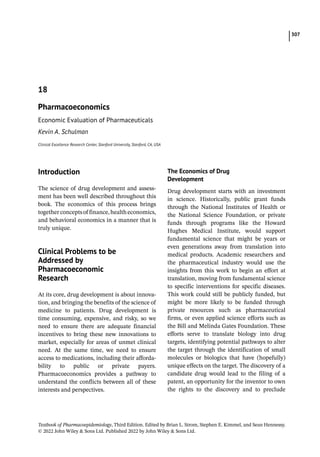
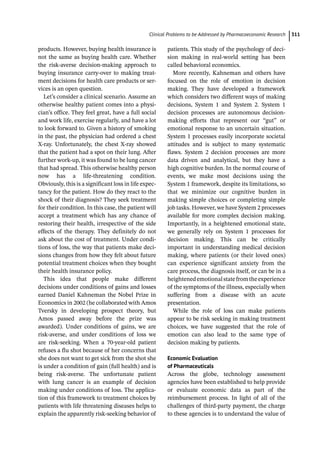
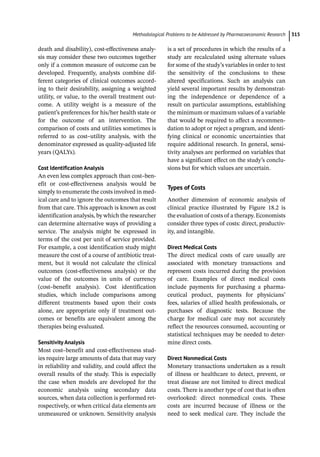

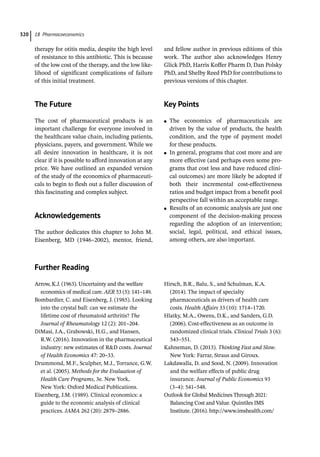
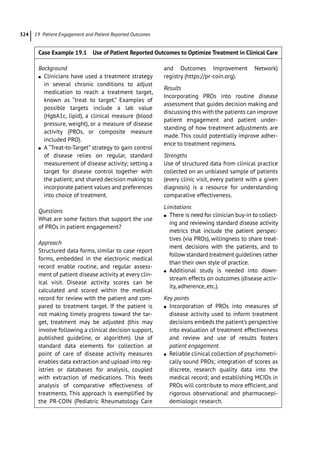
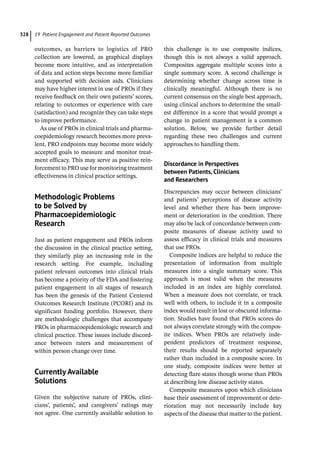

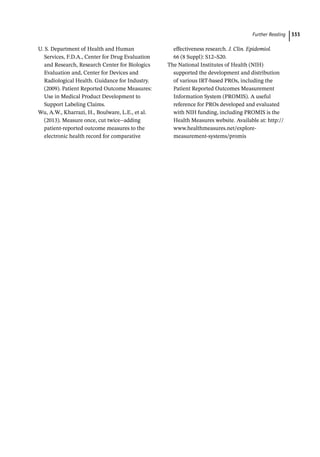


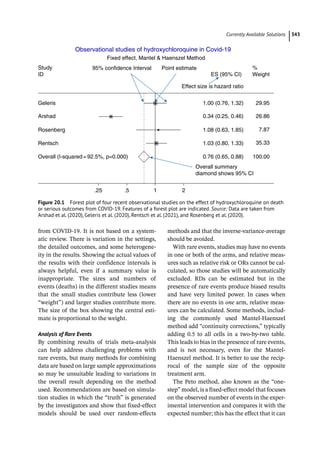

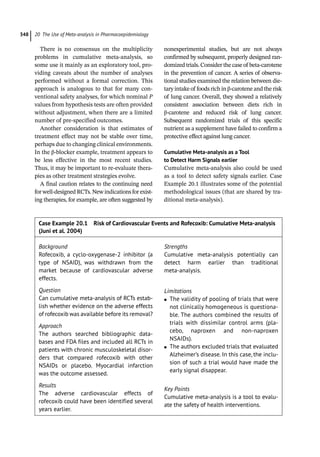
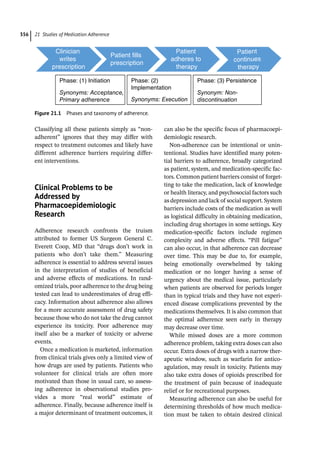
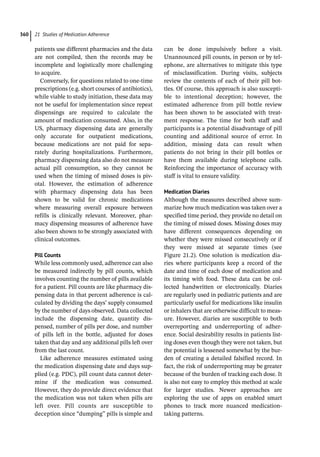
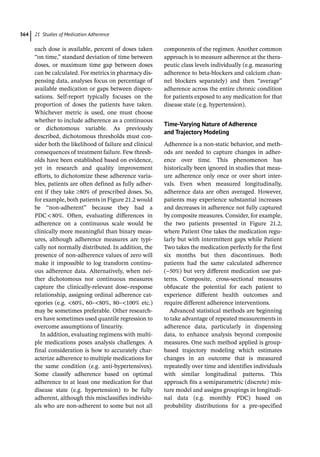
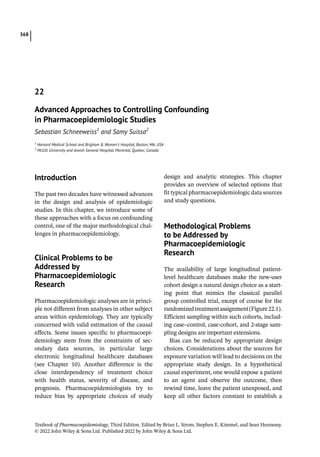
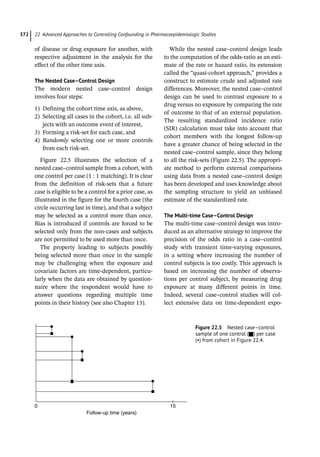
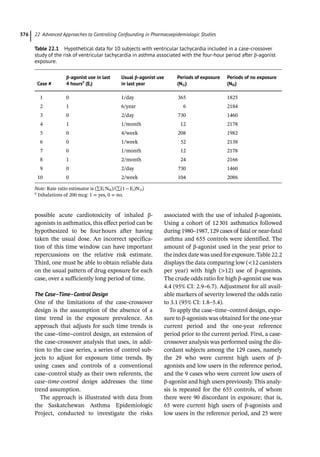
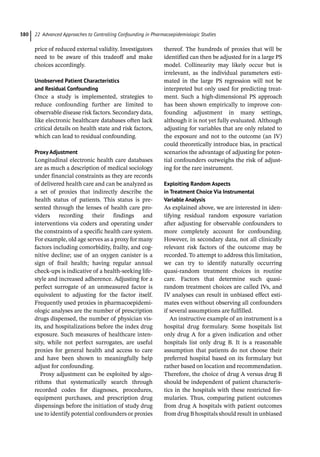
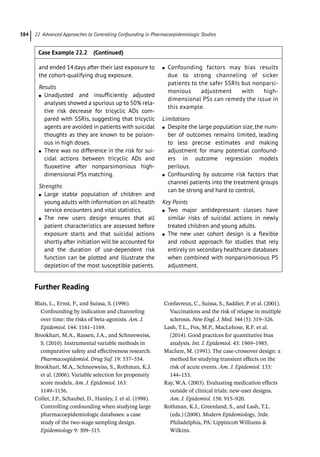


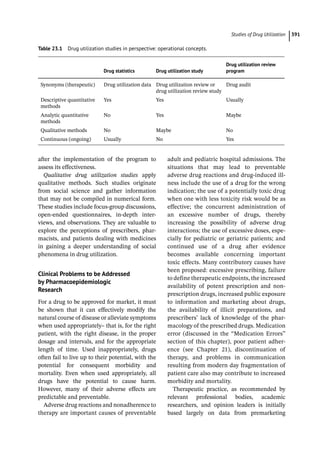
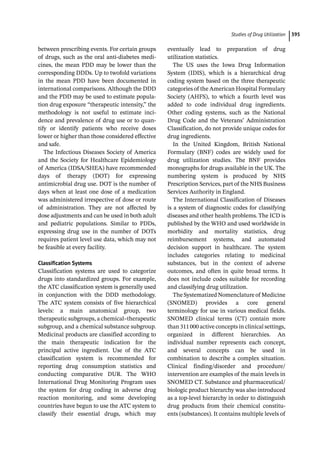
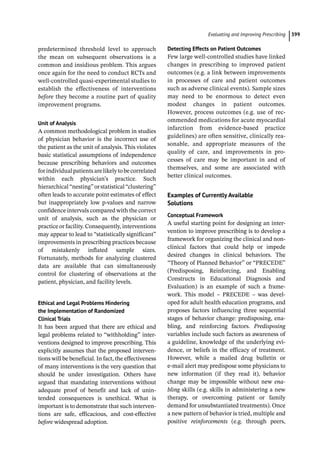
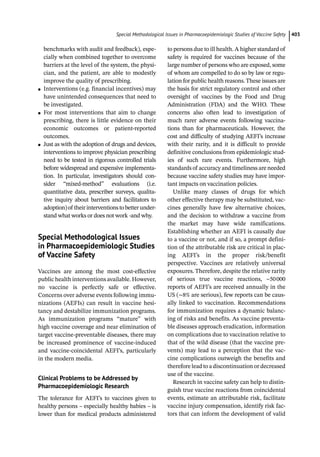
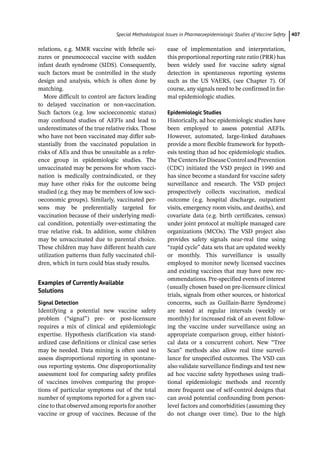
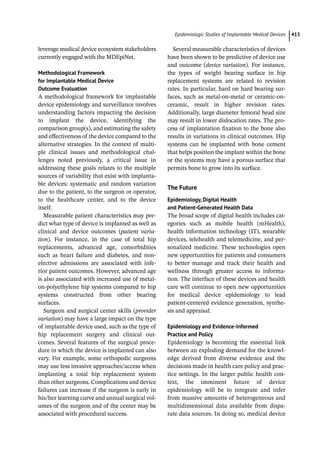
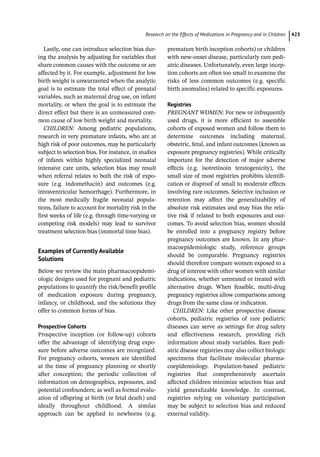
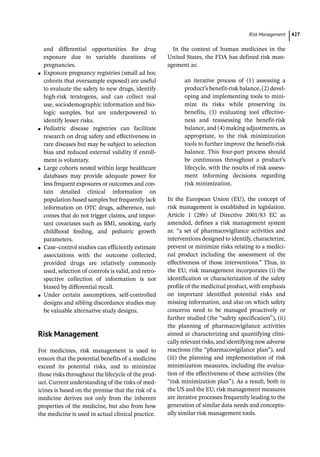
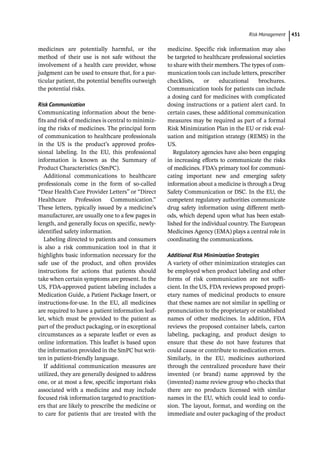
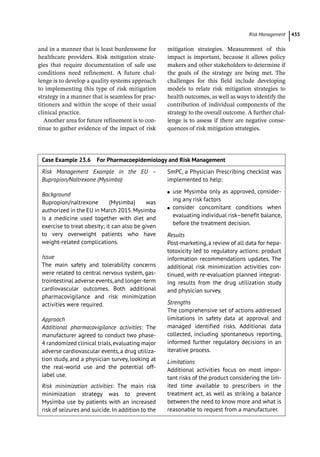
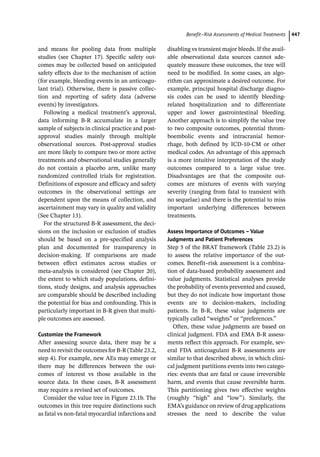
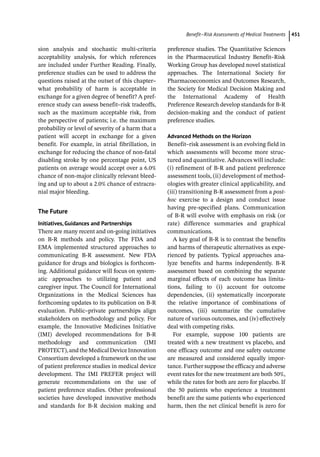
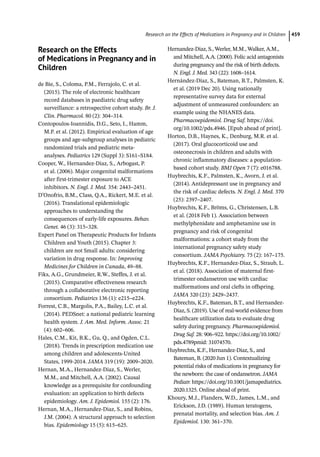
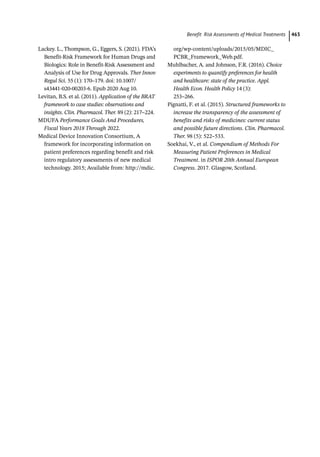
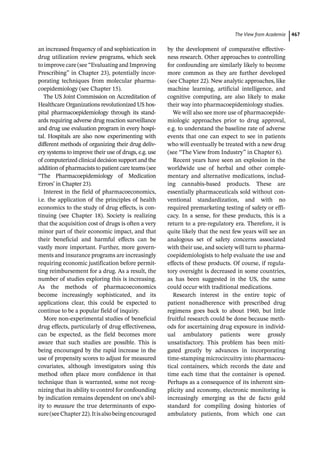


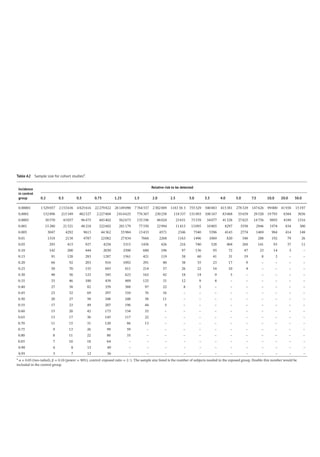
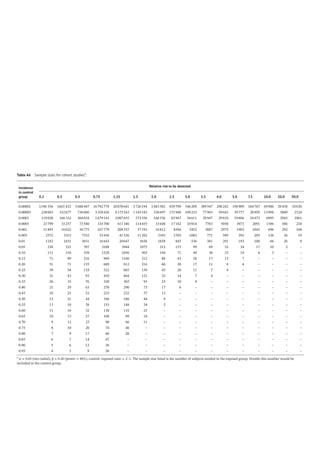
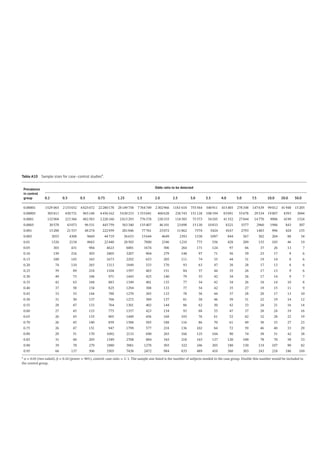
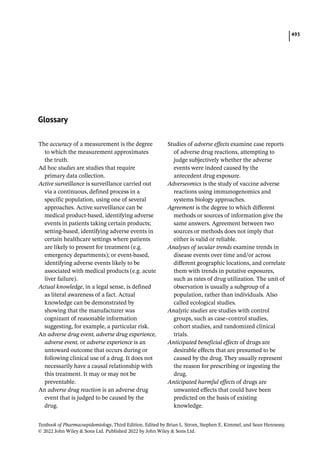

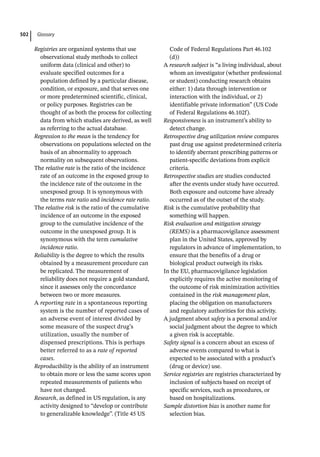
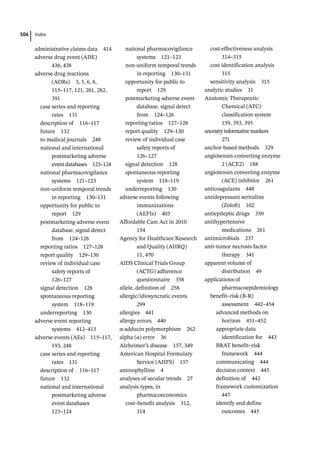
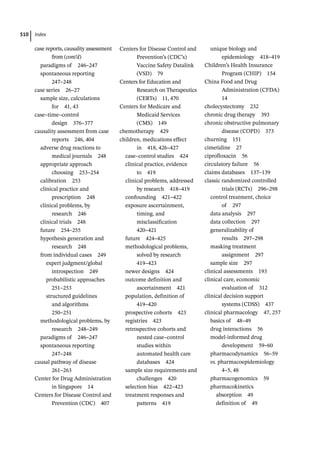
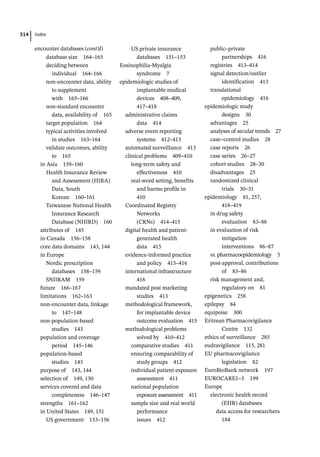
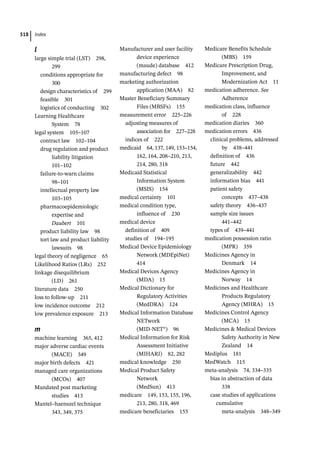
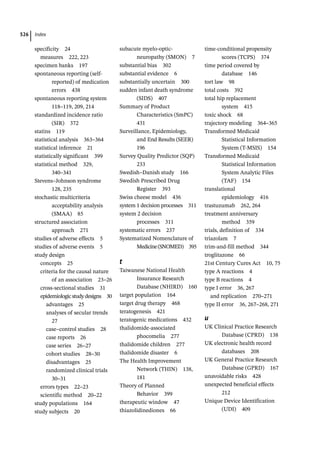


The 'Textbook of Pharmacoepidemiology' (third edition) provides an extensive overview of the field, covering key concepts, study designs, and methodologies essential for understanding the impacts of pharmaceuticals in populations. Edited by Brian L. Strom, Stephen E. Kimmel, and Sean Hennessy, it addresses historical context, current practices, and the relevance of pharmacoepidemiology in drug approval and safety evaluations. The book includes contributions from various experts, ensuring a comprehensive resource for researchers and practitioners.


![Investigational New drug application [INDA]](https://cdn.slidesharecdn.com/ss_thumbnails/investigationalnewdrugapplicationinda-160619063044-thumbnail.jpg?width=640&height=640&fit=bounds)


