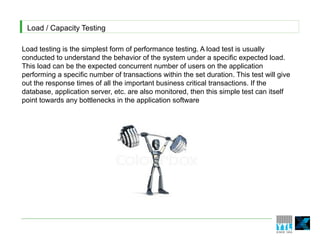
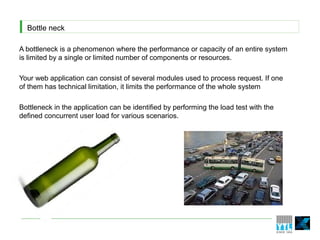
The document provides information about performance testing using Jmeter 2.6. It discusses what performance testing is and the different types including load/capacity testing, stress testing, volume testing, endurance testing, and spike testing. Load testing is described as the simplest form of performance testing to understand system behavior under an expected load. Bottlenecks can be identified through load testing. Stress testing finds a system's capacity limit. Volume testing checks efficiency by processing huge data amounts. Endurance testing checks if a system can withstand load for long periods. Spike testing suddenly increases load to observe behavior. Pre-requisites for performance testing and load testing tools are also mentioned, with JMeter described as an open source tool that can test various server
The document provides an overview of performance testing and the JMeter load testing tool. It defines performance testing as testing to determine how a system performs under workload. The main types of performance testing are described as load/capacity testing, stress testing, volume testing, endurance/soak testing, and spike testing. Load testing is the simplest form and aims to understand system behavior under expected load. Bottlenecks can be identified through load testing. Stress testing finds a system's capacity limit. Volume testing checks efficiency processing large data amounts. Endurance testing checks withstanding load over long periods. Spike testing observes behavior under sudden load increases. JMeter is introduced as an open source load testing tool that can test various system types and has user
JMeter is an Open source tool. Can load and performance test many different server types: Web - HTTP, HTTPS, SOAP, Database via JDBC, LDAP, JMS, Mail - POP3(S) and IMAP(S).
User friendly GUI Design compare to other tools.
Apache JMeter is a tool for testing web application performance and load testing. It allows users to simulate multiple users sending requests to a server in order to determine how well an application can handle heavy loads. JMeter provides graphs and reports to analyze performance and identify issues. It can test many server types including web servers, databases, FTP servers, and more. It is an open source tool that runs on many operating systems and allows for load testing from both graphical user interfaces and command line scripts.
Performance testing with Apache JMeterRedBlackTree
The document discusses performance testing using JMeter. It covers the focus of performance testing including speed, scalability, and stability. It explains why performance testing is needed to uncover issues before product release. Different types of performance testing are described like load, stress, soak, spike, and volume testing. An overview is provided of JMeter including its open source nature, server types supported, and work flow. Key concepts in JMeter are explained such as test script recording, HTTP Cookie Manager, load analysis using thread groups and listeners, using assertions, controllers, timers, correlation, HTML link parsing, and data-driven testing with CSV files.
The document provides information about performance testing with JMeter including example steps to write a JMeter script for a sample performance test scenario. The summary is:
The document discusses writing a JMeter script to simulate 30 concurrent users each sending 600 orders over 3 minutes to test the performance of an order processing system. It provides details on setting up thread groups, variables, CSV data configuration, HTTP requests, assertions and includes example XML payloads and JMeter script structure. Flexibility in JMeter is discussed including using BeanShell scripting and plugins to add custom functionality.
Apache JMeter is an Apache project that can be used as a load testing tool for analyzing and measuring the performance of a wide range of services, with a particular emphasis on web applications
JMeter is a free and open source desktop application used to load test and performance test web services, data bases, and other applications. It provides a GUI interface and can also be run in non-GUI mode via command line. A JMeter test plan contains thread groups, samplers, listeners, timers, and other elements to simulate load on a system and measure performance. JMeter scripts can be recorded by configuring JMeter as a proxy server or imported from other recording tools. Running JMeter tests helps identify bottlenecks and ensure systems can handle expected loads.
JMeter - Performance testing your webappAmit Solanki
JMeter is an open-source tool for performance and load testing web applications. It can test applications by simulating heavy loads to determine stability and identify performance bottlenecks. JMeter simulates multiple users accessing web services concurrently to model expected usage during peak periods. It provides instant visual feedback and allows tests to be run interactively or in batch mode for later analysis. Tests are composed of thread groups, samplers, timers, listeners and other elements to control test flow and capture response data. JMeter also supports distributed testing across multiple servers to simulate very large loads.
JMeter is an Apache Jakarta project that can be used as a load testing tool for analyzing and measuring the performance of a variety of services, with a focus on web applications.
www.silenceit.ca
This document provides an overview of performance testing using JmeterTool. It discusses key concepts like load testing, stress testing, and endurance testing. It describes the goals of performance testing such as assessing production readiness and discovering bottlenecks. The prerequisites for performance testing and typical testing lifecycle are also outlined. Best practices like using ramp up/down periods and repeating tests are recommended. Challenges in performance testing and common fixes to performance issues are also covered. Finally, it provides an introduction to the various elements in Jmeter like samplers, listeners, timers, and controllers that are used to build test plans and simulate load on systems.
This document provides an overview and introduction to JMeter, an open source performance testing tool. It discusses JMeter's history, features, and how it can be used to load test web applications and measure performance. The key components of JMeter are explained, including test plans, thread groups, samplers, listeners, controllers, timers and more. It also provides a demonstration of recording a web application with JMeter and playing it back to simulate load.
It's a very basic introduction of Load Runner for beginners, i explored it at my own, prepared slides & shared it with my colleagues.
What is Load Runner & why we need Performance testing etc.
Enjoy :)
Performance testing with JMeter provides an introduction to key concepts and how to implement performance tests using JMeter. Some important steps include designing test plans, preparing the environment, determining metrics and goals, notifying stakeholders, and using JMeter elements like thread groups, samplers, listeners, assertions and configuration elements to simulate load and measure performance. JMeter is an open source tool that can run in GUI or non-GUI mode for load testing web applications and determining maximum operating capacity and bottlenecks under heavy loads.
Load testing is performed using tools like JMeter to determine how a system performs under normal and peak load conditions. JMeter is an open source load testing tool that can simulate many users accessing a web application concurrently. It allows users to record tests from a browser, parameterize tests using variables and CSV files, add logic and functions, and analyze results. While it has limitations like not supporting all embedded content and being limited by a single computer's network connection, JMeter is a powerful free load testing option supported on many platforms.
Load testing is done to determine system limits, verify response times under high load, check stability, and predict future needs. Open source tools like JMeter, Yandex Tank, and Taurus can be used. With JMeter, a test plan is created with thread groups, HTTP requests, and listeners to start load testing. Issues like slow responses or server crashes are identified. Short term fixes include restarting servers or tuning configurations, while long term solutions involve moving to the cloud, using caching, or splitting applications into microservices. Other commercial load testing tools are also available from companies like SOASTA and BlazeMeter.
Apache Jmeter 3.2 is an open source performance testing tool for load and functional testing of web applications. It can test HTTP, HTTPS, FTP, TCP, databases via JDBC, LDAP, mail protocols and more. Jmeter is a 100% Java application that is lightweight and can run on Linux/Windows. It is recommended to have an Intel Core i5 CPU, 32GB RAM, 500GB HD or SSD, 1GB Ethernet, 30M upload and download bandwidth for optimal performance testing with Jmeter.
How to Simplify Load Testing: JMeter and BeyondAndrey Pokhilko
The document discusses simplifying load testing by introducing Taurus, an open source tool that uses a YAML configuration file to orchestrate and automate the load testing process including test execution, monitoring, reporting, and scaling across different load testing tools like JMeter, Gatling, and Selenium. Taurus provides features for DevOps-style testing, supports running multiple heterogeneous tests simultaneously, and integrates with services for scaling and collaborative reporting.
This document introduces JMeter, an open source load testing tool. It discusses performance testing concepts like load testing and stress testing. It then provides an overview of JMeter's basic elements like test plans, thread groups, samplers, assertions, listeners, timers and config elements. It also mentions some useful JMeter plugins and provides an example test plan configuration.
Sadece uygulamalarınızın değil database sorgularınızın da performansını ölçmek için JMeter kullanabilirsiniz.
Güçlü bir teknik test ürünü olan JMeter ile hangi sorgunuzun daha sorunlu olduğunu bulalım.
You can use JMeter not only for measuring your applications performance but also your database queries.
With this powerfull technical test tool, you can discover which database queries takes most of the time.
Using JMeter for Performance Testing Live Streaming ApplicationsBlazeMeter
With live video usage increasing to watch sporting events, popular TV shows, etc., load and performance testing live streaming applications has become a must to ensure they can withstand heavy traffic.
Our Sep 6, 2017 webinar looked at using Apache JMeter™ for testing streaming applications. Until now, JMeter supported the load testing of HTTP Live Streaming (HLS) applications, the leading protocol, with a few different elements. But now, a new HLS plugin for JMeter makes the process much simpler and efficient than before.
An overview of the HLS protocol including its key components
An introduction to the new JMeter HLS plugin
How to learn more and get involved with this open-source project
It gives you an basic over view to start up with Jmeter. This slide encourage you to start from basic terminology in the Performance Testing field. It contains information about Different subcategory of Performance Testing. The main focus is to connect performance testing with Jmeter.
Performance testing involves testing a system to determine how it performs under a particular workload. The document discusses various types of performance testing like load/capacity testing, stress testing, volume testing, endurance testing, and spike testing. It also discusses concepts like bottlenecks, prerequisites for performance testing, popular load testing tools like JMeter, and how to use key JMeter features for performance testing like adding users, HTTP requests, listeners, parameterization, correlation, assertions, and distributed testing.
jMeter is an open source load and performance testing tool. It is a 100% Java application that simulates user load on servers and applications. It can test websites, web services, databases, and other application components. jMeter works by recording user actions as test plans that can then be replayed concurrently to simulate multiple users accessing the system. Key components of a jMeter test plan include thread groups, samplers, listeners, and assertions. Listeners and reports provide output on system performance during the load test.
Soft Test Ireland - Introduction to Jakarta Jmeter - Philip BannonDavid O'Dowd
This document provides an introduction to functional, performance, and non-functional testing with JMeter. It discusses what JMeter is, how it works, its main components, and how to perform tests. It also provides demonstrations of creating functional and performance tests with JMeter.
JMeter is a tool for load testing web applications. It allows users to simulate heavy loads on servers to test performance. The document discusses how to automate testing using JMeter by creating test plans with thread groups representing users, HTTP requests to test web pages, and listeners to view results. Key steps include using the HTTP Proxy Server to record browser navigation and create test samples, configuring default request properties, and running tests with multiple threads over many iterations to simulate load.
This document discusses performance testing using JMeter. It provides an overview of different types of performance tests like load testing, stress testing, spike testing etc. and how they are used to identify bottlenecks. It then describes how to install and configure JMeter for performance testing. Steps are provided to add thread groups, samplers, listeners and other components. Techniques like correlation, remote testing are also summarized. The goal is to help understand how to effectively use JMeter for load and performance testing of web applications.
Performance testing is conducted to determine how a system performs under different workloads in terms of responsiveness and stability. Load testing is the simplest form and involves testing the system with specific expected loads to identify any bottlenecks. A bottleneck occurs when a single component limits the performance of the entire system. Stress, spike, endurance and volume testing are other types that help identify the system's capacity limits and how it behaves under extreme conditions. JMeter is an open source tool used for load and performance testing of web applications and services. It allows recording and playback of test scenarios with multiple user loads and assertions to analyze response times and errors.
Performance testing involves determining how a system performs under a specific workload. Load testing is a type of performance testing that evaluates a system as the number of concurrent users increases to the expected load. JMeter is an open source load testing tool that can be used to simulate many different types of network traffic. It provides various elements like samplers, listeners, timers and controllers that allow building test plans to generate and measure load.
Performance testing is used to determine how well a system performs under load. Key aspects include throughput, response time, tuning, and benchmarking. JMeter is a popular tool for load and performance testing. It allows recording tests, inserting timers and controllers, running tests, and analyzing results to identify bottlenecks. Common test types include load testing, stress testing, endurance testing, and volume testing. Performance testing helps ensure an application is scalable, stable, available, serviceable, and responsive under expected and unexpected user loads.
JMeter is an open-source load testing tool that can test various server types including web servers. It allows performance testing by simulating a heavy load on a system and stress testing to push a system to its limits. Key benefits of JMeter include its ability to test HTTP, database, JMS, mail protocols and more. It also has a full multithreading framework and customizable plugins. Creating a test plan in JMeter involves adding thread groups to simulate users, HTTP request samplers, listeners to view results, and other elements like timers, assertions and post-processors. JMeter also supports recording tests from a browser and distributed testing across multiple machines.
The document introduces performance testing basics and methodology using Oracle Application Testing Suite. It covers types of performance testing like load testing, stress testing, and volume testing. It emphasizes the importance of setting up realistic user scenarios and test scripts. The testing environment should replicate production and use dedicated agent machines to generate load. Performance testing helps identify bottlenecks and determine scalability.
These slides is from a session about load testing. It starts with an introduction to non-functional testing then demonstrating the phases and criteria of load testing with K6.
- JMeter is an open source load testing tool that can test web applications and other services. It uses virtual users to simulate real user load on a system.
- JMeter tests are prepared by recording HTTP requests using a proxy server. Tests are organized into thread groups and loops to simulate different user behaviors and loads.
- Tests can be made generic by using variables and default values so the same tests can be run against different environments. Assertions are added to validate responses.
- Tests are run in non-GUI mode for load testing and can be distributed across multiple machines for high user loads. Test results are analyzed using aggregated graphs and result trees.
The document provides an overview of performance testing, including:
- Defining performance testing and comparing it to functional testing
- Explaining why performance testing is critical to evaluate a system's scalability, stability, and ability to meet user expectations
- Describing common types of performance testing like load, stress, scalability, and endurance testing
- Identifying key performance metrics and factors that affect software performance
- Outlining the performance testing process from planning to scripting, testing, and result analysis
- Introducing common performance testing tools and methodologies
- Providing examples of performance test scenarios and best practices for performance testing
Automated performance testing simulates real users to determine an application's speed, scalability, and stability under load before deployment. It helps detect bottlenecks, ensures the system can handle peak load, and provides confidence that the application will work as expected on launch day. The process involves evaluating user expectations and system limits, creating test scripts, executing load, stress, and duration tests while monitoring servers, and analyzing results to identify areas for improvement.
Automated performance testing simulates real users to determine an application's speed, scalability, and stability under load before deployment. It helps detect bottlenecks, ensures the system can handle peak usage, and provides confidence that the application will work as expected on launch day. The process involves evaluating user needs, drafting test scripts, executing different types of load tests, and monitoring servers and applications to identify performance issues or degradation over time.
This document provides an introduction to JMeter, an open source performance testing tool. It discusses what JMeter is used for, its key features, components, strengths and weaknesses. It also provides instructions on setting up and running JMeter, including building a test plan with thread groups, samplers, listeners and other elements. The document demonstrates how to perform tasks like parameterization, session handling, and distributed testing with JMeter.
The document provides an overview of different types of performance testing that can be done using LoadRunner software, including speed tests, contention tests, volume tests, stress/overload tests, fail-over tests, spike tests, and endurance tests. For each type of test, it describes the goal of the testing, examples of what would be tested, and example accomplishments/outcomes. It also provides details on who will teach a course on performance testing with LoadRunner and examples of projects that will be used.
The document provides an overview of various types of performance testing that can be conducted including speed tests, contention tests, volume tests, stress/overload tests, fail-over tests, spike tests, endurance tests, scalability tests, and availability tests. For each type of test, it describes the purpose and provides examples of accomplishments. It also outlines the course topics to be covered related to performance planning, load testing, and tools.
The document provides an overview of software test automation and testing frameworks. It discusses:
- What test automation is and where it fits in the software development life cycle. Key benefits include increasing test coverage, reducing manual testing, and enabling regression testing.
- What testing frameworks are and why they are needed. Frameworks provide standardized environments for executing automated tests and reporting results.
- The main types of testing frameworks: modular, data-driven, and keyword-driven. Data-driven frameworks separate test data from test scripts for increased flexibility.
- A shift from traditional waterfall models to more agile development approaches and the rise of test-driven development and behavior-driven development.
Similar to Performancetestingjmeter 121109061704-phpapp02 (20)
Welcome to ASP Cranes, your trusted partner for crane solutions in Raipur, Chhattisgarh! With years of experience and a commitment to excellence, we offer a comprehensive range of crane services tailored to meet your lifting and material handling needs.
At ASP Cranes, we understand the importance of reliable and efficient crane operations in various industries, from construction and manufacturing to logistics and infrastructure development. That's why we strive to deliver top-notch solutions that enhance productivity, safety, and cost-effectiveness for our clients.
Our services include:
Crane Rental: Whether you need a crawler crane for heavy lifting or a hydraulic crane for versatile operations, we have a diverse fleet of well-maintained cranes available for rent. Our rental options are flexible and can be customized to suit your project requirements.
Crane Sales: Looking to invest in a crane for your business? We offer a wide selection of new and used cranes from leading manufacturers, ensuring you find the perfect equipment to match your needs and budget.
Crane Maintenance and Repair: To ensure optimal performance and safety, regular maintenance and timely repairs are essential for cranes. Our team of skilled technicians provides comprehensive maintenance and repair services to keep your equipment running smoothly and minimize downtime.
Crane Operator Training: Proper training is crucial for safe and efficient crane operation. We offer specialized training programs conducted by certified instructors to equip operators with the skills and knowledge they need to handle cranes effectively.
Custom Solutions: We understand that every project is unique, which is why we offer custom crane solutions tailored to your specific requirements. Whether you need modifications, attachments, or specialized equipment, we can design and implement solutions that meet your needs.
At ASP Cranes, customer satisfaction is our top priority. We are dedicated to delivering reliable, cost-effective, and innovative crane solutions that exceed expectations. Contact us today to learn more about our services and how we can support your project in Raipur, Chhattisgarh, and beyond. Let ASP Cranes be your trusted partner for all your crane needs!
EV Charging at MFH Properties by Whitaker JamiesonForth
Whitaker Jamieson, Senior Specialist at Forth, gave this presentation at the Forth Addressing The Challenges of Charging at Multi-Family Housing webinar on June 11, 2024.
Understanding Catalytic Converter Theft:
What is a Catalytic Converter?: Learn about the function of catalytic converters in vehicles and why they are targeted by thieves.
Why are They Stolen?: Discover the valuable metals inside catalytic converters (such as platinum, palladium, and rhodium) that make them attractive to criminals.
Steps to Prevent Catalytic Converter Theft:
Parking Strategies: Tips on where and how to park your vehicle to reduce the risk of theft, such as parking in well-lit areas or secure garages.
Protective Devices: Overview of various anti-theft devices available, including catalytic converter locks, shields, and alarms.
Etching and Marking: The benefits of etching your vehicle’s VIN on the catalytic converter or using a catalytic converter marking kit to make it traceable and less appealing to thieves.
Surveillance and Monitoring: Recommendations for using security cameras and motion-sensor lights to deter thieves.
Statistics and Insights:
Theft Rates by Borough: Analysis of data to determine which borough in NYC experiences the highest rate of catalytic converter thefts.
Recent Trends: Current trends and patterns in catalytic converter thefts to help you stay aware of emerging hotspots and tactics used by thieves.
Benefits of This Presentation:
Awareness: Increase your awareness about catalytic converter theft and its impact on vehicle owners.
Practical Tips: Gain actionable insights and tips to effectively prevent catalytic converter theft.
Local Insights: Understand the specific risks in different NYC boroughs, helping you take targeted preventive measures.
This presentation aims to equip you with the knowledge and tools needed to protect your vehicle from catalytic converter theft, ensuring you are prepared and proactive in safeguarding your property.
Implementing ELDs or Electronic Logging Devices is slowly but surely becoming the norm in fleet management. Why? Well, integrating ELDs and associated connected vehicle solutions like fleet tracking devices lets businesses and their in-house fleet managers reap several benefits. Check out the post below to learn more.
What Could Be Behind Your Mercedes Sprinter's Power Loss on Uphill RoadsSprinter Gurus
Unlock the secrets behind your Mercedes Sprinter's uphill power loss with our comprehensive presentation. From fuel filter blockages to turbocharger troubles, we uncover the culprits and empower you to reclaim your vehicle's peak performance. Conquer every ascent with confidence and ensure a thrilling journey every time.
Ever been troubled by the blinking sign and didn’t know what to do?
Here’s a handy guide to dashboard symbols so that you’ll never be confused again!
Save them for later and save the trouble!
Expanding Access to Affordable At-Home EV Charging by Vanessa WarheitForth
Vanessa Warheit, Co-Founder of EV Charging for All, gave this presentation at the Forth Addressing The Challenges of Charging at Multi-Family Housing webinar on June 11, 2024.
2. What is Performance testing?
Performance testing is an non-functional testing performed to determine how
a system performs in terms of responsiveness and stability under a particular
workload. It can also serve to investigate, measure, validate or verify other quality
attributes of the system, such as scalability, reliability and resource usage
GOAL/OBJECTIVE IS TO FIND THE BOTTLE NECK IN THE SYSTEM
3. What are the types of Performance Testing?
Load/Capacity Testing Stress Testing Volume Testing
Endurance/Soak Testing Spike
Testing
4. Load / Capacity Testing
Load testing is the simplest form of performance testing. A load test is usually
conducted to understand the behavior of the system under a specific expected load.
This load can be the expected concurrent number of users on the application
performing a specific number of transactions within the set duration. This test will give
out the response times of all the important business critical transactions. If the
database, application server, etc. are also monitored, then this simple test can itself
point towards any bottlenecks in the application software
5. Bottle neck
A bottleneck is a phenomenon where the performance or capacity of an entire system
is limited by a single or limited number of components or resources.
Your web application can consist of several modules used to process request. If one
of them has technical limitation, it limits the performance of the whole system
Bottleneck in the application can be identified by performing the load test with the
defined concurrent user load for various scenarios.
6. Stress Testing
Every system has a capacity limit. When the load goes beyond the limit, the web site
starts responding very slowly and even produce errors.
The purpose of the stress testing is to find the capacity limit of the system. In we can
verify at which point of time the system degrades or fails. Usually done by increasing
the user load in the system.
7. Volume Testing
Volume testing is done against the efficiency of the application. Huge amount of data
is processed through the application (which is being tested) in order to check the
extreme limitations of the system.
The limitation will be concluded upon the slow in the system performance and the
failure in the application.
8. Endurance Testing
This type of testing is used to check that the system can withstand the load for a long
or large number of transaction.
Test will be performed with defined set of concurrent users for a prolonged period of
time, say for example 5 to 10 hours or 2 to 3 days.
9. Spike Testing
Spike testing is done by suddenly increasing the number of load generated by, users
by a very large amount and observing the behavior of the system. The goal is to
determine the performance degrade, system failure or it will be able to handle
dramatic changes in load.
Say for example, test will be initiated with 200 concurrent user for a certain period of
time, suddenly the concurred user load will be increased to 1000 and the system
performance will be monitored. Like wise the user load will be decreased to 200
concurrent users and verify the system returns to normal operation and retaining the
performance as initiated.
10. Pre-requisites
• NFR document should be available – It will provide you the expected Response time and
required Concurrent user load, Scenarios to be tested and other performance attributes.
• Dedicated Performance test environment should be ready in place.
• Scalability on the test environment to the actual production environment should be
available.
• Gather the environment details like App, Web and DB servers configurations and their
capacity.
• Performance Test approach document should be ready and sing-off from the stake
holders.
11. Load Testing Tools
o Load Runner, commercial load testing tool from HP
o JMeter, an open source tool from Appache
o RPT, commercial load test tool from IBM
o NeoLoad, commercial, for Windows, Linux, Solaris
o Microsoft Visual Studio Team System 2010, commercial, for Windows, which includes Load
Test Analyzer and Load Test Monitor tools.
o OpenLoad, commercial load testing tool and hosted service
o OpenSTA, an open source tool
o PureLoad, commercial, multiplatform load testing tool
o PushToTest TestMaker, an open source testing framework (load testing and more)
o QEngine, free and commercial, from AdventNet (free edition supports 5 virtual users)
o SQLQueryStress Performance Testing Tool, free, for testing SQL Server StressIT, commercial
and free
o The Grinder, an open source tool
o Flood, open source from and for Apache
o WAPT, Web Application Testing tool, a commercial product, for Windows
o WatchMouse, commercial hosted load testing service
o WebKing, commercial, multiplatform
o WebServer Stress Tool, commercial and free, from Paessler
12. Why JMeter?
It is an Open source tool.
Can load and performance test many different server types:
Web - HTTP, HTTPS
SOAP
Database via JDBC
LDAP
JMS
Mail - POP3(S) and IMAP(S)
User friendly GUI Design compare to other tools.
Full multithreading framework allows concurrent sampling by many threads and
simultaneous sampling of different functions by separate thread groups.
Caching and Cookies can be enabled and it impact as such as it is executing in the web
browser.
Controllers are configurable and can monitor the server performance.
Test results are more reliable compare to other open source tools.
Test results can be captured in various format like summary report, Graph, Aggregate
report, Aggregate graph, Results in tree and Results in Table.
13. Installing Jmeter
• Install Java (2.2. or higher)
• Download JMeter http://jakarta.apache.org/site/downloads/index.html
• Add path of java installation in environment path variables.
14. Running JMeter In Windows
Open command prompt (user administrative mode to avoid unnecessary hassle).
Traverse to [jmeter installation path]bin
Run Jmeter.bat
15. Elements of Test Plans
• Thread Group
– Setup number of thread
– Set up ramp up period
– No. of times test executes
• Controllers
– Sampler (Send Request to Server)
– Logical Controller (Customize logic to send request)
• Listener
– Graph Result
– View Results Tree and many more.
• Timers
– Delay next request for certain amount of time
Continue….
16. Elements of Test Plans
• Assertions
– Allow you to assert fact about responses received from HTTP request
• Configuration Elements
– Allow you configure settings
• Preprocessor
– Execute prior to sampler request
• Post Processor
– Execute some action after sampler request
20. Adding users
• 5 users send 2 requests on cfminds.com and repeat it twice. (5 users x 2 requests x 2
repeat = 20 requests)
• Right click on test note >> Add >> Thread (users) >> Thread Group
21. Add default http request
• You can add default http request setting from ADD >> Config Element >> HTTP request
default.
• This will let you define default http parameter for every request.
22. Adding HTTP Request element
• You can add it from ADD> Sampler >> HTTP Request
23. Adding Listner to view Result
• Listner responsible for storing all of the results of our HTTP request and presenting in
Visualize mode.
28. Recording Your Test Plan
• JMeter Proxy can use to record all request send to server.
• Create test plan with default http testing
• Add HTTP Proxy Server in Workbench node.
– Define port# of proxy server
– Define URL Pattern to include/exclude
• .*.jpg
• .*.js
• .*.png
• .*.gif
• .*.jsp
• .*.css
• .*.txt
• .*.ejs
• .*.eot
• Start Proxy server.
29. Recording Your Test Plan
• Setup Proxy server on your browser.
• Start Recording using the Web Browser.
• All the Request will be captured in the Test plan.
32. Parameterization
• Create CSV file with list of username and password
• Store in same folder where your test stores
• Add CSV Data set into your test tree from config elements
• Add ${USER},${PASS} in request sampler as parameter.
34. Correlation
• Correlation is used to obtain data which is unique for each run of your test script (ex:
session ids). While recording, these dynamic values are hard-coded in your script causing
the script to fail during playback. Correlation is a technique where dynamic values are not
hard-coded in your script but are extracted at run-time to avoid failure
• Correlation will be done using the Regular Expression Extractor in Jmeter.
Sample of Regular Expression and Usage:
• ([^"]+) to correlate whole url/dynamic id
– Ex: Edmiijkn11124mmk
• SessionID=(.+?)& to correlate the url/dynamic id between 2 parameter. Here it’s
between ‘SessionID=‘ and ‘&’ Need to be use if
– EX: SessionID=jkjoujn434897h3jh35y9h&OrderID=ikikikke99874kmnjhh2
• orderID=(.+) to correlate the url;/dynamic id after the defined parameter. Here it’s
after ‘orderID=’
– EX: SessionID=jkjoujn434897h3jh35y9h&OrderID=ikikikke99874kmnjhh2
35. Right click the node/url > Add > Post Processor > Regular Expression Extractor
Defining Regular Expression Extractor:
Reference name: Regex
Regular Expression : ([^"]+)
Template : $1$
Match no : 1
Hint:
1. Need to tag/replace the reference name Regex by ${Regex} in the URL /Dynamic Id.
2. Regular expression can be done before URL where the Dynamic Id/URL you found.
Correlation - Regular Expression Extractor
42. App/DB/Web Server configuration
ADD> Sampler >> HTTP Request
•Name the http request as Server Status, Provide the server IP and port
•Mention “/manager/status” in the path
47. Distributed Test Environment
Target
VM 1
Master
VM 2
Slave
VM 3
Slave
VM 4
Slave
VM 5
Slave
VM n
Slave
Web Server
Master: The system running Jmeter GUI which control the test.
Slave: The System running Jmeter-server which takes commends from
the GUI and send the requests to the target system.
Target: The Web Server planned for the load test.
48. Jmeter Distributed Testing
• JMeter client machine may not able to simulate enough users to stress server.
• Control multiple machine to run JMeter without copying test samples to different
machine.
• Configuration:
– Copy same version of JMeter to different computer.
– Add remote node IP in JMeter.proeprties file.
– Run JMeter on remote machine using /JMETER_HOME/bin/jmeter-server (in
command prompt)
– Start JMeter GUI in host machine.
– Select any test plan.
– Go to Run >> Remote Start >> Remote IP Address.