This research presents an advanced iris recognition technique utilizing convolutional neural networks with sheaf attention networks (CSAN) to enhance segmentation and classification accuracy. The proposed method integrates various preprocessing techniques and classifiers, achieving up to 99.98% accuracy across different datasets, suitable for applications in secure authentication and access control. The findings underscore the method's improved robustness against variations in lighting and occlusions, positioning it as a significant advancement in biometric identification technology.
![Full Length Article
Performance evaluation of efficient segmentation and classification based
iris recognition using sheaf attention network☆
Sushilkumar S. Salve a,*
, Sandipann P Narote b
a
Research Scholar, Department of Electronics and Telecommunication, Shri J.J.T. University, Jhunjhunu, Rajasthan 333001, India
b
Head of Department, Department of Electronics and Telecommunication, Government Polytechnic, Pune, Maharashtra 411016, India
A R T I C L E I N F O
Keywords:
Iris recognition
Sheaf attention network
Grayscale transformation
Wavelet transform
Up sampling network
A B S T R A C T
Iris recognition, a precise biometric identification technique, relies on the distinct epigenetic patterns within the
iris. Existing methods often face challenges related to segmentation accuracy and classification efficiency. To
improve the accuracy and efficiency of iris recognition systems, this research proposes an innovative approach
for iris recognition, focusing on efficient segmentation and classification using Convolutional neural networks
with Sheaf Attention Networks (CSAN). Main objective is to develop an integrated framework that optimizes iris
segmentation and classification. Subsequently, dense extreme inception multipath guided up sampling network is
employed for accurate segmentation. Finally, classifiers including convolutional neural network with sheaf
attention networks are evaluated. The findings indicate that the proposed method achieves superior iris recog
nition accuracy and robustness, making it suitable for applications such as secure authentication and access
control. By comparing with existing approaches CSAN obtains 99.98%, 99.35%, 99.45% and 99.65% accuracy
for the four different proposed datasets respectively.
1. Introduction
Iris recognition stands out as a cutting-edge biometric technology
due to its unparalleled accuracy and reliability in identifying individuals
based on the unique patterns within the iris [1,2]. The iris is an ideal
biometric trait because its patterns are established early in life and
remain stable over time, ensuring consistency and permanence for
identity verification purposes [3]. One of the key advantages of iris
recognition is its resistance to fraud and spoofing attempts. Unlike some
biometric modalities such as fingerprints, which can be replicated or
altered, the intricate and complex patterns of the iris are extremely
difficult to duplicate [4,5]. This makes iris recognition a highly secure
method for authentication, particularly in applications where robust
security measures are essential, such as border control, secure access
management, and national identification systems [6,7]. In practice, iris
recognition systems capture high-resolution images of the iris, extract
ing unique features such as crypts, furrows, and freckles [8,9]. These
features are then converted into mathematical templates that can be
compared with stored templates in a database. The matching process is
typically fast and accurate, providing reliable identification of
individuals even in challenging conditions such as varying lighting or
occlusions [10].
As technology continues to evolve, iris recognition is expected to
play an increasingly important role in enhancing security and identity
verification across various domains, including law enforcement,
healthcare, finance, and public services [26]. Its exceptional accuracy
and resistance to fraud make it a trusted biometric modality for ensuring
secure and reliable identification. The success and reliability of iris
recognition systems hinge on several critical components, each serving a
specific role in the authentication process. Beginning with preprocess
ing, iris images undergo enhancement techniques to optimize their
quality and improve the visibility of intricate details [27]. This step
often includes contrast adjustments, normalization, and noise reduction,
crucial for preparing iris images for subsequent stages. Iris segmentation
is a pivotal phase aimed at isolating the iris region from the overall eye
image. Accurate segmentation requires precise detection of iris bound
aries and proper exclusion of irrelevant areas [28]. Central to this pro
cess is the accurate localization of the pupil, which establishes the center
of the iris and aids in its delineation.
Feature extraction follows segmentation and involves transforming
☆
This paper has been recommended for acceptance by Kuo-Liang Chung.
* Corresponding author.
E-mail addresses: sushil.472@gmail.com (S.S. Salve), snarote@gmail.com (S.P. Narote).
Contents lists available at ScienceDirect
Journal of Visual Communication and Image Representation
journal homepage: www.elsevier.com/locate/jvci
https://doi.org/10.1016/j.jvcir.2024.104262
Received 18 October 2023; Received in revised form 29 April 2024; Accepted 16 August 2024
J. Vis. Commun. Image R. 103 (2024) 104262
Available online 17 August 2024
1047-3203/© 2024 Elsevier Inc. All rights are reserved, including those for text and data mining, AI training, and similar technologies.](https://image.slidesharecdn.com/performanceevaluationofefficientsegmentationandclassificationbased-241012181457-526854a4/75/Performance-evaluation-of-efficient-segmentation-and-classification-based-iris-recognition-using-sheaf-attention-network-1-2048.jpg)
![the complex patterns of the iris into a compact and unique representa
tion. This process distills the iris features into an iris template or code,
which serves as a mathematical representation of the iris’s distinguish
ing characteristics [29]. The iris template is securely stored for subse
quent comparison and verification tasks. In the classification stage, an
individual’s iris template is compared against previously stored tem
plates in a database [30,31]. Matching algorithms are employed to
assess the similarity between templates and determine potential
matches. This final stage of the process enables secure and reliable
identification based on the unique iris patterns. These sequential stages
collectively contribute to the accuracy, reliability, and robustness of iris
recognition technology, making it a valuable tool in various applications
requiring precise and secure biometric authentication.The major
contribution of the work are,
• The hybrid preprocessing method combines the strengths of both
Hybrid multi-scale Retinex Adaptive grayscale Transformation
(HRAT) and Quantized Haar Wavelet Transform (QHWT). This en
hances image quality by improving contrast, reducing noise, and
preserving texture and fine details.
• Dense extreme Inception Multipath guided up sampling Network
(DIMNet) is capable of accurately delineate the iris boundaries from
the surrounding ocular structures, thereby improving the precision
of the segmentation process.
• Double layer angle Multi kernel Extreme Learning Analysis (DMELA)
is designed to efficiently extract features from segmented images. It
reduces feature space dimensions while preserving relevant infor
mation. This leads to faster and more efficient processing during
classification.
• The use of Convolutional Neural Networks (CNN) in conjunction
with sheaf attention networks for classification is a powerful com
bination. It allows for high accuracy in recognizing and classifying
iris patterns, which are critical in biometric authentication.
• This classification approach is adaptable across diverse image clas
sification tasks, making it versatile and suitable for various appli
cations beyond iris recognition.
The remaining part of this work is organized as: Section 2 summaries
various existing methods related to biometric iris recognition, Section 3
describes various proposed methods, Section 4 includes results and
performance evaluation and Section 5 involves conclusion and future
work.
2. Literature survey
Iris Recognition (IR) technology has made significant advancements
in recent years, with researchers continuously exploring innovative
techniques to enhance its accuracy and applicability. The selected arti
cles encompass various aspects of iris recognition, including biometric
techniques, edge detection methods, deep learning neural networks,
feature extraction, and instant learning.
In 2022, Farouk RH et al. [11] proposed a Hamming Distance (HD)
like biometric technique to enhance iris recognition, reflecting the
ongoing efforts to expand the reliability and accuracy of IR systems. It
underscores the significance of robust biometric methods for secure
authentication in various applications. In 2023, Khan SN et al. [12]
focused on iris recognition using edge detection methods, particularly
for user identification in flight simulators. This highlights the practical
applications of iris recognition beyond traditional security measures. In
2023, Ali EH et al. [13] presented a method for IR using deep learning
neural networks, such as CNN, with Semi-Discrete Matrix Decomposi
tion (SDD) as the feature extraction method. Deep learning has emerged
as a game-changer in biometrics, offering increased accuracy and
robustness. In 2022, Babu G and Khayum PA [14] explored a hybrid
approach that combines Elephant Herding with Whale Optimization
Algorithm (EH-WOA) and CNN for IR. This fusion approach signifies the
integration of traditional computer vision techniques with cutting-edge
deep learning models to enhance recognition accuracy. In 2023,
Abdulhasan et al. [15] focused on achieving instant learning in iris
recognition by combining Deep Neural Networks (DNN) with Linear
Discriminant Analysis (LDA) to enhance accuracy. Instant learning aims
to make iris recognition systems more user-friendly and adaptable.
Abdellatef et al. [16], in 2022, introduced an iris recognition system
that employs deep learning techniques and allows users to cancel and re-
enroll their biometric data, addressing security concerns and improving
system robustness.
The classification methods used here are CNN and Support Vector
Machine (SVM) In 2022, Kagawade and Angadi [17] proposed a novel
scheme for iris recognition using the Polar Fast Fourier Transform
(PFFT) code, leveraging symbolic modeling to enhance accuracy and
efficiency. Sun et al. [18] in 2022, presented an IR system based on Local
Circular Gabor Filters (LCGF) and a Multi-scale Convolution Feature
Fusion Network (MCFFN), demonstrating the use of advanced image
processing techniques to extract relevant features from iris images. In
2022, Sun et al. [19] explored open-set IR using deep learning and the
Open-Class Features Outlier Network (OCFON), offering a solution for
classifying iris images, even when encountering unknown or unautho
rized users. In 2022, Lei et al. [20] introduced an attention Meta-
Transfer Learning (MTL) approach for few-shot IR adapting the recog
nition system to new, unseen iris samples. Table 1represents the sum
mary of reviewed works.
Table 1 provides a concised summary of various methods employed
in iris recognition, along with their specific objectives and associated
limitations. Each method offers unique advantages and faces specific
limitations, highlighting the diverse challenges and opportunities within
the field of iris recognition.
• Problem Statement
Iris recognition using deep learning is to develop an accurate and
reliable biometric authentication system that automatically identify and
verify individuals based on the unique patterns present in the iris of the
eye. This system aims to address challenges related to identity verifi
cation and access control by leveraging deep neural networks to extract
and learn intricate iris features from high-resolution images. In this
research work, an efficient segmentation and classification-based iris
recognition using CSAN is proposed. The primary objectives include
achieving high recognition accuracy, robustness to variations in lighting
and occlusions. The ability to distinguish genuine iris samples from
impostors while ensuring data privacy and security in deployment sce
narios such as border control, secure authentication, and access
management.
3. Proposed method
The proposed methodology for iris recognition represents a
comprehensive and sophisticated approach that combines advance
techniques to improve the efficiency and accuracy of the recognition
process. This method revolves around four key components: pre
processing, segmentation, feature extraction, and classification.
From Fig. 1, the preprocessing stage, powered by HRAT and QHWT,
optimizes image quality, setting the foundation for precise segmenta
tion. DIMNet, employed for segmentation, efficiently detects iris
boundaries and edges, crucial for accurate isolation. DMELA serves as a
powerful feature extraction tool, reducing classifier runtime while
capturing essential iris features., K-Nearest Neighbors (KNN), SVM,
CSAN and Random Forest (RF) are the classification method used to
classify the extracted features for iris recognition.
3.1. Preprocessing to enhance image quality
Initially, iris images undergo a critical preprocessing stage, which
S.S. Salve and S.P. Narote Journal of Visual Communication and Image Representation 103 (2024) 104262
2](https://image.slidesharecdn.com/performanceevaluationofefficientsegmentationandclassificationbased-241012181457-526854a4/75/Performance-evaluation-of-efficient-segmentation-and-classification-based-iris-recognition-using-sheaf-attention-network-2-2048.jpg)
![plays a pivotal role in optimizing image quality [21,22]. This phase
employs a HRAT and QHWT. HRAT enhances image quality by adjusting
contrast, reducing noise, and ensuring uniform lighting conditions.
QHWT, on the other hand, allows for the transformation of image data
into a more analyzable frequency domain, preserving intricate iris
details.
• Multi-Scale Retinex Adaptive Grayscale Transformation
The HRAT model plays a pivotal role in enhancing eye images as part
of the preprocessing stage. It essentially converts the gray values
attained from real sampling into corresponding gray values using a
linear function. It achieves several important objectives including the
extraction of edge and texture information from the image and the
enhancement of image contrast. Eqn. (1) shows the mathematical rep
resentation of grayscale function.
Xʹ(u, v) = [X(u, v) + B − L]⋅tan(T⋅π) + B + L (1)
where X(u, v) represents the grayscale value of the input image, Xʹ(u, v)
signifies the grayscale value of the resulting output image, u, v represents
pixel coordinates of image, T stands for parameters related to contrast
correction, L denotes the offset for the overall transformation, typically
set to a value of 127. The parameter B is equally important, as it is
associated with brightness correction parameters. Its value is propor
tional to the average brightness of the image, as expressed in Eqn. (2).
B ∝
1
mean
(2)
The adaptive nature of the parameters ensures that the preprocessing
method effectively addresses the specific challenges posed by different
conditions within the datasets, ultimately leading to improved image
quality and readiness for subsequent analysis and recognition tasks.
HRAT enhances iris image clarity by optimizing contrast and
brightness, revealing fine details crucial for feature extraction. It reduces
noise without compromising textural integrity, crucial for precise bio
metric recognition. Additionally, HRAT adjusts to different lighting
conditions, ensuring consistent image quality essential for accurate iris
recognition.
• Quantized Haar Wavelet Transform
QHWT is a powerful mathematical technique used for data analysis,
particularly in the context of eye image preprocessing for the collected
image. QHWT is designed to efficiently organize data by their fre
quencies. This transformation shifts data from the spatial domain into
the frequency domain, preserving each component at its respective
resolution scale. Consider a wavelet as a foundational set for a vector
space. The forward Haar transform explained as a combination of
averaging and differencing operations. Eqn. (3) represents the scaling
function ϕ(s) for low pass and the partial Haar function ψ(s) for high
pass.
ψ(s) =
⎧
⎪
⎨
⎪
⎩
1 s ∈ [0, 1/2)
− 1 s ∈ [1/2, 1)
0 s ∈ [0, 1)
ψi
j(s) =
̅̅̅̅
2i
√
× ψ
(
2i
s − j
)
,
i = 0, 1, .... and j = 0, 1, ....,
(
2i
− 1
)
,
ϕ(s) =
{
1 0 ≤ s < 1
0 otherwise
(3)
where i , s and j represents the variables of Haar function. When dealing
with an input signified a list of 2n
numbers, QHWT is a straightforward
process of pairing up input values, storing the differences, and then
adding up the sums. This recursive process continues by pairing up the
sums, ultimately yielding 2n− 1
transformations and a concluding sum.
Consider a vector y with N values, represented as Y = [y1, y2, ..., yN]
where N must be a power of 2. The total number of recursive steps Ω in a
wavelet transform is determined by a certain parameter like log2N.
Then, calculate the directional distances between pairs of numbers pa for
the high pass and the average of pairs of numbers in the vector ha for the
low pass, as described in Eqn. (4).
ha =
(y2a + ysa+1)
2
pa =
(y2a − y2a+1)
2
for a = 0, ...,
(
N
2
− 1
) (4)
where a represents the variable QHWT functions; N represents the
number of values. The next data list p is obtained, in a way that allows to
reconstruct the original vector Y from h and p as Y→[h|p]. Eqn. (5)
represents the inverse operation function.
[y1, y2, ...yN]→[h|p] = [h1, ....hN/2|p1, ..., pN/2] (5)
Table 1
Summary of existing methods.
References Methods Objectives Limitations
[11] CNN and HD Improve Iris
Recognition. Potential
for increased security
Specific details of the
technique are not
verified.
[12] Edge detection
methods
Use Edge Detection for
User Identification.
Improve recognition
speed
Lack of information on
scalability
[13] SDD and CNN Utilizes deep learning
for iris localization
Potential
computational
complexity
[14] EH-WOA Fusion of traditional
CV and deep learning
techniques. Improved
feature extraction for
iris recognition
Required more
computational
resources
[15] LDA Iris recognition
employs a hybrid
LDADNN model, which
combines 1D deep
learning for the
classification process
and delivers precise
outcomes.
This model doesn’t
necessitate an
extensive training
dataset or specialized
hardware for
deployment.
[16] CNN and SVM To enhance security by
allowing users to
cancel and re-enroll
biometric data
The demands for
computational
resources could be
substantial.
[17] PFFT Symbolic modeling
approach improves
accuracy and
efficiency. Potential for
enhanced recognition
in non-standard
conditions
Lack of information
regarding scalability.
[18] LCGF+MCFFN The image processing
techniques improve
feature extraction.
Enhanced recognition
accuracy and
reliability
No attention is given to
distinguishing
unknown classes.
[19] OCFON To address the
scenarios where the
system encounters
unknown irises
Potential for overfitting
[20] MTL To address the few-
shot recognition
scenarios with limited
training samples.
Utilizes meta-transfer
learning and attention
mechanisms
Need a more in-depth
examination of the
integration of attention
mechanisms and few-
shot learning.
S.S. Salve and S.P. Narote Journal of Visual Communication and Image Representation 103 (2024) 104262
3](https://image.slidesharecdn.com/performanceevaluationofefficientsegmentationandclassificationbased-241012181457-526854a4/75/Performance-evaluation-of-efficient-segmentation-and-classification-based-iris-recognition-using-sheaf-attention-network-3-2048.jpg)
![Finally, in the reverse operation, the vector is decomposed and
mapped as part of the eye image preprocessing procedure for datasets.
QHWT shifts iris image data to the frequency domain, capturing
detailed features at multiple resolutions to enhance pattern differenti
ation. It segments data into frequency components, boosting processing
efficiency, crucial for managing large datasets and ensuring rapid real-
time analysis.
• Hybrid Multi-Scale Retinex Adaptive Grayscale Transformation
with Quantized Haar Wavelet Transform
Apply the grayscale transformation approach to the initial eye
image. This initial step serves to enhance image contrast, refine edge and
texture details, and adjust brightness and contrast settings. Following
this initial enhancement, proceed to apply the QHWT to the output
obtained in the previous step. The QHWT analysis operates in the fre
quency domain, offering further insights into the transformed image.
Given that the multi-scale retinex transformation has already improved
image contrast and texture, the QHWT is employed to extract frequency-
based features from these enhanced images. Apply the QHWT at various
scales to capture both fine and coarse image details. Now, combine the
outcomes of both methods. Consider either a weighted or linear com
bination of the enhanced image generated by the multi-scale retinex
transformation and the wavelet coefficients obtained through the
QHWT. Eqn. (6) provides the formula for the integrated and recon
structed image, expressing this combination process.
PI = α ∗ X[u, v] + β ∗ [h|p] (6)
where α and β are weighting coefficients that determine the influence of
each method on the result. Adjust these coefficients according to the
unique characteristics of the dataset and the desired outcome. This
adjustment (P1) represents the combined image that incorporates both
the contrast-enhanced features from HRAT and the frequency-based
information from QHWT. The collected data undergoes preprocessing
using the hybrid method and is subsequently segmented using the
DIMNet approach. The functions of the segmentation process are
described as follows.
3.2. Segmenting to separate the iris region
Accurate segmentation is vital for isolating the iris region from the
rest of the eye. DIMNet is tailored to excel in this specific task, effectively
detecting and delineating the boundaries of the iris.
• Dense Extreme Inception Multipath guided up sampling
Network for Edge Detection (DIMNet)
DIMNet inspired from the architecture of xception but introduces a
unique enhancement: two parallel skip-connections. These skip-
connections play a pivotal role in preserving vital edge information
across various network layers [23]. Fig. 2 represents the architecture of
DIMNet.
The architecture is structured around six blocks, each serving as an
encoder. Each block encompasses sub-blocks that consist of convolu
tional layers. Skip-connections establish connections not only between
blocks but also among sub-blocks. Feature-maps generated at each block
are then dispatched to an independent upsampling network, where they
undergo processing to yield intermediate edge-maps. These intermedi
ate edge-maps are then combined by stacking them, creating a collection
of learned filters, which are ultimately merged to generate a unified
edge-map.
Each sub-block comprises two convolutional layers, both featuring
3×3 kernels. Following each convolution operation, a batch normali
zation and rectified linear unit activation function are applied. Notably,
starting from block 3 onward, the last convolutional layer within the
final sub-block ignores the rectifier linear unit function. Red rectangles
denote the presence of max-pooling operators characterized by 3×3
kernels and a stride of 2.
To combat the issue of significant edge features vanishing during the
processing pipeline, the architecture introduces parallel skip-
connections. Starting from block-3 and onwards, the output of each
sub-block undergoes averaging with an additional skip-connection
referred to as “second skip-connections” (SSC). This averaged output
is then merged with the output of the first skip-connection (FSC).
Concurrently, the output from max-pooling layers is directly passed on
to the following sub-blocks.
• Upsampling Network (USNet)
USNet is composed of two conditional blocks, each featuring a
sequence comprising a convolutional layer and a deconvolutional layer
designed for up-sampling features. Block-2 exclusively activates to scale
Fig. 1. Proposed architecture.
S.S. Salve and S.P. Narote Journal of Visual Communication and Image Representation 103 (2024) 104262
4](https://image.slidesharecdn.com/performanceevaluationofefficientsegmentationandclassificationbased-241012181457-526854a4/75/Performance-evaluation-of-efficient-segmentation-and-classification-based-iris-recognition-using-sheaf-attention-network-4-2048.jpg)
![input feature-maps derived from the Dense inception network, and this
process continues iteratively until the feature-map size ranges twice that
of the ground truth. Upon reaching this condition, the feature-map is
directed to block-1. Block-1 commences processing with a 1x1 kernel,
followed by a rectified linear unit activation and subsequently un
dertakes a transpose convolution operation with a kernel size of s × s. s
corresponds to the scale level of the input feature-map. It is significant to
note that the last convolutional layer within block-1 does not employ an
activation function.
DIMNet able to detect edges and highlight boundaries ensures that
the iris region is precisely isolated from the rest of the eye. Iris images
vary significantly in terms of lighting conditions, occlusions and image
quality. DIMNets multi-scale processing and edge detection capabilities
make it robust to these variations, ensuring reliable segmentation results
across diverse image conditions. The segmented iris regions are sub
jected to the feature extraction process.
3.3. Feature extraction to optimize classifier runtime
Feature extraction is to reduce computational complexity and
enhance classifier runtime. DMELA specializes in extracting essential iris
features, capture unique characteristics while optimizing runtime
efficiency.
DMELA operates as a feature extraction method specifically tailored
to expand the efficiency of the IR system [24]. The main objective is to
reduce the dimensionality of the iris data while capturing meaningful
and distinctive features. The feature extraction transforms the complex
iris patterns into a more compact and informative representation that
efficiently utilized by subsequent stages, such as classification. Fig. 3
represents the process of DMELA approach.
This method leverages a double-layer architecture, which enables it
to extract features comprehensively from the segmented iris image. The
input layer takes the raw pixel values of an image. The first hidden layer
of DMELA is responsible for processing the input data and extracting
low-level features. It employs a set of kernels or filters that convolve
with the input to capture various patterns and edges. The second hidden
layer builds upon the features extracted in the first hidden layer. It
combines the low-level features to form higher-level representations.
The output layer synthesizes the features obtained from the second
kernal layer into a final feature representation.
DMELA excels at reducing data dimensionality while capturing
distinctive iris features, streamlining the computational process and
enhancing system runtime efficiency. In essence, after segmentation,
DMELA contributes to the iris recognition process by extracting essential
iris features. These features serve as the basis for subsequent classifi
cation, allowing the system to accurately identify and verify individuals
based on the unique patterns present in the iris of the eye.
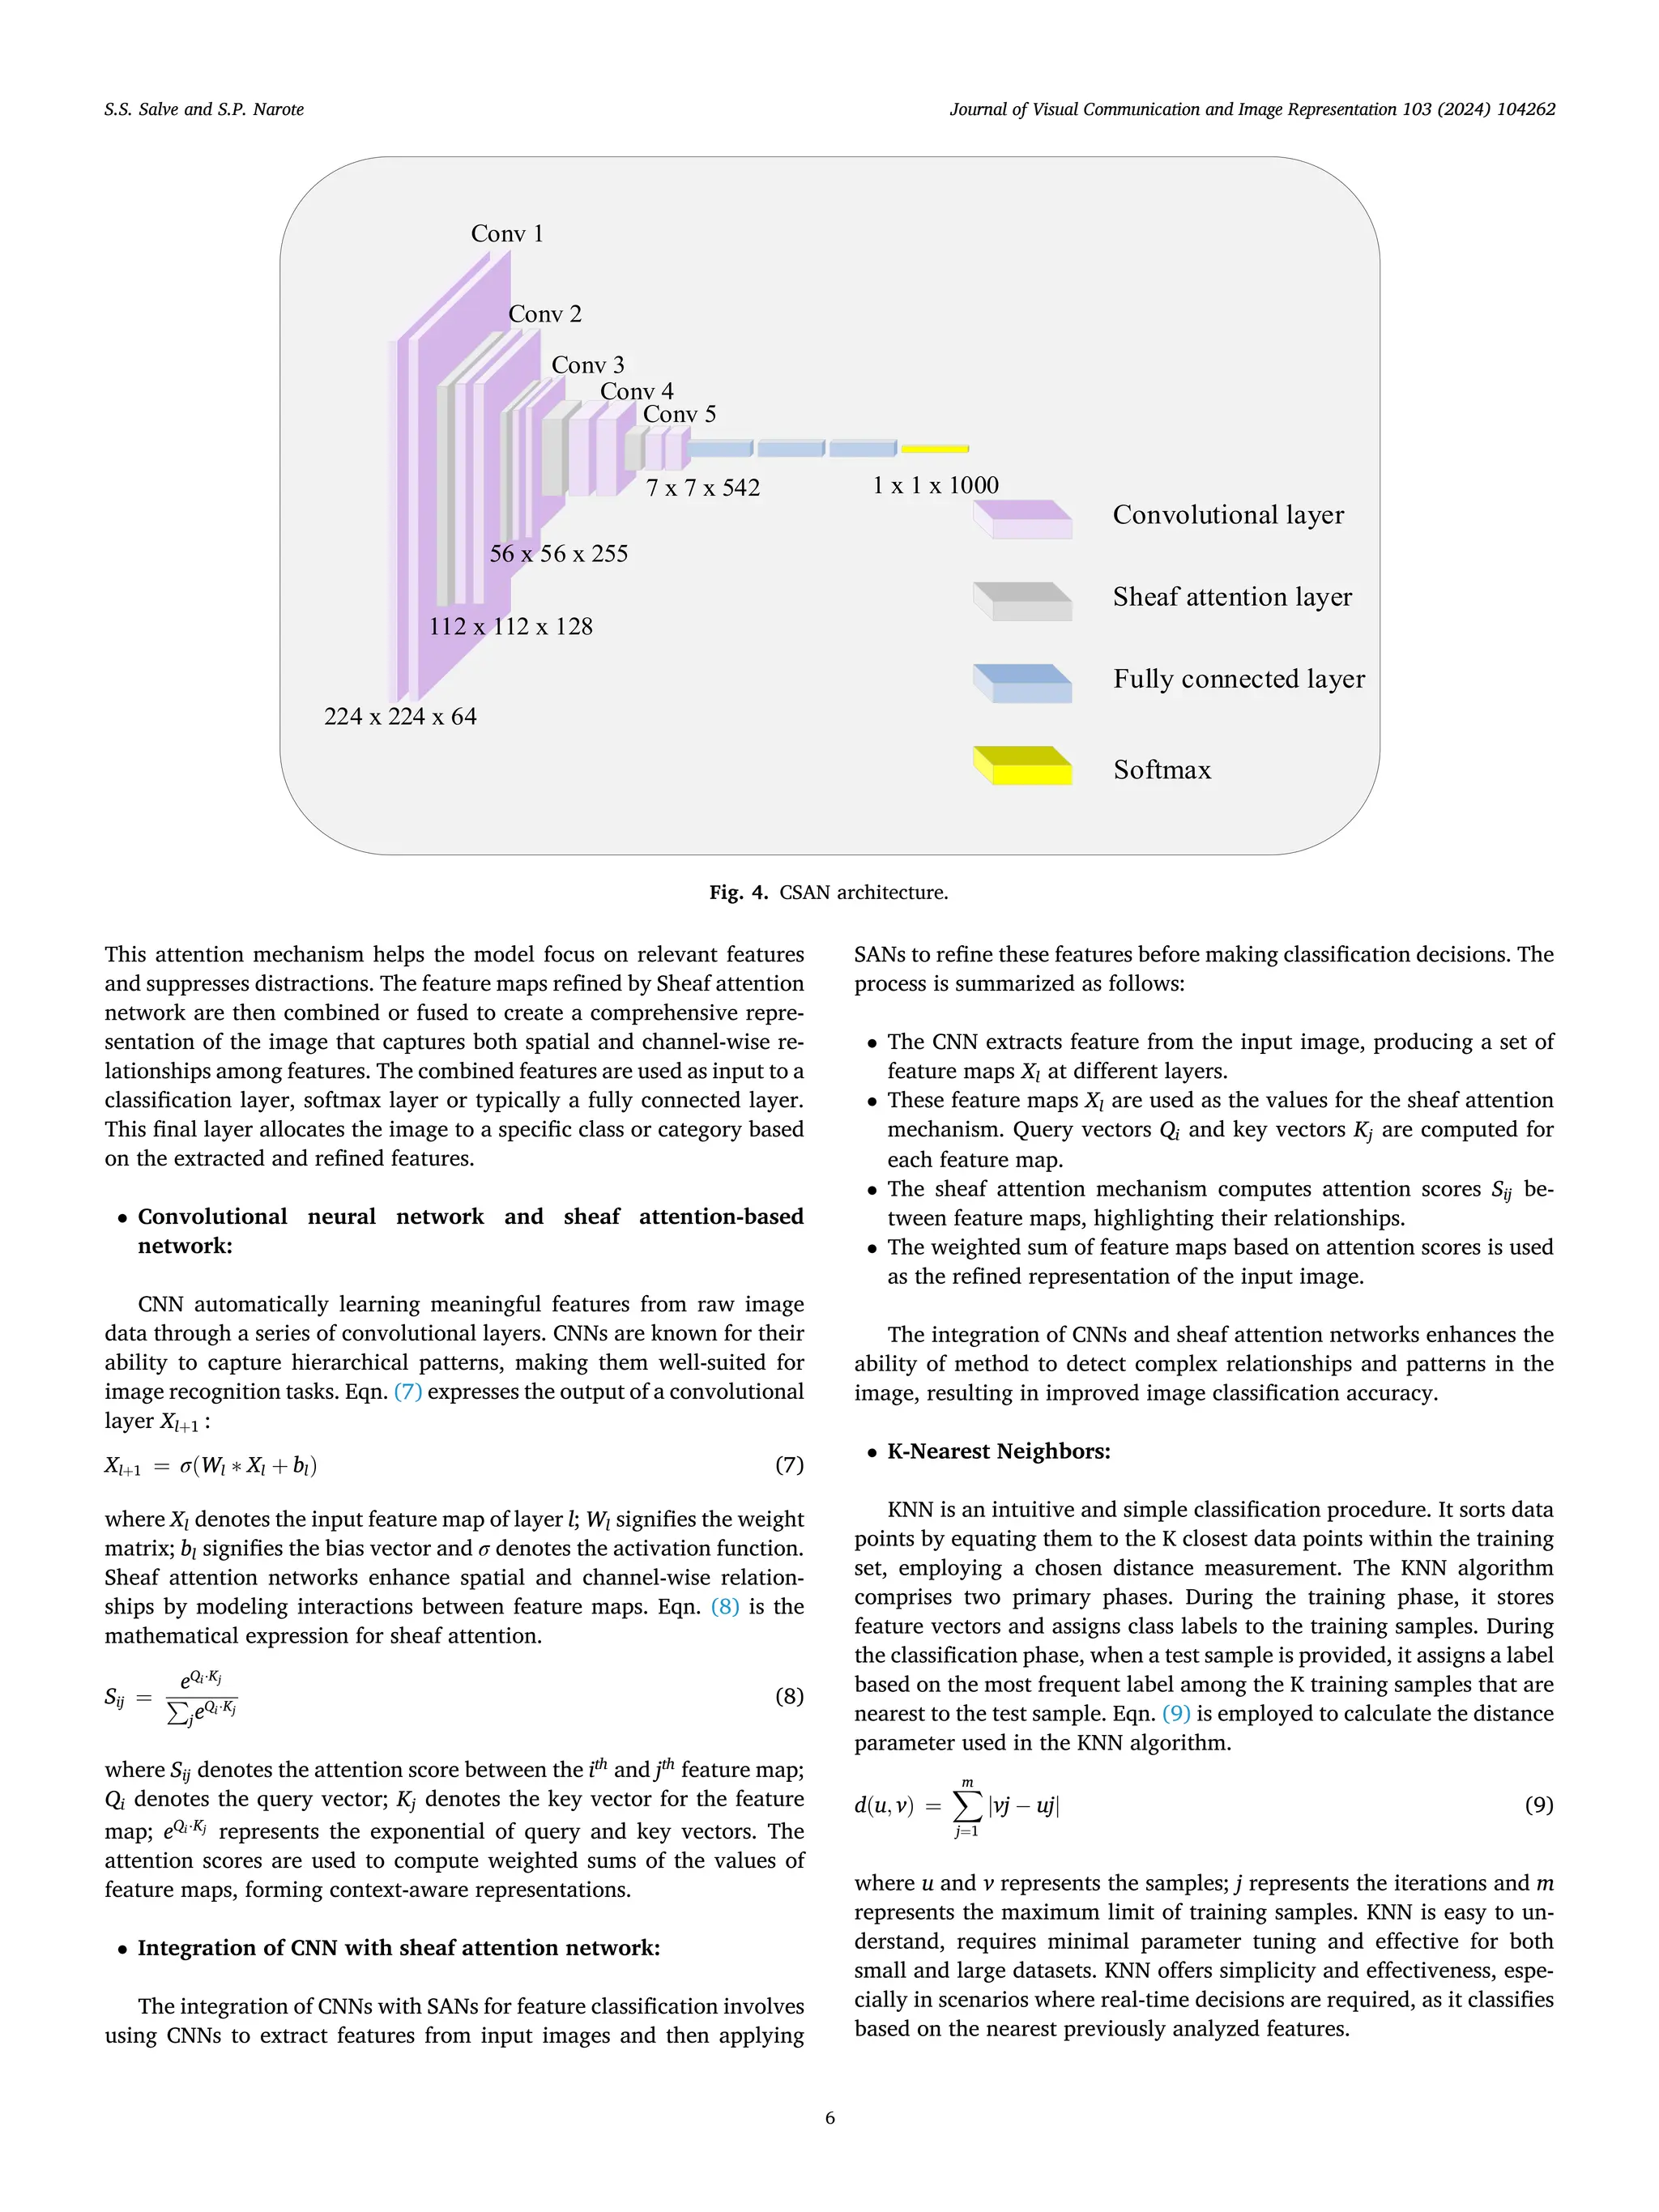
3.4. Image interpretability classification
Finally, the features that have been extracted are employed for the
purpose of classification.. The methodology evaluates classifiers,
including CSAN, KNN, RF and SVM [25]. This combination of neural
network architectures is renowned for its accuracy and interpretability
in image classification tasks. Fig. 4 represents the architecture of CSAN
classification method.
The CNN component of the model processes input images through
multiple convolutional layers. These layers automatically extract hier
archical features from the images, creating a feature map hierarchy.
Sheaf attention network operate on the feature maps produced by the
CNN. For each feature map, Sheaf attention network compute attention
scores that highlight the importance of different regions and channels.
Fig. 2. DIMNet architecture.
Fig. 3. Process of DMELA.
S.S. Salve and S.P. Narote Journal of Visual Communication and Image Representation 103 (2024) 104262
5](https://image.slidesharecdn.com/performanceevaluationofefficientsegmentationandclassificationbased-241012181457-526854a4/75/Performance-evaluation-of-efficient-segmentation-and-classification-based-iris-recognition-using-sheaf-attention-network-5-2048.jpg)
![method in accurately identifying and classifying iris patterns. This su
perior performance is largely attributed to the unique skip connection
strategy employed within DIMNet, which effectively compensates for
both semantic and spatial information deficits associated with low-level
and high-level features. This compensation enhances feature fusion
within the network, thereby enabling more accurate differentiation
between iris and non-iris regions. The skip connection mechanism in
DIMNet plays a crucial role in information propagation across different
network layers, facilitating improved feature learning and representa
tion. By addressing missing semantic and spatial cues inherent in
traditional skip connections, DIMNet achieves enhanced performance in
iris segmentation tasks, underscoring its effectiveness within the pro
posed framework.
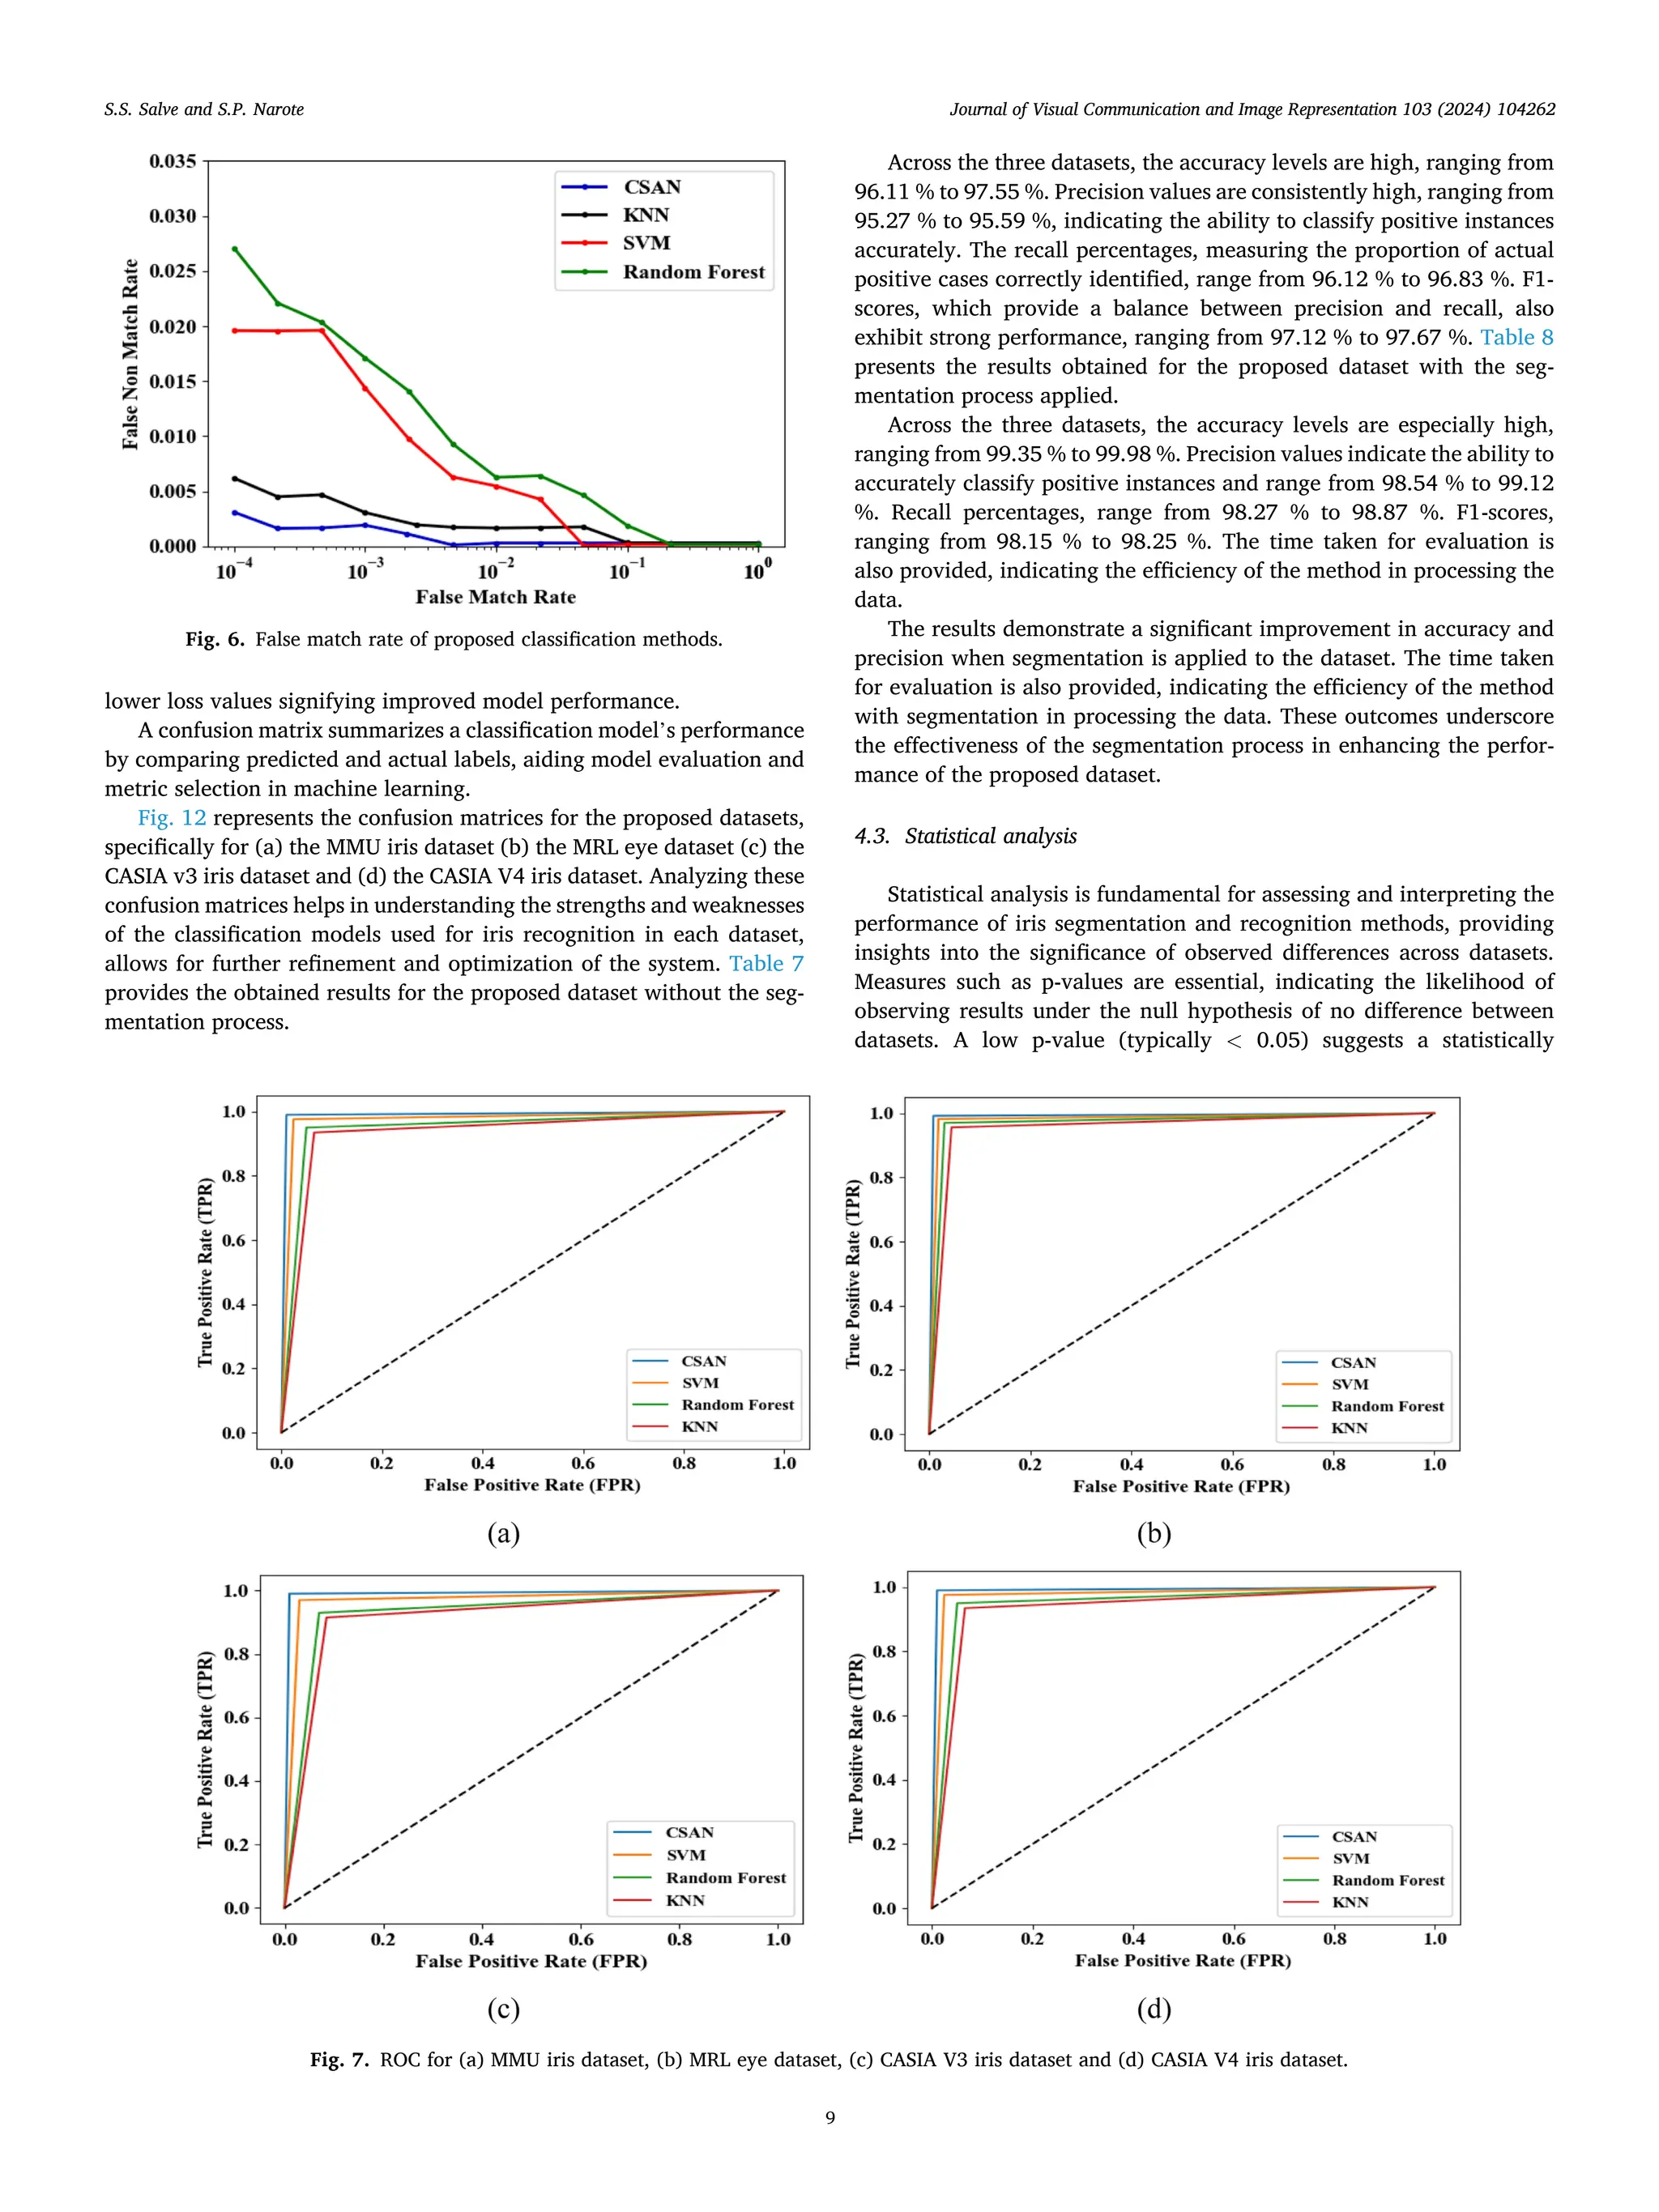
4.6. Discussion
The comprehensive evaluation of iris recognition methods presented
in this study underscores the effectiveness of various classification ap
proaches across multiple datasets. High accuracy percentages achieved
by RF, KNN, SVM, and CSAN demonstrate their robustness in classifying
iris patterns accurately. Segmentation significantly enhances recogni
tion methods by isolating the iris, improving feature extraction, and
classification accuracy. CSAN emerges as the top performer with 99.89
% accuracy, demonstrating superior precision and recall. ROC values
indicate strong discrimination ability, although efforts are needed to
minimize FAR and FRR for optimal authentication performance. Sta
tistical analyses, including ANOVA, provide insights into segmentation
performance variations across datasets, guiding methodological
improvements.
5. Conclusion
This research presents a comprehensive framework for improving
iris recognition accuracy and efficiency, addressing challenges in seg
mentation and classification. Proposed CSAN classification method has
demonstrated better accuracy, precision and recall, making it a prom
ising choice for real-world applications that demand robust security and
reliable user identification. The experimental study was conducted for
both segmented and non-segmented classification processes, and it was
observed that segmentation significantly outperforms the non-
segmented approach in terms of recognition accuracy. Limitations of
the current work include the reliance on traditional segmentation
techniques, which may be less robust for complex iris patterns. Inves
tigating more advanced and robust segmentation techniques could
further improve the accuracy and speed of iris recognition. Exploring
deep learning-based segmentation methods may yield even better
results.
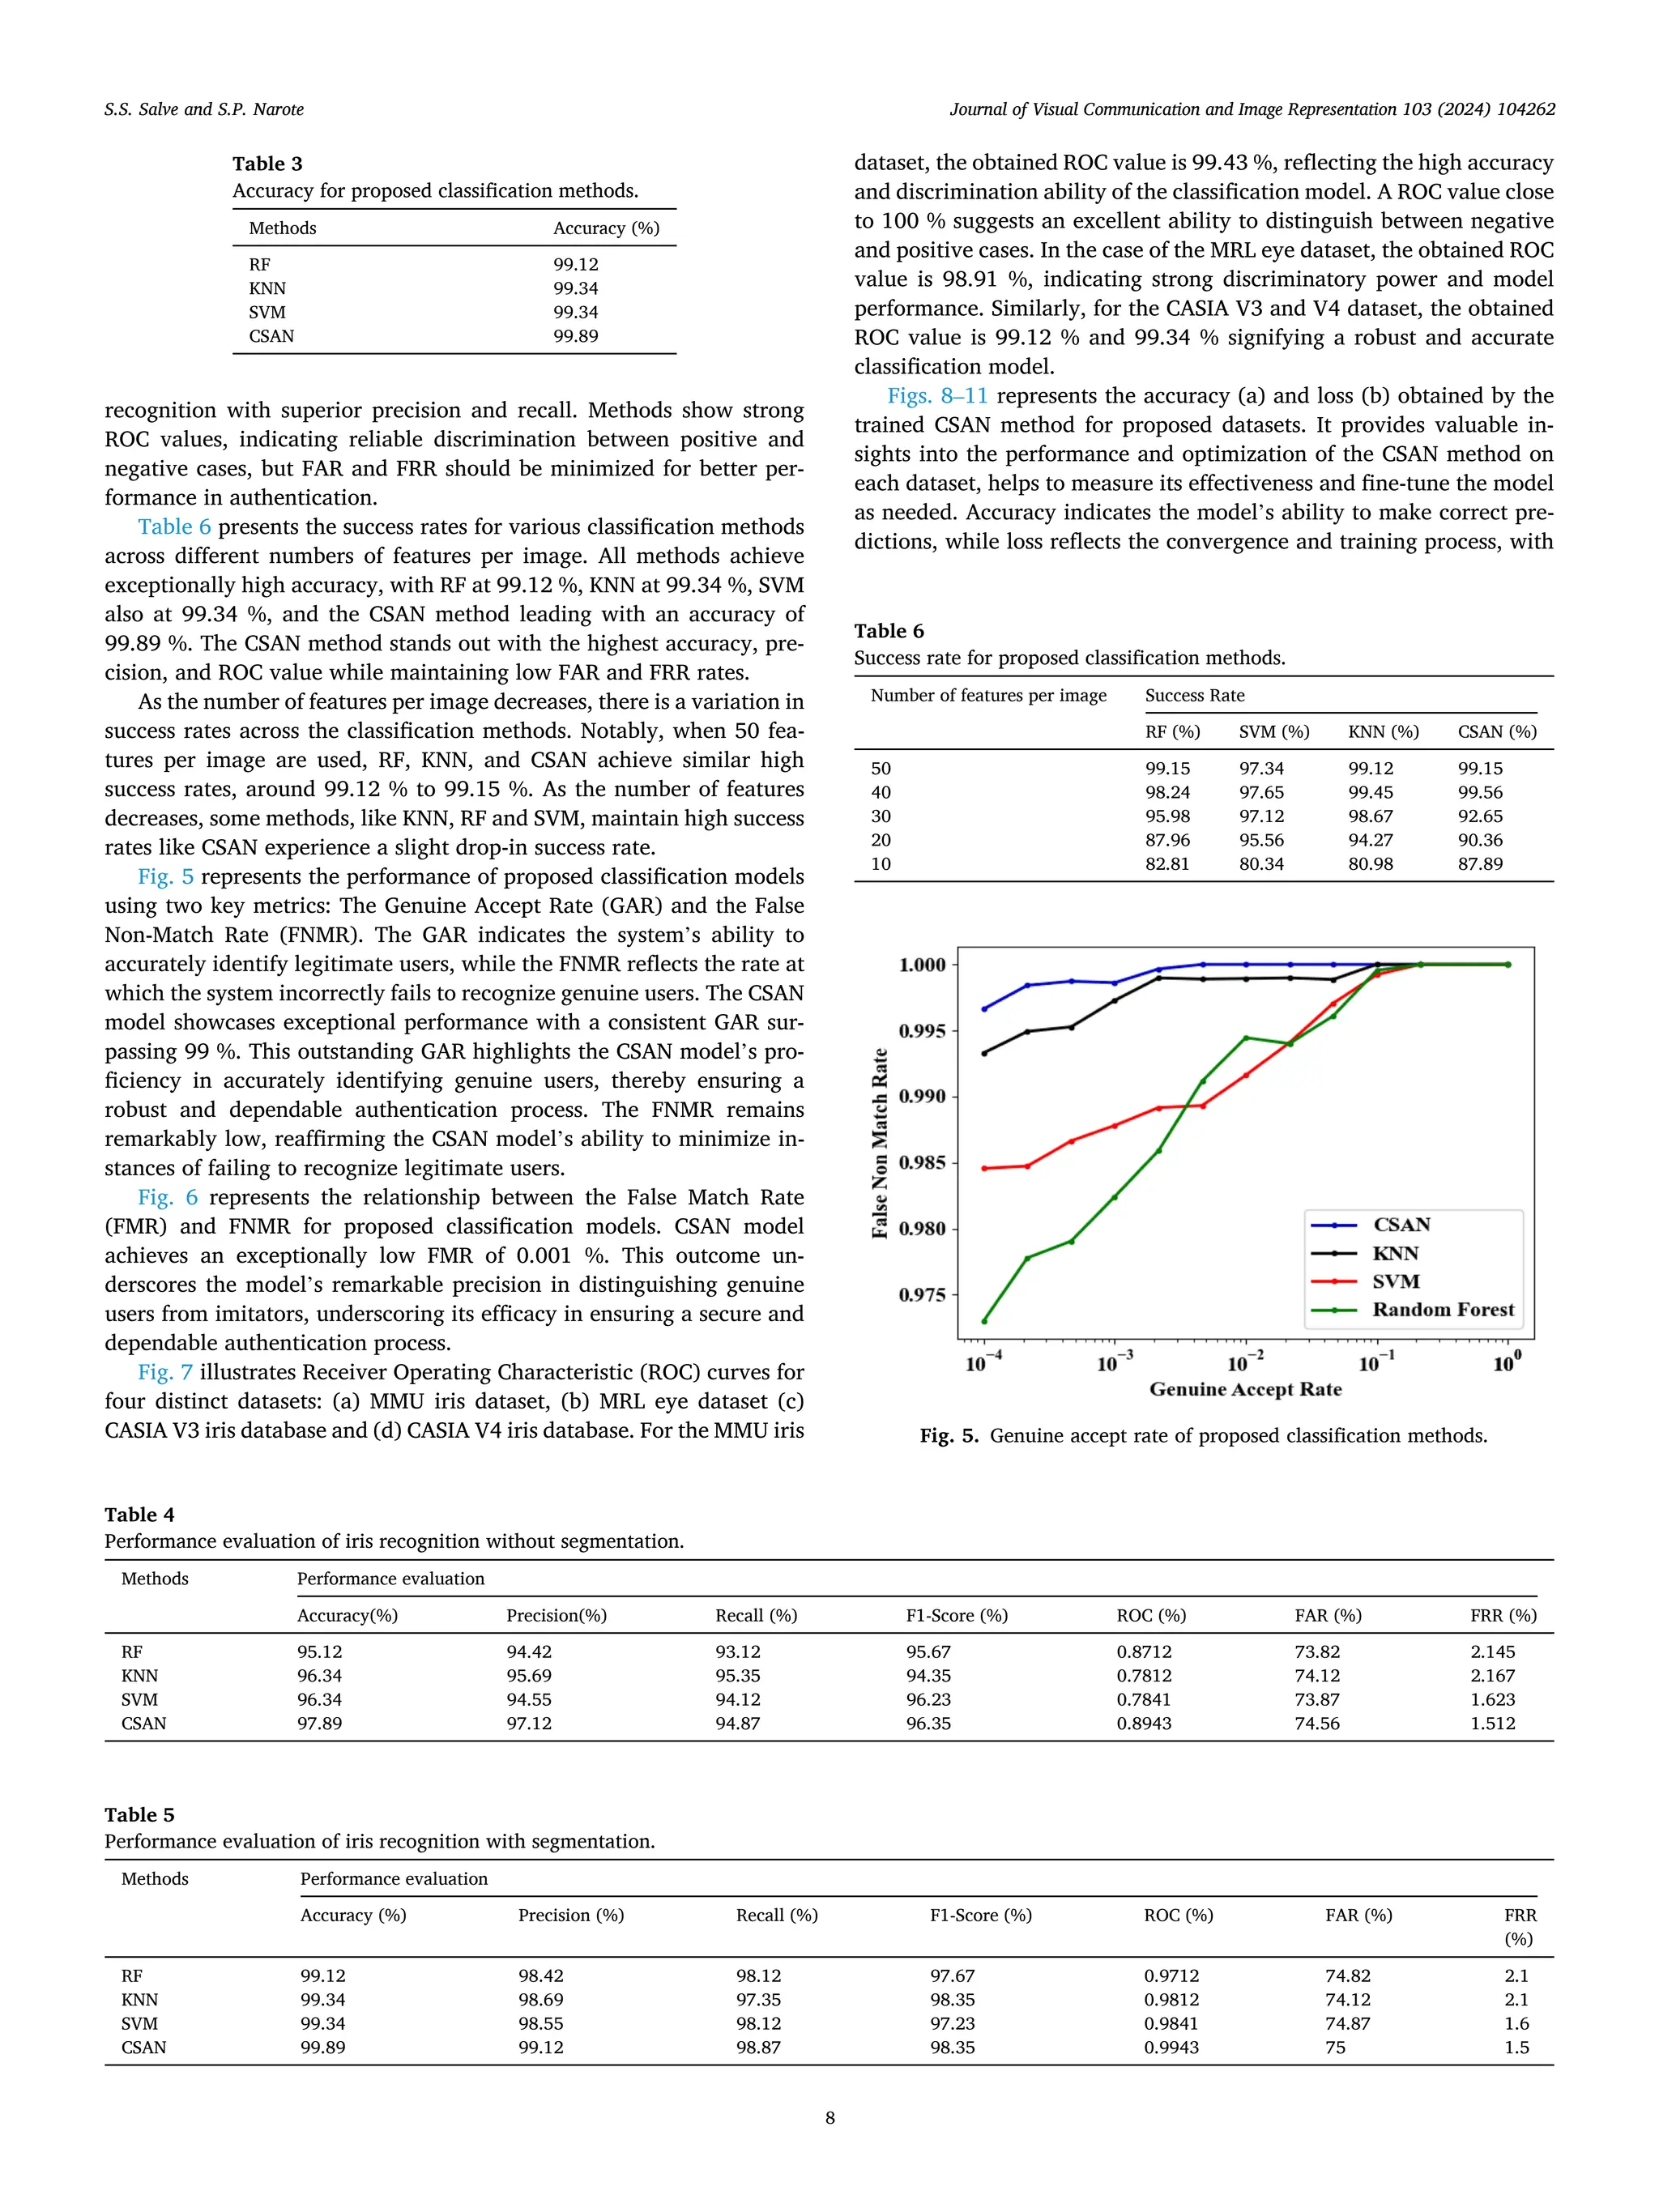
Table 7
Obtained results for proposed dataset without segmentation.
Datasets Performance Evaluation Time
(sec)
Accuracy
(%)
Precision
(%)
Recall
(%)
F1-score
(%)
MMU [11] 97.34 95.27 96.12 97.35 1.871
MRL [11] 97.55 95.44 96.65 97.67 2.345
CASIA V3
[16]
96.11 95.59 96.83 97.12 1.976
CASIA V4
[11]
97.06 96.57 96.72 97.07 1.876
Table 8
Obtained results for proposed dataset with segmentation.
Datasets Performance Evaluation Time
(sec)
Accuracy
(%)
Precision
(%)
Recall
(%)
F1-score
(%)
MMU [11] 99.98 99.12 98.35 97.56 0.875
MRL [11] 99.35 98.78 98.87 98.25 1.890
CASIA V3
[16]
99.45 98.54 98.27 98.15 1.654
CASIA V4
[11]
99.65 98.25 98.27 98.15 1.625
Table 9
Segmentation method using statistical methods.
Method Datasets Performance metrices
F1-score Accuracy Recall
DIMNet MMU 0.048721 0.04726 0.03672
MRL 0.041243 0.03672 0.04261
CASIA V3 0.039821 0.04261 0.04726
CASIA V4 0.038232 0.04321 0.04321
Table 10
Comparison of existing methods with obtained accuracy.
References Feature
extraction
methods
Classification
methods
Datasets Obtained
accuracy
[11] CNN CNN and
Hamming
Distance
IITD 94.88 %
CASIA-Iris-
Interval V4,
96.56 %
MMU 98.01 %
[13] SDD CNN CASIA 95.5 %
MMU 95 %
[14] EH-WOA CNN IITD 92 %
MMU 95 %
[15] LDA DNN MMU 98.2 %
[16] DL CNN, SVM LFW 99.15 %
FERET 98.35 %
IITD 97.89 %
CASIA-
IrisV3
95.48 %
[17] PFFT KNN, SVM,
PNN
CASIA 1.1 99.99 %
CASIA 4.0 98.26 %
SCCSIE&T 99.25 %
VISA Iris 96.67 %
[18] MCFFN CNN CASIA-Iris-
Syn
99.55 %
CASIA-Iris-
Lamp
98.32 %
[19] OCFON Deep learning
methods
CASIA-Iris-
Twins
99.94 %
CASIA-Iris-
Lamp
99.57 %
[20] − MTL CASIA-Iris-
Lamp
99.95 %
Proposedmethods DMELA CSAN, SVM,
KNN, RF
MMU 99.98 %
MRL 99.35 %
CASIA V3 99.45 %
CASIA V4 99.65 %
Table 11
Iris segmentation and recognition results obtained through various approaches
are compared.
Methods Datasets Segmentation Classification
E (%) F1-score (%) GAR(FMR=0.1)
(%)
EER (%)
DIMNet MMU 0.43 98.38 99.01 0.27
MRL 0.34 97.65 99.26 0.06
CASIA V3 1.02 99.42 99.53 0.43
CASIA V4 1.06 98.76 99.17 0.32
NSCNet MMU 0.43 97.32 98.21 0.37
MRL 0.36 96.34 98.25 0.18
CASIA V3 1.03 98.43 99.05 0.56
CASIA V4 1.05 97.26 98.87 0.47
S.S. Salve and S.P. Narote Journal of Visual Communication and Image Representation 103 (2024) 104262
12](https://image.slidesharecdn.com/performanceevaluationofefficientsegmentationandclassificationbased-241012181457-526854a4/75/Performance-evaluation-of-efficient-segmentation-and-classification-based-iris-recognition-using-sheaf-attention-network-12-2048.jpg)
![Funding
This research did not receive any specific grant from funding
agencies in the public, commercial, or not-for-profit sectors.
CRediT authorship contribution statement
Sushilkumar S. Salve: Conceptualization. Sandipann P Narote:
Supervision.
Declaration of competing interest
The authors declare that they have no known competing financial
interests or personal relationships that could have appeared to influence
the work reported in this paper.
Data availability
Data sharing not applicable to this article as no datasets were
generated or analyzed during the current study.
Acknowledgement
None.
References
[1] K. Nguyen, H. Proença, F. Alonso-Fernandez, Deep Learning for Iris Recognition: A
Survey. arXiv Preprint arXiv:2210.05866. (2022).
[2] J. Wei, H. Huang, Y. Wang, R. He, Z. Sun, Towards more discriminative and robust
iris recognition by learning uncertain factors, IEEE Trans. Inf. Forensics Secur. 17
(2022) 865–879, https://doi.org/10.1109/tifs.2022.3154240.
[3] S. Jamaludin, A.F. Ayob, M.F. Akhbar, A.A. Ali, M.M. Imran, S.M. Norzeli, et al.,
Efficient, accurate and fast pupil segmentation for pupillary boundary in Iris
recognition, Adv. Eng. Softw. 175 (2023) 103352, https://doi.org/10.1016/j.
advengsoft.2022.103352.
[4] B. Karthik, G. Ramkumar, Comparison of feature extraction technique for
segmentation in human iris recognition under uncontrolled environment using
CNN algorithm with SVM classifier, ECS Trans. 107 (2022) 16785–16795, https://
doi.org/10.1149/10701.16785ecst.
[5] A. Boyd, S. Yadav, T. Swearingen, A. Kuehlkamp, M. Trokielewicz, E. Benjamin, et
al., Post-mortem iris recognition—a survey and assessment of the state of the art,
IEEE Access 8 (2020) 136570–136593, https://doi.org/10.1109/
access.2020.3011364.
[6] N. Ahmadi, M. Nilashi, S. Samad, T.A. Rashid, H. Ahmadi, An intelligent method
for Iris recognition using supervised machine learning techniques, Optics Laser
Technol. 120 (2019) 105701, https://doi.org/10.1016/j.optlastec.2019.105701.
[7] H. Hafeez, M.N. Zafar, C.A. Abbas, H. Elahi, M.O. Ali, Real-time human
authentication system based on Iris recognition, Eng. 3 (2022) 693–708, https://
doi.org/10.3390/eng3040047.
[8] B. Abd El-Rahiem, F.E. Abd El Samie, M. Amin, Efficient cancellable multi-
biometric recognition system based on Deep Learning and bio-hashing, Appl. Intell.
53 (2022) 1792–1806, https://doi.org/10.1007/s10489-021-03153-0.
[9] N.D. AL-Shakarchy, H.K. Obayes, Z.N. Abdullah, Person identification based on
voice biometric using deep neural network. Int. J. Inf. Technol. 15 (2022) 789–795.
DOI: 10.1007/s41870-022-01142-1.
[10] N. Alay, H.H. Al-Baity, Deep Learning Approach for multimodal biometric
recognition system based on fusion of Iris, face, and finger vein traits, Sens. 20
(2020) 5523, https://doi.org/10.3390/s20195523.
[11] R.H. Farouk, H. Mohsen, Y.M. El-Latif, A proposed biometric technique for
improving iris recognition, Int. J. Comput. Intell. Syst. 15 (2022), https://doi.org/
10.1007/s44196-022-00135-z.
[12] S.N. Khan, S.U. Khan, O.J. Nwobodo, K. Adam, Cyran, Iris recognition through
edge detection methods: application in flight simulator user identification, Int. J.
Adv. Comput. Sci. Appl. 14 (2023), https://doi.org/10.14569/
ijacsa.2023.0140425.
[13] E. Hussein Ali, H. Abbas Jaber, N. Naji Kadhim, New algorithm for localization of
iris recognition using Deep Learning Neural Networks, Indonesian J. Electr. Eng.
Comput. Sci. 29 (2022) 110, https://doi.org/10.11591/ijeecs.v29.i1.pp110-119.
[14] G. Babu, P.A. Khayum, Elephant herding with whale optimization enabled orb
features and CNN for Iris recognition, Multimed. Tools Appl. 81 (2021)
5761–5794, https://doi.org/10.1007/s11042-021-11746-7.
[15] R.A. Abdulhasan, S.T. Abd Al-latief, S.M. Kadhim, Instant learning based on deep
neural network with linear discriminant analysis features extraction for accurate
iris recognition system, Multimed. Tools Appl. (2023), https://doi.org/10.1007/
s11042-023-16751-6.
[16] E. Abdellatef, R.F. Soliman, E.M. Omran, N.A. Ismail, S.E. Elrahman, K.N. Ismail, et
al., Cancelable face and Iris recognition system based on Deep Learning, Optical
Quantum Electron. 54 (2022), https://doi.org/10.1007/s11082-022-03770-0.
[17] V.C. Kagawade, S.A. Angadi, A new scheme of Polar Fast Fourier transform code
for iris recognition through symbolic modelling approach, Exp. Syst. Appl. 197
(2022) 116745, https://doi.org/10.1016/j.eswa.2022.116745.
[18] J. Sun, S. Zhao, Y. Yu, X. Wang, L. Zhou, Iris recognition based on local circular
Gabor filters and multi-scale Convolution Feature Fusion Network, Multimed.
Tools Appl. 81 (2022) 33051–33065, https://doi.org/10.1007/s11042-022-13098-
2.
[19] J. Sun, S. Zhao, S. Miao, X. Wang, Y. Yu, Open-set iris recognition based on Deep
Learning, IET Image Proc. 16 (2022) 2361–2372, https://doi.org/10.1049/
ipr2.12493.
[20] S. Lei, B. Dong, A. Shan, Y. Li, W. Zhang, F. Xiao, Attention meta-transfer learning
approach for few-shot Iris recognition, Comput. Electr. Eng. 99 (2022) 107848,
https://doi.org/10.1016/j.compeleceng.2022.107848.
[21] J. Zhou, J. Yao, W. Zhang, D. Zhang, Multi-scale retinex-based adaptive gray-scale
transformation method for underwater image enhancement, Multimed. Tools Appl.
81 (2021) 1811–1831, https://doi.org/10.1007/s11042-021-11327-8.
[22] F. Bulut, Low dynamic range histogram equalization (LDR-HE) via quantized Haar
wavelet transform, Visual Comput. 38 (2021) 2239–2255, https://doi.org/
10.1007/s00371-021-02281-5.
[23] X. Soria, A. Sappa, P. Humanante, A. Akbarinia, Dense extreme inception network
for edge detection, Pattern Recogn. 139 (2023) 109461, https://doi.org/10.1016/
j.patcog.2023.109461.
[24] Y. Zhou, B. Sun, W. Sun, Z. Lei, Tool wear condition monitoring based on a two-
layer angle kernel extreme learning machine using sound sensor for milling
process, J. Intell. Manuf. 33 (2020) 247–258, https://doi.org/10.1007/s10845-
020-01663-1.
[25] M.A. Mohammed, A. Lakhan, K.H. Abdulkareem, B. Garcia-Zapirain, A hybrid
cancer prediction based on multi-omics data and Reinforcement Learning State
Action Reward State Action (Sarsa), Comput. Biol. Med. 154 (2023) 106617,
https://doi.org/10.1016/j.compbiomed.2023.106617.
[26] C. Yan, B. Gong, Y. Wei, Y. Gao, Deep multi-view enhancement hashing for image
retrieval, IEEE Trans. Pattern Anal. Mach. Intell. (2020), https://doi.org/10.1109/
TPAMI.2020.2975798.
[27] C. Yan, Z. Li, Y. Zhang, Y. Liu, X. Ji, Y. Zhang, Depth image denoising using nuclear
norm and learning graph model, ACM Trans. Multimed. Comput. Commun. Appl.
(2020), https://doi.org/10.1145/3404374.
[28] C. Yan, Y. Hao, L. Li, J. Yin, A. Liu, Z. Mao, Z. Chen, X. Gao, Task-adaptive
attention for image captioning, IEEE Trans. Circuits Syst. Video Technol. 32 (2021)
42–51, https://doi.org/10.1109/TCSVT.2021.3067449.
[29] C. Yan, T. Teng, Y. Liu, Y. Zhang, H. Wang, X. Ji, Precise no-reference image
quality evaluation based on distortion identification, ACM Trans. Multimed.
Comput. Commun. Appl. 17 (2021) 1–21, https://doi.org/10.1145/3468872.
[30] C. Yan, L. Meng, L. Li, J. Zhang, Z. Wang, J. Yin, J. Zhang, Y. Sun, B. Zheng, Age-
invariant face recognition by multi-feature fusion and decomposition with self-
attention, ACM Trans. Multimed. Comput. Commun. Appl. 18 (2021) 1–8, https://
doi.org/10.1145/3472810.
[31] C. Yan, Y. Sun, H. Zhong, C. Zhu, Z. Zhu, B. Zheng, X. Zhou, Review of omnimedia
content quality evaluation, J. Signal Process. 38 (2022) 1111–1143, https://doi.
org/10.16798/j.issn.1003-0530.2022.06.001.
S.S. Salve and S.P. Narote Journal of Visual Communication and Image Representation 103 (2024) 104262
13](https://image.slidesharecdn.com/performanceevaluationofefficientsegmentationandclassificationbased-241012181457-526854a4/75/Performance-evaluation-of-efficient-segmentation-and-classification-based-iris-recognition-using-sheaf-attention-network-13-2048.jpg)