Download to read offline

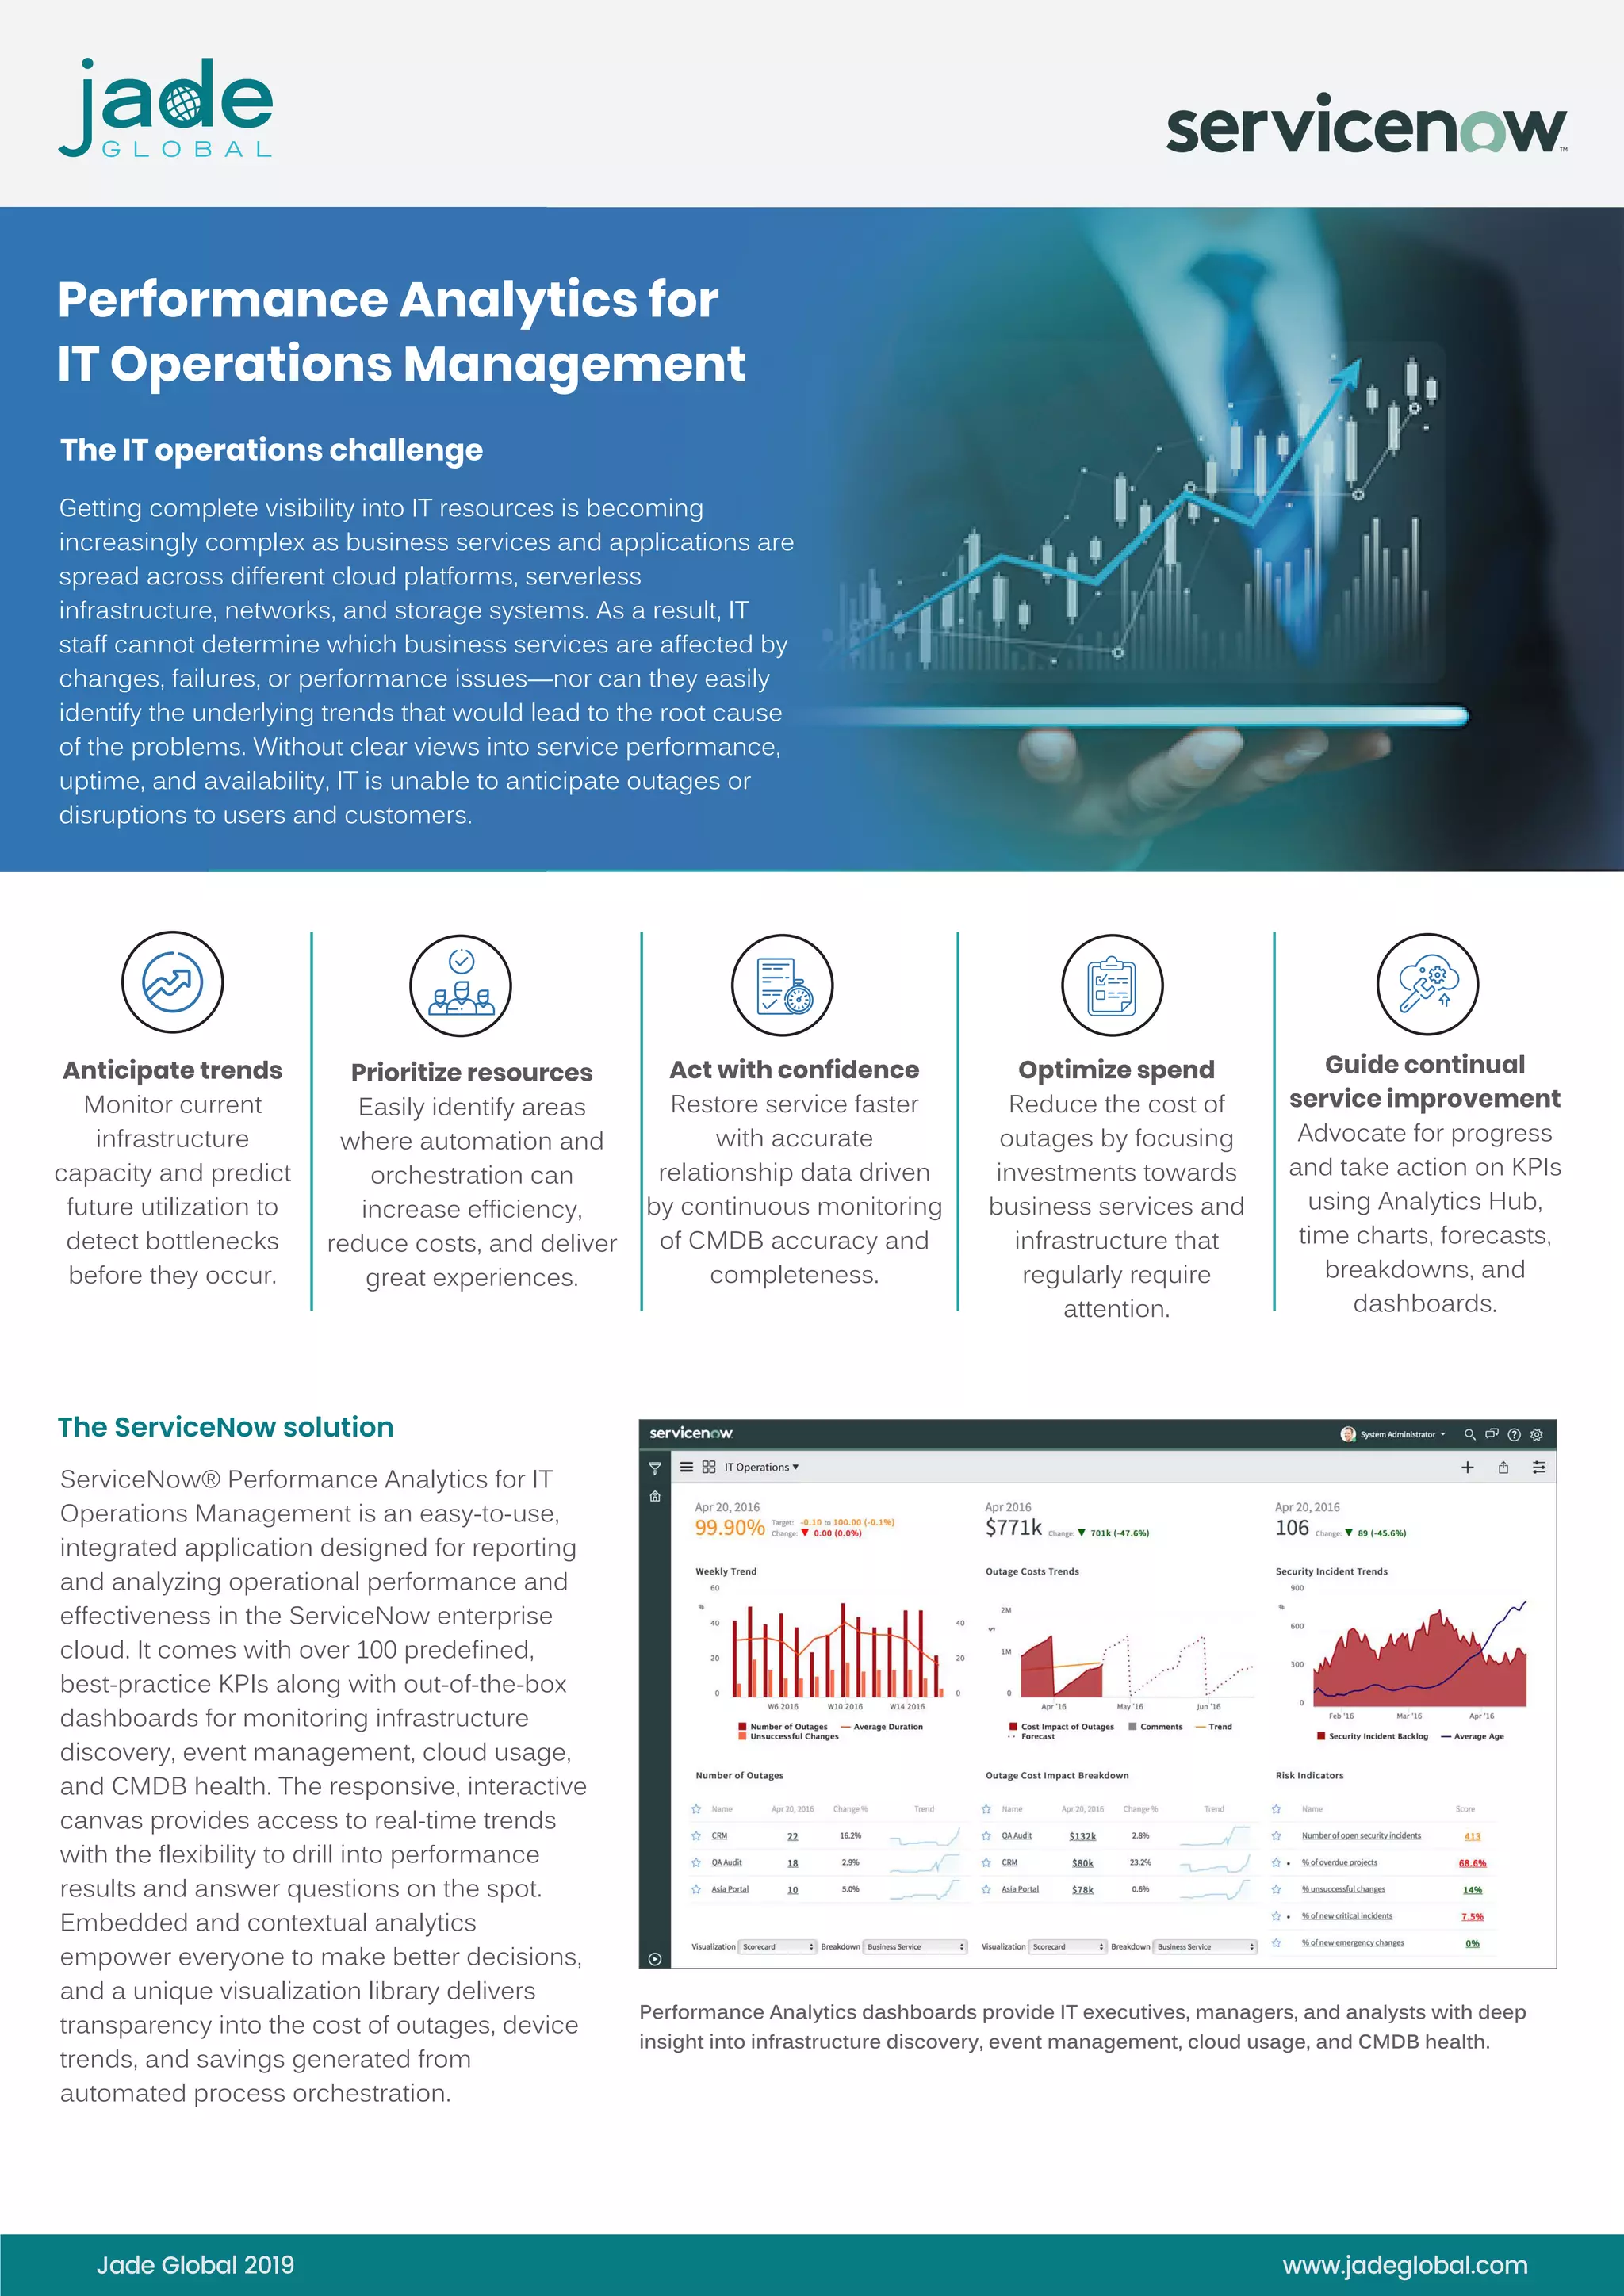


The document details ServiceNow's performance analytics for IT operations management, highlighting its features for monitoring and optimizing infrastructure and service delivery. It emphasizes the use of predefined KPIs, interactive dashboards, and embedded analytics to improve operational efficiency and decision-making. Additionally, it describes Jade Global's expertise in providing comprehensive IT solutions and partnerships with major tech companies.