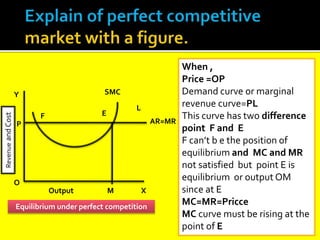
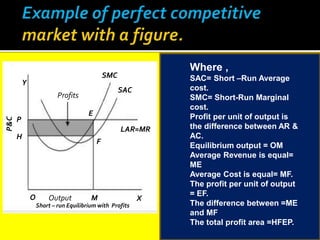
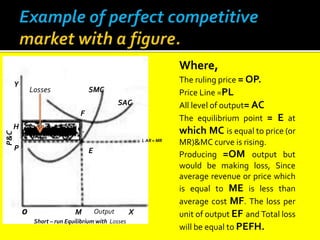
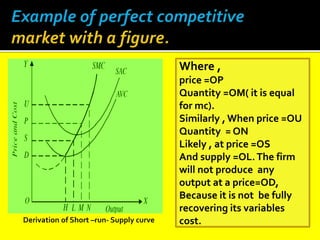
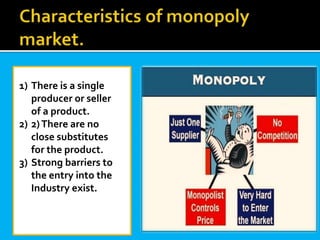
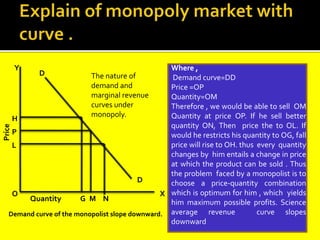
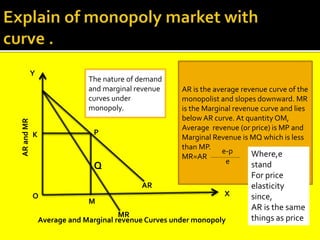
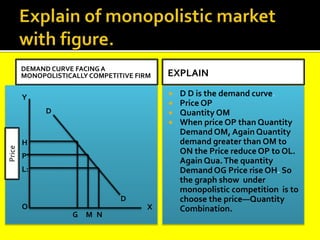
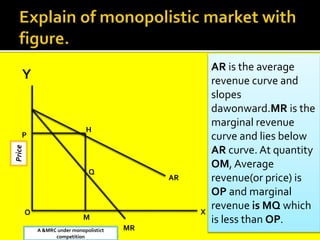
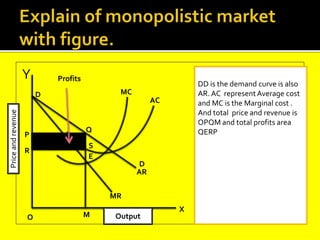
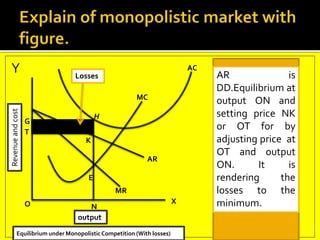
Presentation on :
1)Perfect competitive Market (with characteristics)
2)Monopoly Market(characteristics)
3)Monopolistic Competitive Market(With characteristics)
 What Is perfect competitive market in economics ?
 Perfect competitive market of characteristics.
 Example of perfect competitive market with a
figure.
 What is monopoly Market?
 Characteristics of monopoly market.
 Explain of monopoly market with picture.
 What is monopolistic Competitive Market ?
 Characteristics of monopolistic market.
 Explain of monopolistic market with figure.
Defination :-
A perfectly competitive market is a type of
market in which all available goods and
services are identical, there are no restrictions
on who can enter the market, and there are a
substantial number of buyers and sellers,
none of whom can influence the market
price.
 There are a large number of firms producing
and selling a product.
 The product of all firms is homogeneous.
 Both the seller and buyers perfect
information about the prevailing price in
the market.
 Entry into and exit from the industry is free
for the firms.
SMC
AR=MR
L
E
F
Y
P
O
M
Output
X
When ,
Price =OP
Demand curve or marginal
revenue curve=PL
This curve has two difference
point F and E
F can’t b e the position of
equilibrium and MC and MR
not satisfied but point E is
equilibrium or output OM
since at E
MC=MR=Pricce
MC curve must be rising at the
point of E
Equilibrium under perfect competition
Revenue
and
Cost
SMC
SAC
H
P
Y
O X
M
F
LAR=MR
Profits
P&C
Output
Short – run Equilibrium with Profits
Where ,
SAC= Short –Run Average
cost.
SMC= Short-Run Marginal
cost.
Profit per unit of output is
the difference between AR &
AC.
Equilibrium output = OM
Average Revenue is equal=
ME
Average Cost is equal= MF.
The profit per unit of output
= EF.
The difference between =ME
and MF
The total profit area =HFEP.
E
Y
H
P
o M X
E
L AR = MR
SAC
SMC
F
Losses
Output
P&C
Short – run Equilibrium with Losses
Where,
The ruling price = OP.
Price Line =PL
All level of output= AC
The equilibrium point = E at
which MC is equal to price (or
MR)&MC curve is rising.
Producing =OM output but
would be making loss, Since
average revenue or price which
is equal to ME is less than
average cost MF. The loss per
unit of output EF and Total loss
will be equal to PEFH.
Derivation of Short –run- Supply curve
Where ,
price =OP
Quantity =OM( it is equal
for mc).
Similarly , When price =OU
Quantity = ON
Likely , at price =OS
And supply =OL.The firm
will not produce any
output at a price=OD,
Because it is not be fully
recovering its variables
cost.
What is Monopoly Market?
1) There is a single
producer or seller
of a product.
2) 2)There are no
close substitutes
for the product.
3) Strong barriers to
the entry into the
Industry exist.
Y
D
D
N
M
G
X
O
H
P
L
Price
Quantity
Where ,
Demand curve=DD
Price =OP
Quantity=OM
Therefore , we would be able to sell OM
Quantity at price OP. If he sell better
quantity ON, Then price the to OL. If
would he restricts his quantity to OG, fall
price will rise to OH. thus every quantity
changes by him entails a change in price
at which the product can be sold . Thus
the problem faced by a monopolist is to
choose a price-quantity combination
which is optimum for him , which yields
him maximum possible profits. Science
average revenue curve slopes
downward
The nature of
demand and
marginal revenue
curves under
monopoly.
Demand curve of the monopolist slope downward.
Y
K
O
P
Q
M
MR
AR
X
AR
and
MR
Average and Marginal revenue Curves under monopoly
The nature of demand
and marginal revenue
curves under
monopoly.
AR is the average revenue curve of the
monopolist and slopes downward. MR
is the Marginal revenue curve and lies
below AR curve. At quantity OM,
Average revenue (or price) is MP and
Marginal Revenue is MQ which is less
than MP.
MR=AR
e-p
e
Where,e
stand
For price
elasticity
since,
AR is the same
things as price
e .
Y
P
H
O
T
S
MC
AC
AR
MR
M
X
Revenue
&Cost
Equilibrium under monopoly
maximization of profits
Price output
under monopoly
Where,
MR =MC and OM level of out
put . The maximum profits and
will therefore be in equilibrium
when it is producing and selling
OM quantity of the product. If
increase output beyond OM,
Marginal Revenue will be less
then marginal cost.T hat is
additional unit beyond OM will
add more to cost than to
revenue. Therefore , the
monopolist will be incurring loss
on the additional units beyond
OM
And reducing total profit but
producing than OM. SO, OM
level of output (MC=MR)
When many
companies offer
competing products
or services that are
similar, but not
perfect, substitutes
than its call
Monopolistic
comprtitive market
MONOPOLISTICCOMPETITION
EXAMPLES
FEATURES OF MONOPOLISTIC
COMPETITION
DEMAND CURVE FACING A
MONOPOLISTICALLY COMPETITIVE FIRM EXPLAIN
 D D is the demand curve.
 Price OP
 Quantity OM
 When price OP than Quantity
Demand OM, Again Quantity
demand greater than OM to
ON the Price reduce OP to OL.
Again Qua.The quantity
Demand OG Price rise OH. So
the graph show under
monopolistic competition is to
choose the price—Quantity
Combination.
Y
D
D
H
P
L:
O
G M N
X
Price
Y
P
O
H
Q
AR
M
MR
X
AR is the average
revenue curve and
slopes
dawonward.MR is the
marginal revenue
curve and lies below
AR curve. At quantity
OM, Average
revenue(or price) is
OP and marginal
revenue is MQ which
is less than OP.
A &MRC under monopolistict
competition
Price
Y
D
D
O
AC
M
MR
AR
MC
E
S
P
Q
R
X
Profits
DD is the demand curve is also
AR. AC representAverage cost
and MC is the Marginal cost .
And total price and revenue is
OPQM and total profits area
QERP
Price
and
revenue
Output
Y
H
MC
AC
K
E
AR
MR
X
N
O
T
G
Revenue
and
cost
output
Losses
Equilibrium under MonopolisticCompetition (With losses)
AR is
DD.Equilibrium at
output ON and
setting price NK
or OT for by
adjusting price at
OT and output
ON. It is
rendering the
losses to the
minimum.
 I Don’t Like to prolong my Session .
Have Any
Query ?

Perfect competitive Market MH02.pptx

  • 1.
    Presentation on : 1)Perfectcompetitive Market (with characteristics) 2)Monopoly Market(characteristics) 3)Monopolistic Competitive Market(With characteristics)
  • 2.
     What Isperfect competitive market in economics ?  Perfect competitive market of characteristics.  Example of perfect competitive market with a figure.  What is monopoly Market?  Characteristics of monopoly market.  Explain of monopoly market with picture.  What is monopolistic Competitive Market ?  Characteristics of monopolistic market.  Explain of monopolistic market with figure.
  • 3.
    Defination :- A perfectlycompetitive market is a type of market in which all available goods and services are identical, there are no restrictions on who can enter the market, and there are a substantial number of buyers and sellers, none of whom can influence the market price.
  • 4.
     There area large number of firms producing and selling a product.  The product of all firms is homogeneous.  Both the seller and buyers perfect information about the prevailing price in the market.  Entry into and exit from the industry is free for the firms.
  • 5.
    SMC AR=MR L E F Y P O M Output X When , Price =OP Demandcurve or marginal revenue curve=PL This curve has two difference point F and E F can’t b e the position of equilibrium and MC and MR not satisfied but point E is equilibrium or output OM since at E MC=MR=Pricce MC curve must be rising at the point of E Equilibrium under perfect competition Revenue and Cost
  • 6.
    SMC SAC H P Y O X M F LAR=MR Profits P&C Output Short –run Equilibrium with Profits Where , SAC= Short –Run Average cost. SMC= Short-Run Marginal cost. Profit per unit of output is the difference between AR & AC. Equilibrium output = OM Average Revenue is equal= ME Average Cost is equal= MF. The profit per unit of output = EF. The difference between =ME and MF The total profit area =HFEP. E
  • 7.
    Y H P o M X E LAR = MR SAC SMC F Losses Output P&C Short – run Equilibrium with Losses Where, The ruling price = OP. Price Line =PL All level of output= AC The equilibrium point = E at which MC is equal to price (or MR)&MC curve is rising. Producing =OM output but would be making loss, Since average revenue or price which is equal to ME is less than average cost MF. The loss per unit of output EF and Total loss will be equal to PEFH.
  • 8.
    Derivation of Short–run- Supply curve Where , price =OP Quantity =OM( it is equal for mc). Similarly , When price =OU Quantity = ON Likely , at price =OS And supply =OL.The firm will not produce any output at a price=OD, Because it is not be fully recovering its variables cost.
  • 9.
  • 10.
    1) There isa single producer or seller of a product. 2) 2)There are no close substitutes for the product. 3) Strong barriers to the entry into the Industry exist.
  • 11.
    Y D D N M G X O H P L Price Quantity Where , Demand curve=DD Price=OP Quantity=OM Therefore , we would be able to sell OM Quantity at price OP. If he sell better quantity ON, Then price the to OL. If would he restricts his quantity to OG, fall price will rise to OH. thus every quantity changes by him entails a change in price at which the product can be sold . Thus the problem faced by a monopolist is to choose a price-quantity combination which is optimum for him , which yields him maximum possible profits. Science average revenue curve slopes downward The nature of demand and marginal revenue curves under monopoly. Demand curve of the monopolist slope downward.
  • 12.
    Y K O P Q M MR AR X AR and MR Average and Marginalrevenue Curves under monopoly The nature of demand and marginal revenue curves under monopoly. AR is the average revenue curve of the monopolist and slopes downward. MR is the Marginal revenue curve and lies below AR curve. At quantity OM, Average revenue (or price) is MP and Marginal Revenue is MQ which is less than MP. MR=AR e-p e Where,e stand For price elasticity since, AR is the same things as price
  • 13.
    e . Y P H O T S MC AC AR MR M X Revenue &Cost Equilibrium undermonopoly maximization of profits Price output under monopoly Where, MR =MC and OM level of out put . The maximum profits and will therefore be in equilibrium when it is producing and selling OM quantity of the product. If increase output beyond OM, Marginal Revenue will be less then marginal cost.T hat is additional unit beyond OM will add more to cost than to revenue. Therefore , the monopolist will be incurring loss on the additional units beyond OM And reducing total profit but producing than OM. SO, OM level of output (MC=MR)
  • 14.
    When many companies offer competingproducts or services that are similar, but not perfect, substitutes than its call Monopolistic comprtitive market
  • 15.
  • 16.
    DEMAND CURVE FACINGA MONOPOLISTICALLY COMPETITIVE FIRM EXPLAIN  D D is the demand curve.  Price OP  Quantity OM  When price OP than Quantity Demand OM, Again Quantity demand greater than OM to ON the Price reduce OP to OL. Again Qua.The quantity Demand OG Price rise OH. So the graph show under monopolistic competition is to choose the price—Quantity Combination. Y D D H P L: O G M N X Price
  • 17.
    Y P O H Q AR M MR X AR is theaverage revenue curve and slopes dawonward.MR is the marginal revenue curve and lies below AR curve. At quantity OM, Average revenue(or price) is OP and marginal revenue is MQ which is less than OP. A &MRC under monopolistict competition Price
  • 18.
    Y D D O AC M MR AR MC E S P Q R X Profits DD is thedemand curve is also AR. AC representAverage cost and MC is the Marginal cost . And total price and revenue is OPQM and total profits area QERP Price and revenue Output
  • 19.
    Y H MC AC K E AR MR X N O T G Revenue and cost output Losses Equilibrium under MonopolisticCompetition(With losses) AR is DD.Equilibrium at output ON and setting price NK or OT for by adjusting price at OT and output ON. It is rendering the losses to the minimum.
  • 20.
     I Don’tLike to prolong my Session . Have Any Query ?