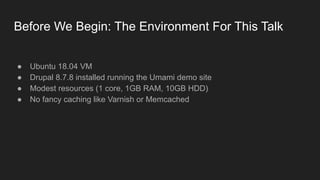
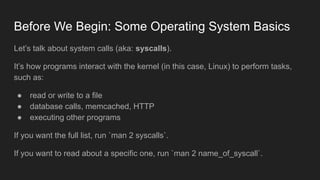
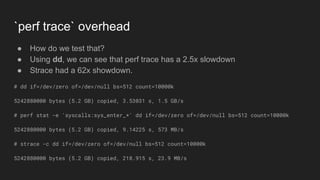
Over the past few years the Linux kernel has gained features that allow us to learn more about what's really happening on our servers and the applications that run on them.
This talk will explore how these new features, particularly perf_events and ebpf, enable us to answer questions about what a Drupal site is doing in real time beyond what the standard logs, server performance tools, and even strace will reveal. Attendees will be provided a brief introduction to example uses of these tools to diagnose performance problems.
This talk is intended for attendees that are familiar with Linux, the command line, and have used host observability tools in the past (top, netstat, etc).
It's been three years since Netflix's Brendan Gregg described the Berkeley Packet Filter as "Superpowers for Linux". Since then there has been an explosion of capabilities and tools based on eBPF, so you've probably heard the term, but do you know what it is and how to use it? In this demo-rich talk we'll explore some of the powerful things we can do with this technology, especially in the context of containers.
Make Your Containers Faster: Linux Container Performance ToolsKernel TLV
If you look under the hood, Linux containers are just processes with some isolation features and resource quotas sprinkled on top. In this talk, we will apply modern Linux performance tools to container analysis: get high-level resource utilization on running containers with docker stats, htop, and nsenter; dig into high-CPU issues with perf; detect slow filesystem latency with BPF-based tools; and generate flame graphs of interesting event call stacks.
Sasha Goldshtein is the CTO of Sela Group, a Microsoft MVP and Regional Director, Pluralsight and O'Reilly author, and international consultant and trainer. Sasha is the author of two books and multiple online courses, and a prolific blogger. He is also an active open source contributor to projects focused on system diagnostics, performance monitoring, and tracing -- across multiple operating systems and runtimes. Sasha authored and delivered training courses on Linux performance optimization, event tracing, production debugging, mobile application development, and modern C++. Between his consulting engagements, Sasha speaks at international conferences world-wide.
You can find more details on the meetup page - https://www.meetup.com/Tel-Aviv-Yafo-Linux-Kernel-Meetup/events/245319189/
Linux Performance Analysis: New Tools and Old SecretsBrendan Gregg
Talk for USENIX/LISA2014 by Brendan Gregg, Netflix. At Netflix performance is crucial, and we use many high to low level tools to analyze our stack in different ways. In this talk, I will introduce new system observability tools we are using at Netflix, which I've ported from my DTraceToolkit, and are intended for our Linux 3.2 cloud instances. These show that Linux can do more than you may think, by using creative hacks and workarounds with existing kernel features (ftrace, perf_events). While these are solving issues on current versions of Linux, I'll also briefly summarize the future in this space: eBPF, ktap, SystemTap, sysdig, etc.
Talk for PerconaLive 2016 by Brendan Gregg. Video: https://www.youtube.com/watch?v=CbmEDXq7es0 . "Systems performance provides a different perspective for analysis and tuning, and can help you find performance wins for your databases, applications, and the kernel. However, most of us are not performance or kernel engineers, and have limited time to study this topic. This talk summarizes six important areas of Linux systems performance in 50 minutes: observability tools, methodologies, benchmarking, profiling, tracing, and tuning. Included are recipes for Linux performance analysis and tuning (using vmstat, mpstat, iostat, etc), overviews of complex areas including profiling (perf_events), static tracing (tracepoints), and dynamic tracing (kprobes, uprobes), and much advice about what is and isn't important to learn. This talk is aimed at everyone: DBAs, developers, operations, etc, and in any environment running Linux, bare-metal or the cloud."
This talk will provide several examples of how Facebook engineers use BPF to scale the networking, prevent denial of service, secure containers, analyze performance. It’s suitable for BPF newbies and experts.
Alexei Starovoitov, Facebook
System calls are the primary mechanism of user-to-kernel interaction. Today the Linux system call interface has achieved a primacy and ubiquity that make it an ideal layer at which to understand single-system and distributed-system pathologies. Sysdig advances the art of system call observability by drawing on the systems that came before it. Informed by his work with /proc, process tools and DTrace, Adam will walk through a history of system calls and system call observability from simple systems like truss and strace, moderns ones like DTrace and SystemTab, and ancient ones from the early days of Unix.
Surge 2014: From Clouds to Roots: root cause performance analysis at Netflix. Brendan Gregg.
At Netflix, high scale and fast deployment rule. The possibilities for failure are endless, and the environment excels at handling this, regularly tested and exercised by the simian army. But, when this environment automatically works around systemic issues that aren’t root-caused, they can grow over time. This talk describes the challenge of not just handling failures of scale on the Netflix cloud, but also new approaches and tools for quickly diagnosing their root cause in an ever changing environment.
Talk for SCaLE13x. Video: https://www.youtube.com/watch?v=_Ik8oiQvWgo . Profiling can show what your Linux kernel and appliacations are doing in detail, across all software stack layers. This talk shows how we are using Linux perf_events (aka "perf") and flame graphs at Netflix to understand CPU usage in detail, to optimize our cloud usage, solve performance issues, and identify regressions. This will be more than just an intro: profiling difficult targets, including Java and Node.js, will be covered, which includes ways to resolve JITed symbols and broken stacks. Included are the easy examples, the hard, and the cutting edge.
Kernel Recipes 2017: Performance Analysis with BPFBrendan Gregg
Talk by Brendan Gregg at Kernel Recipes 2017 (Paris): "The in-kernel Berkeley Packet Filter (BPF) has been enhanced in recent kernels to do much more than just filtering packets. It can now run user-defined programs on events, such as on tracepoints, kprobes, uprobes, and perf_events, allowing advanced performance analysis tools to be created. These can be used in production as the BPF virtual machine is sandboxed and will reject unsafe code, and are already in use at Netflix.
Beginning with the bpf() syscall in 3.18, enhancements have been added in many kernel versions since, with major features for BPF analysis landing in Linux 4.1, 4.4, 4.7, and 4.9. Specific capabilities these provide include custom in-kernel summaries of metrics, custom latency measurements, and frequency counting kernel and user stack traces on events. One interesting case involves saving stack traces on wake up events, and associating them with the blocked stack trace: so that we can see the blocking stack trace and the waker together, merged in kernel by a BPF program (that particular example is in the kernel as samples/bpf/offwaketime).
This talk will discuss the new BPF capabilities for performance analysis and debugging, and demonstrate the new open source tools that have been developed to use it, many of which are in the Linux Foundation iovisor bcc (BPF Compiler Collection) project. These include tools to analyze the CPU scheduler, TCP performance, file system performance, block I/O, and more."
Talk for USENIX LISA17: "Containers pose interesting challenges for performance monitoring and analysis, requiring new analysis methodologies and tooling. Resource-oriented analysis, as is common with systems performance tools and GUIs, must now account for both hardware limits and soft limits, as implemented using cgroups. A reverse diagnosis methodology can be applied to identify whether a container is resource constrained, and by which hard or soft resource. The interaction between the host and containers can also be examined, and noisy neighbors identified or exonerated. Performance tooling can need special usage or workarounds to function properly from within a container or on the host, to deal with different privilege levels and name spaces. At Netflix, we're using containers for some microservices, and care very much about analyzing and tuning our containers to be as fast and efficient as possible. This talk will show you how to identify bottlenecks in the host or container configuration, in the applications by profiling in a container environment, and how to dig deeper into kernel and container internals."
From USENIX LISA 2010, San Jose.
Visualizations that include heat maps can be an effective way to present performance data: I/O latency, resource utilization, and more. Patterns can emerge that would be difficult to notice from columns of numbers or line graphs, which are revealing previously unknown behavior. These visualizations are used in a product as a replacement for traditional metrics such as %CPU and are allowing end users to identify more issues much more easily (and some issues are becoming nearly impossible to identify with tools such as vmstat(1)). This talk covers what has been learned, crazy heat map discoveries, and thoughts for future applications beyond performance analysis.
Agenda:
The Linux kernel has multiple "tracers" built-in, with various degrees of support for aggregation, dynamic probes, parameter processing, filtering, histograms, and other features. Starting from the venerable ftrace, introduced in kernel 2.6, all the way through eBPF, which is still under development, there are many options to choose from when you need to statically instrument your software with probes, or diagnose issues in the field using the system's dynamic probes. Modern tools include SystemTap, Sysdig, ktap, perf, bcc, and others. In this talk, we will begin by reviewing the modern tracing landscape -- ftrace, perf_events, kprobes, uprobes, eBPF -- and what insight into system activity these tools can offer. Then, we will look at specific examples of using tracing tools for diagnostics: tracing a memory leak using low-overhead kmalloc/kfree instrumentation, diagnosing a CPU caching issue using perf stat, probing network and block I/O latency distributions under load, or merely snooping user activities by capturing terminal input and output.
Speaker:
Sasha is the CTO of Sela Group, a training and consulting company based in Israel that employs over 400 developers world-wide. Most of Sasha's work revolves around performance optimization, production debugging, and low-level system diagnostics, but he also dabbles in mobile application development on iOS and Android. Sasha is the author of two books and three Pluralsight courses, and a contributor to multiple open-source projects. He blogs at http://blog.sashag.net.
Kernel Recipes 2017: Using Linux perf at NetflixBrendan Gregg
Talk for Kernel Recipes 2017 by Brendan Gregg. "Linux perf is a crucial performance analysis tool at Netflix, and is used by a self-service GUI for generating CPU flame graphs and other reports. This sounds like an easy task, however, getting perf to work properly in VM guests running Java, Node.js, containers, and other software, has been at times a challenge. This talk summarizes Linux perf, how we use it at Netflix, the various gotchas we have encountered, and a summary of advanced features."
You have a system with an advanced programmatic tracer: do you know what to do with it? Brendan has used numerous tracers in production environments, and has published hundreds of tracing-based tools. In this talk he will share tips and know-how for creating CLI tracing tools and GUI visualizations, to solve real problems effectively. Programmatic tracing is an amazing superpower, and this talk will show you how to wield it!
Tracing MariaDB server with bpftrace - MariaDB Server Fest 2021Valeriy Kravchuk
Bpftrace is a relatively new eBPF-based open source tracer for modern Linux versions (kernels 5.x.y) that is useful for analyzing production performance problems and troubleshooting software. Basic usage of the tool, as well as bpftrace one liners and advanced scripts useful for MariaDB DBAs are presented. Problems of MariaDB Server dynamic tracing with bpftrace and some possible solutions and alternative tracing tools are discussed.
USENIX ATC 2017: Visualizing Performance with Flame GraphsBrendan Gregg
Talk by Brendan Gregg for USENIX ATC 2017.
"Flame graphs are a simple stack trace visualization that helps answer an everyday problem: how is software consuming resources, especially CPUs, and how did this change since the last software version? Flame graphs have been adopted by many languages, products, and companies, including Netflix, and have become a standard tool for performance analysis. They were published in "The Flame Graph" article in the June 2016 issue of Communications of the ACM, by their creator, Brendan Gregg.
This talk describes the background for this work, and the challenges encountered when profiling stack traces and resolving symbols for different languages, including for just-in-time compiler runtimes. Instructions will be included generating mixed-mode flame graphs on Linux, and examples from our use at Netflix with Java. Advanced flame graph types will be described, including differential, off-CPU, chain graphs, memory, and TCP events. Finally, future work and unsolved problems in this area will be discussed."
A 2015 performance study by Brendan Gregg, Nitesh Kant, and Ben Christensen. Original is in https://github.com/Netflix-Skunkworks/WSPerfLab/tree/master/test-results
Video: https://www.youtube.com/watch?v=uibLwoVKjec . Talk by Brendan Gregg for Sysdig CCWFS 2016. Abstract:
"You have a system with an advanced programmatic tracer: do you know what to do with it? Brendan has used numerous tracers in production environments, and has published hundreds of tracing-based tools. In this talk he will share tips and know-how for creating CLI tracing tools and GUI visualizations, to solve real problems effectively. Programmatic tracing is an amazing superpower, and this talk will show you how to wield it!"
Broken benchmarks, misleading metrics, and terrible tools. This talk will help you navigate the treacherous waters of Linux performance tools, touring common problems with system tools, metrics, statistics, visualizations, measurement overhead, and benchmarks. You might discover that tools you have been using for years, are in fact, misleading, dangerous, or broken.
The speaker, Brendan Gregg, has given many talks on tools that work, including giving the Linux PerformanceTools talk originally at SCALE. This is an anti-version of that talk, to focus on broken tools and metrics instead of the working ones. Metrics can be misleading, and counters can be counter-intuitive! This talk will include advice for verifying new performance tools, understanding how they work, and using them successfully.
Dynamic tracing of MariaDB on Linux - problems and solutions (MariaDB Server ...Valeriy Kravchuk
Linux with kernels 2.6+. provides different ways to add user probes to almost every other line of code dynamically, and collect the resulting trace and profiling data in a safe and efficient way. This session discusses basic use of ftrace, perf, bcc tools and bpftrace utility, highlights typical problems MariaDB DBAs and developers may hit while trying to apply them, as well as solutions to some of them.
linux monitoring and performance tunning iman darabi
howto monitor linux server? what metrics are important when monitor server? what is related between metrics and monitoring tools? what are basic linux server optimization ? howto optimize ?
Kernel Recipes 2017 - Using Linux perf at Netflix - Brendan GreggAnne Nicolas
Linux perf is a crucial performance analysis tool at Netflix, and is used by a self-service GUI for generating CPU flame graphs and other reports. This sounds like an easy task, however, getting perf to work properly in VM guests running Java, Node.js, containers, and other software, has been at times a challenge. This talk summarizes Linux perf, how we use it at Netflix, the various gotchas we have encountered, and a summary of advanced features.
Brendan Gregg, Netflix
Developed for the Denver Art Museum by Ashley Blewer, this slide-deck covers some of the basics of diagnosing issues with Archivematica. Ashley covers everything from the software components involved with Archivematica, to monitoring logs, system monitoring, and upgrading your system. The presentation concludes with some useful links for tech-savvy preservationists, and Archivematica-unfamiliar system's administrators!
5/13/13 presentation to Austin DevOps Meetup Group, describing our system for deploying 15 websites and supporting services in multiple languages to bare redhat 6 VMs. All system-wide software is installed using RPMs, and all application software is installed using GIT or Tarball.
Introduction to metasploit that we presented to the 4th year compsci students at Rhodes university.Covering the basic functionality of metasploit, and penetration testing.
The practical section that Etienne made (with Ponies) will come soon.
NRPE - Nagios Remote Plugin Executor. NRPE plugin for Nagios Core 4 and others.Marc Trimble
Nrpe - Nagios Remote Plugin Executor.
NRPE gives users the option to execute Nagios plugins remotely on any of their Linux/Unix machines. This option enables users to oversee their machine metrics, remotely, giving insights into disk usage, CPU load, etc. NRPE also allows users to interact and communicate with Windows agent add-ons. These add-ons monitor metrics and execute scripts.
https://www.nagios.com/news/2015/09/nagios-named-top-it-monitoring-tool/
The Popper Experimentation Protocol and CLI toolIvo Jimenez
Popper is a convention for conducting scientific explorations and writing academic articles following a DevOps approach. Popper allows researchers to automate the re-execution and validation of experimentation (computational and analysis) pipelines. This talk gives an overview and examples.
A guest lecture at National University of Defense Technology (NUDT) in 2016 to postgraduate students in China about emerging technologies in the Linux operating system.
Positive Hack Days. Pavlov. Network Infrastructure Security AssessmentPositive Hack Days
A participant will acquire basic skills of searching for vulnerabilities on switches and routers from various vendors. The masterclass will cover both common network vulnerabilities, and exceptive cases that can be detected in the process of security assessment of real networks.
1.Wireless Communication System_Wireless communication is a broad term that i...JeyaPerumal1
Wireless communication involves the transmission of information over a distance without the help of wires, cables or any other forms of electrical conductors.
Wireless communication is a broad term that incorporates all procedures and forms of connecting and communicating between two or more devices using a wireless signal through wireless communication technologies and devices.
Features of Wireless Communication
The evolution of wireless technology has brought many advancements with its effective features.
The transmitted distance can be anywhere between a few meters (for example, a television's remote control) and thousands of kilometers (for example, radio communication).
Wireless communication can be used for cellular telephony, wireless access to the internet, wireless home networking, and so on.
# Internet Security: Safeguarding Your Digital World
In the contemporary digital age, the internet is a cornerstone of our daily lives. It connects us to vast amounts of information, provides platforms for communication, enables commerce, and offers endless entertainment. However, with these conveniences come significant security challenges. Internet security is essential to protect our digital identities, sensitive data, and overall online experience. This comprehensive guide explores the multifaceted world of internet security, providing insights into its importance, common threats, and effective strategies to safeguard your digital world.
## Understanding Internet Security
Internet security encompasses the measures and protocols used to protect information, devices, and networks from unauthorized access, attacks, and damage. It involves a wide range of practices designed to safeguard data confidentiality, integrity, and availability. Effective internet security is crucial for individuals, businesses, and governments alike, as cyber threats continue to evolve in complexity and scale.
### Key Components of Internet Security
1. **Confidentiality**: Ensuring that information is accessible only to those authorized to access it.
2. **Integrity**: Protecting information from being altered or tampered with by unauthorized parties.
3. **Availability**: Ensuring that authorized users have reliable access to information and resources when needed.
## Common Internet Security Threats
Cyber threats are numerous and constantly evolving. Understanding these threats is the first step in protecting against them. Some of the most common internet security threats include:
### Malware
Malware, or malicious software, is designed to harm, exploit, or otherwise compromise a device, network, or service. Common types of malware include:
- **Viruses**: Programs that attach themselves to legitimate software and replicate, spreading to other programs and files.
- **Worms**: Standalone malware that replicates itself to spread to other computers.
- **Trojan Horses**: Malicious software disguised as legitimate software.
- **Ransomware**: Malware that encrypts a user's files and demands a ransom for the decryption key.
- **Spyware**: Software that secretly monitors and collects user information.
### Phishing
Phishing is a social engineering attack that aims to steal sensitive information such as usernames, passwords, and credit card details. Attackers often masquerade as trusted entities in email or other communication channels, tricking victims into providing their information.
### Man-in-the-Middle (MitM) Attacks
MitM attacks occur when an attacker intercepts and potentially alters communication between two parties without their knowledge. This can lead to the unauthorized acquisition of sensitive information.
### Denial-of-Service (DoS) and Distributed Denial-of-Service (DDoS) Attacks
This 7-second Brain Wave Ritual Attracts Money To You.!nirahealhty
Discover the power of a simple 7-second brain wave ritual that can attract wealth and abundance into your life. By tapping into specific brain frequencies, this technique helps you manifest financial success effortlessly. Ready to transform your financial future? Try this powerful ritual and start attracting money today!
Bridging the Digital Gap Brad Spiegel Macon, GA Initiative.pptxBrad Spiegel Macon GA
Brad Spiegel Macon GA’s journey exemplifies the profound impact that one individual can have on their community. Through his unwavering dedication to digital inclusion, he’s not only bridging the gap in Macon but also setting an example for others to follow.
Multi-cluster Kubernetes Networking- Patterns, Projects and GuidelinesSanjeev Rampal
Talk presented at Kubernetes Community Day, New York, May 2024.
Technical summary of Multi-Cluster Kubernetes Networking architectures with focus on 4 key topics.
1) Key patterns for Multi-cluster architectures
2) Architectural comparison of several OSS/ CNCF projects to address these patterns
3) Evolution trends for the APIs of these projects
4) Some design recommendations & guidelines for adopting/ deploying these solutions.
APNIC Foundation, presented by Ellisha Heppner at the PNG DNS Forum 2024APNIC
Ellisha Heppner, Grant Management Lead, presented an update on APNIC Foundation to the PNG DNS Forum held from 6 to 10 May, 2024 in Port Moresby, Papua New Guinea.
2. Who Am I?
● Senior Manager, SRE, Acquia
● Acquian since December 2010
● Champion DevOps, SRE,
operational, agile best practices
3. WARNING: This is NOT Your Usual Linux Talk
We won’t be talking about the usual suspects:
● top, ps, uptime
● sar, mpstat, iostat
● not even strace or lsof
● (well, maybe a little strace)
Past talk: https://bit.ly/2BNzNy5
4. Goal: An Introduction to Advanced Tooling
● Tools: perf_events, ebpf
● Origins and capabilities
● How to install these tools
● Demo of examples that you can use today
Aim is to provide inspiration on simple yet powerful ways to troubleshoot Drupal
from the infrastructure and performance side.
The classic tools answer what resources are being used.
These tools answer how resources are being used in much greater detail.
5. Before We Begin: Tool Caveats
1) These tools can introduce a performance overhead.
Keep that in mind when deciding to analyse your production workloads. Run
in non-production where possible.
2) Some tools require you to rebuild your services in order to use them.
Eg: mysqld, php, etc
3) Some tools require you to install debug packages to be useful.
4) These tools require root access.
6. Before We Begin: The Environment For This Talk
● Ubuntu 18.04 VM
● Drupal 8.7.8 installed running the Umami demo site
● Modest resources (1 core, 1GB RAM, 10GB HDD)
● No fancy caching like Varnish or Memcached
7. Before We Begin: Some Operating System Basics
Let’s talk about system calls (aka: syscalls).
It’s how programs interact with the kernel (in this case, Linux) to perform tasks,
such as:
● read or write to a file
● database calls, memcached, HTTP
● executing other programs
If you want the full list, run `man 2 syscalls`.
If you want to read about a specific one, run `man 2 name_of_syscall`.
10. perf_events
● It’s been around since 2009
● Part of the linux kernel since 2.6.31
● Originally called Performance Counters for Linux
● Enables capture of analysis of broad performance-related kernel events
● Not very well documented :(
● To install: linux-tools package
11. The Extended Berkeley Packet Filter (eBPF)
The Berkeley Packet Filter was originally simply that: a packet filter.
However, there are certain characteristics of the project as it evolved since 2014
that expanded upon its originally-intended usage:
● Filters were implemented as programs that ran in a kernel-mode VM;
● “BPF guarantees that the programs loaded into the kernel cannot crash, and
cannot run forever”
● eBPF programs can access in-kernel debugging features such as kprobes
12. What Does This Mean For eBPF?
You can use eBPF for in-depth performance analysis of a running server, not
just its network stack.
The toolkit provided by the BPF compiler collection (BCC) provides us an
accessible wealth of observability tools.
It also provides the means to write your own tools.
15. `perf` tool
Allows you to monitor for specific OS events to trace/analyse
● counters- number of occurances that something happens
● tracing- real time tracking of events (usually syscalls)
● probing- monitor and capture specific events on the server
● reporting- analyse captured data
16. `perf stat`
Example of counters:
perf stat -e 'syscalls:sys_enter_*' COMMAND
(lists the count of system calls for COMMAND)
Example: let’s see what a `drush status` does to our system:
sudo perf stat -e 'syscalls:sys_enter_*' drush status 2>&1 | grep -v ' 0 '
Why does this matter? A certain module or feature may be badly performing,
and now you can find out why.
17. `perf trace`
● Say hello to a more performant replacement to strace!
● System call tracers print what is happening in real time
● Tracing PHP processes can be really useful for troubleshooting performance
problems quickly when you don’t have an APM installed
● perf trace has less overhead than strace, by a LOT
18. `perf trace` overhead
● How do we test that?
● Using dd, we can see that perf trace has a 2.5x slowdown
● Strace had a 62x showdown.
# dd if=/dev/zero of=/dev/null bs=512 count=10000k
5242880000 bytes (5.2 GB) copied, 3.53031 s, 1.5 GB/s
# perf stat -e 'syscalls:sys_enter_*' dd if=/dev/zero of=/dev/null bs=512 count=10000k
5242880000 bytes (5.2 GB) copied, 9.14225 s, 573 MB/s
# strace -c dd if=/dev/zero of=/dev/null bs=512 count=10000k
5242880000 bytes (5.2 GB) copied, 218.915 s, 23.9 MB/s
19. perf trace
You can see all syscalls on the system with `perf trace`!
For a single process, run `perf trace -p <PID>` or `perf trace <COMMAND>`
20. `perf record`
● You can sample all CPU activity on the system:
● perf record -a -F 1000 sleep 10
○ Record activity on all processors, 1000 times per second, for 10 seconds
● Then you can generate a report on the output data
● perf report
Note that you need to install debug packages in order to drill down into specific
library calls! (PKG-dbg, or PKG-dbgsym)
21. `perf top`
● Like the top command, but for kernel-level events
● Plain `perf top` will tell you what userspace and kernel functions are using the
most resources
● What is generating network traffic on the server?
● perf top -e net:net_dev_xmit -ns comm,pid
22. Dynamic Tracing with `perf probe`
This allows you to monitor for invokation of specific kernel functions.
● create a probe: perf probe --add <FUNCTION>
● record probe behavior: perf record -e probe:<FUNCTION> -aR sleep 1
● list probes: perf probe -l
● delete probes: perf probe -d <EVENT>
You probably won’t use these when getting started, but know that this exists.
23. Trace HTTP Outbound Connections in Real Time
Use tcpconnect to detect external calls performed by Drupal,
cronjobs, etc. Could also help in detecting intruders!
# tcpconnect
PID COMM IP SADDR DADDR DPORT
1957 php-fpm 4 192.168.122.229 143.204.214.36 80
24. Trace HTTP Requests in Real Time
Use tcptracer to detect all TCP connections on your server.
A very easy way to find abusive or high-throughput HTTP
clients as they happen!
25. How long do your HTTP client connections last?
tcplife prints out the latency and data transfers for each
connection, which again can be useful for analysing what
your clients are doing.
26. Trace File Accesses On Web Server
Use statsnoop to detect all file information accesses on
your server (stat family of syscalls)
# statsnoop | grep sites/default/files | egrep 'jpg|png|pdf|mp4'
PID COMM IP SADDR DADDR DPORT
1957 php-fpm 4 192.168.122.229 143.204.214.36 80
27. Monitor file reads and writes!
Use filetop to find how which specific files are getting the
most activity!
28. How large are your per-process I/O operations?
bitesize prints histograms of storage I/O operations for
each process. May be useful to find programs that are doing
excessive or inefficient operations.
29. How Long Does it Take For Filesystem Operations?
ext4dist, xfsdist, zfsdist, etc will generate histograms of
how long it takes to perform reads and write operations on
the filesystem.
This really breaks down the performance characteristics of
the filesystem beyond what iostat will tell you.
30. Find out if you need more memory!
More operating system theory:
A ‘page fault’ means that a access to data required reading
from the disk rather than what was in the page cache (stored
in RAM).
This is particularly important on servers expected to serve
a lot of file data, eg: a file server. Too little memory for
page cache affects performance.
This is in a way similar to nginx or varnish miss rates.
The cachestat tool enables you to monitor for this
condition. The dcstat tool is useful for directory cache.
31. Trace Creation of New Processes
Use pidpersec to determine the rate of new process creation.
High values may be revealing that something is wrong with
custom code such as cronjobs or scripts on the server.
32. Trace Creation of New Processes
Use execsnoop to detect all new processes on your server.
Quite useful for following up after use of pidpersec.
# execsnoop-bpfcc
PCOMM PID PPID RET ARGS
date 2647 2499 0 /bin/date
sleep 2648 2499 0 /bin/sleep 1
date 2649 2499 0 /bin/date
sleep 2650 2499 0 /bin/sleep 1
33. Spy On a User Session!
Use ttysnoop to watch another person’s shell session!
# to find the ttys in use
ps auxww --forest | egrep --color ‘^|pts’
# then to trace
ttysnoop /dev/pts/X
34. Spy On All User Sessions!
Similarly, you can use bashreadline to see all programs that
have been invoked from a bash shell. Useful for analysing
how jump hosts are being used.
35. Spy On SSL/TLS Connections!
sslsniff will print the data being written to and read from SSL_write() and
SSL_read() functions, basically intercepting encrypted traffic on the server!
36. In Summary
● perf_events and eBPF are pretty awesome additions to your toolkit
● You can see more details on Linux server activity than ever before
● You can start using these tools today :D
● Test in non-production first
● Have fun!