Download to read offline

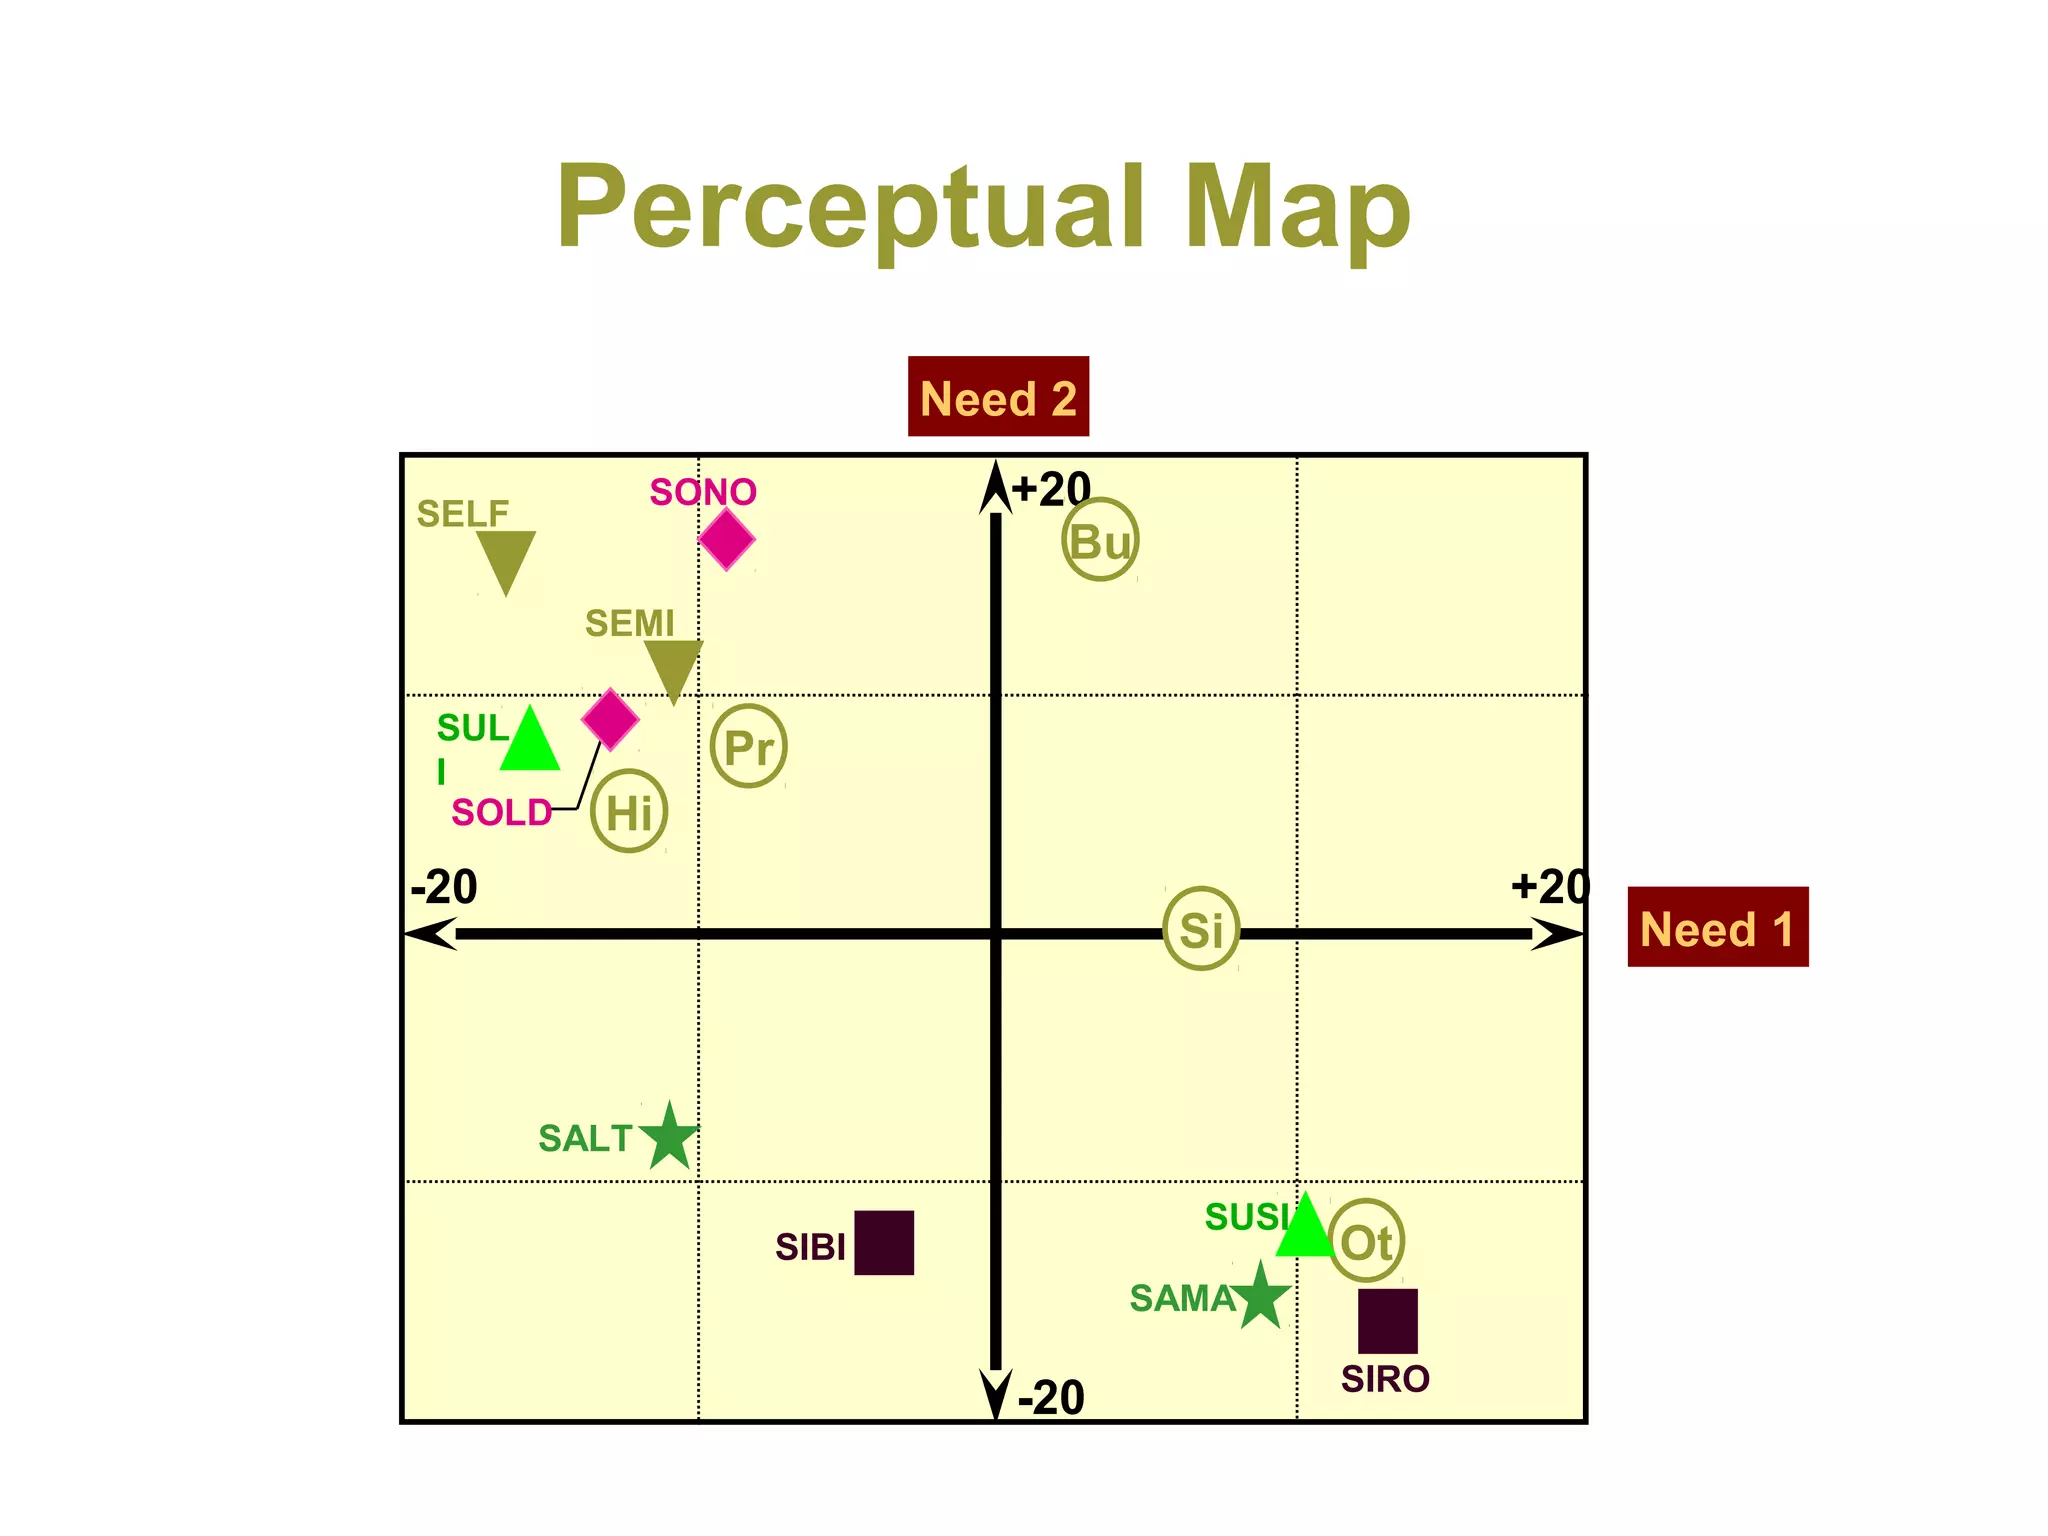
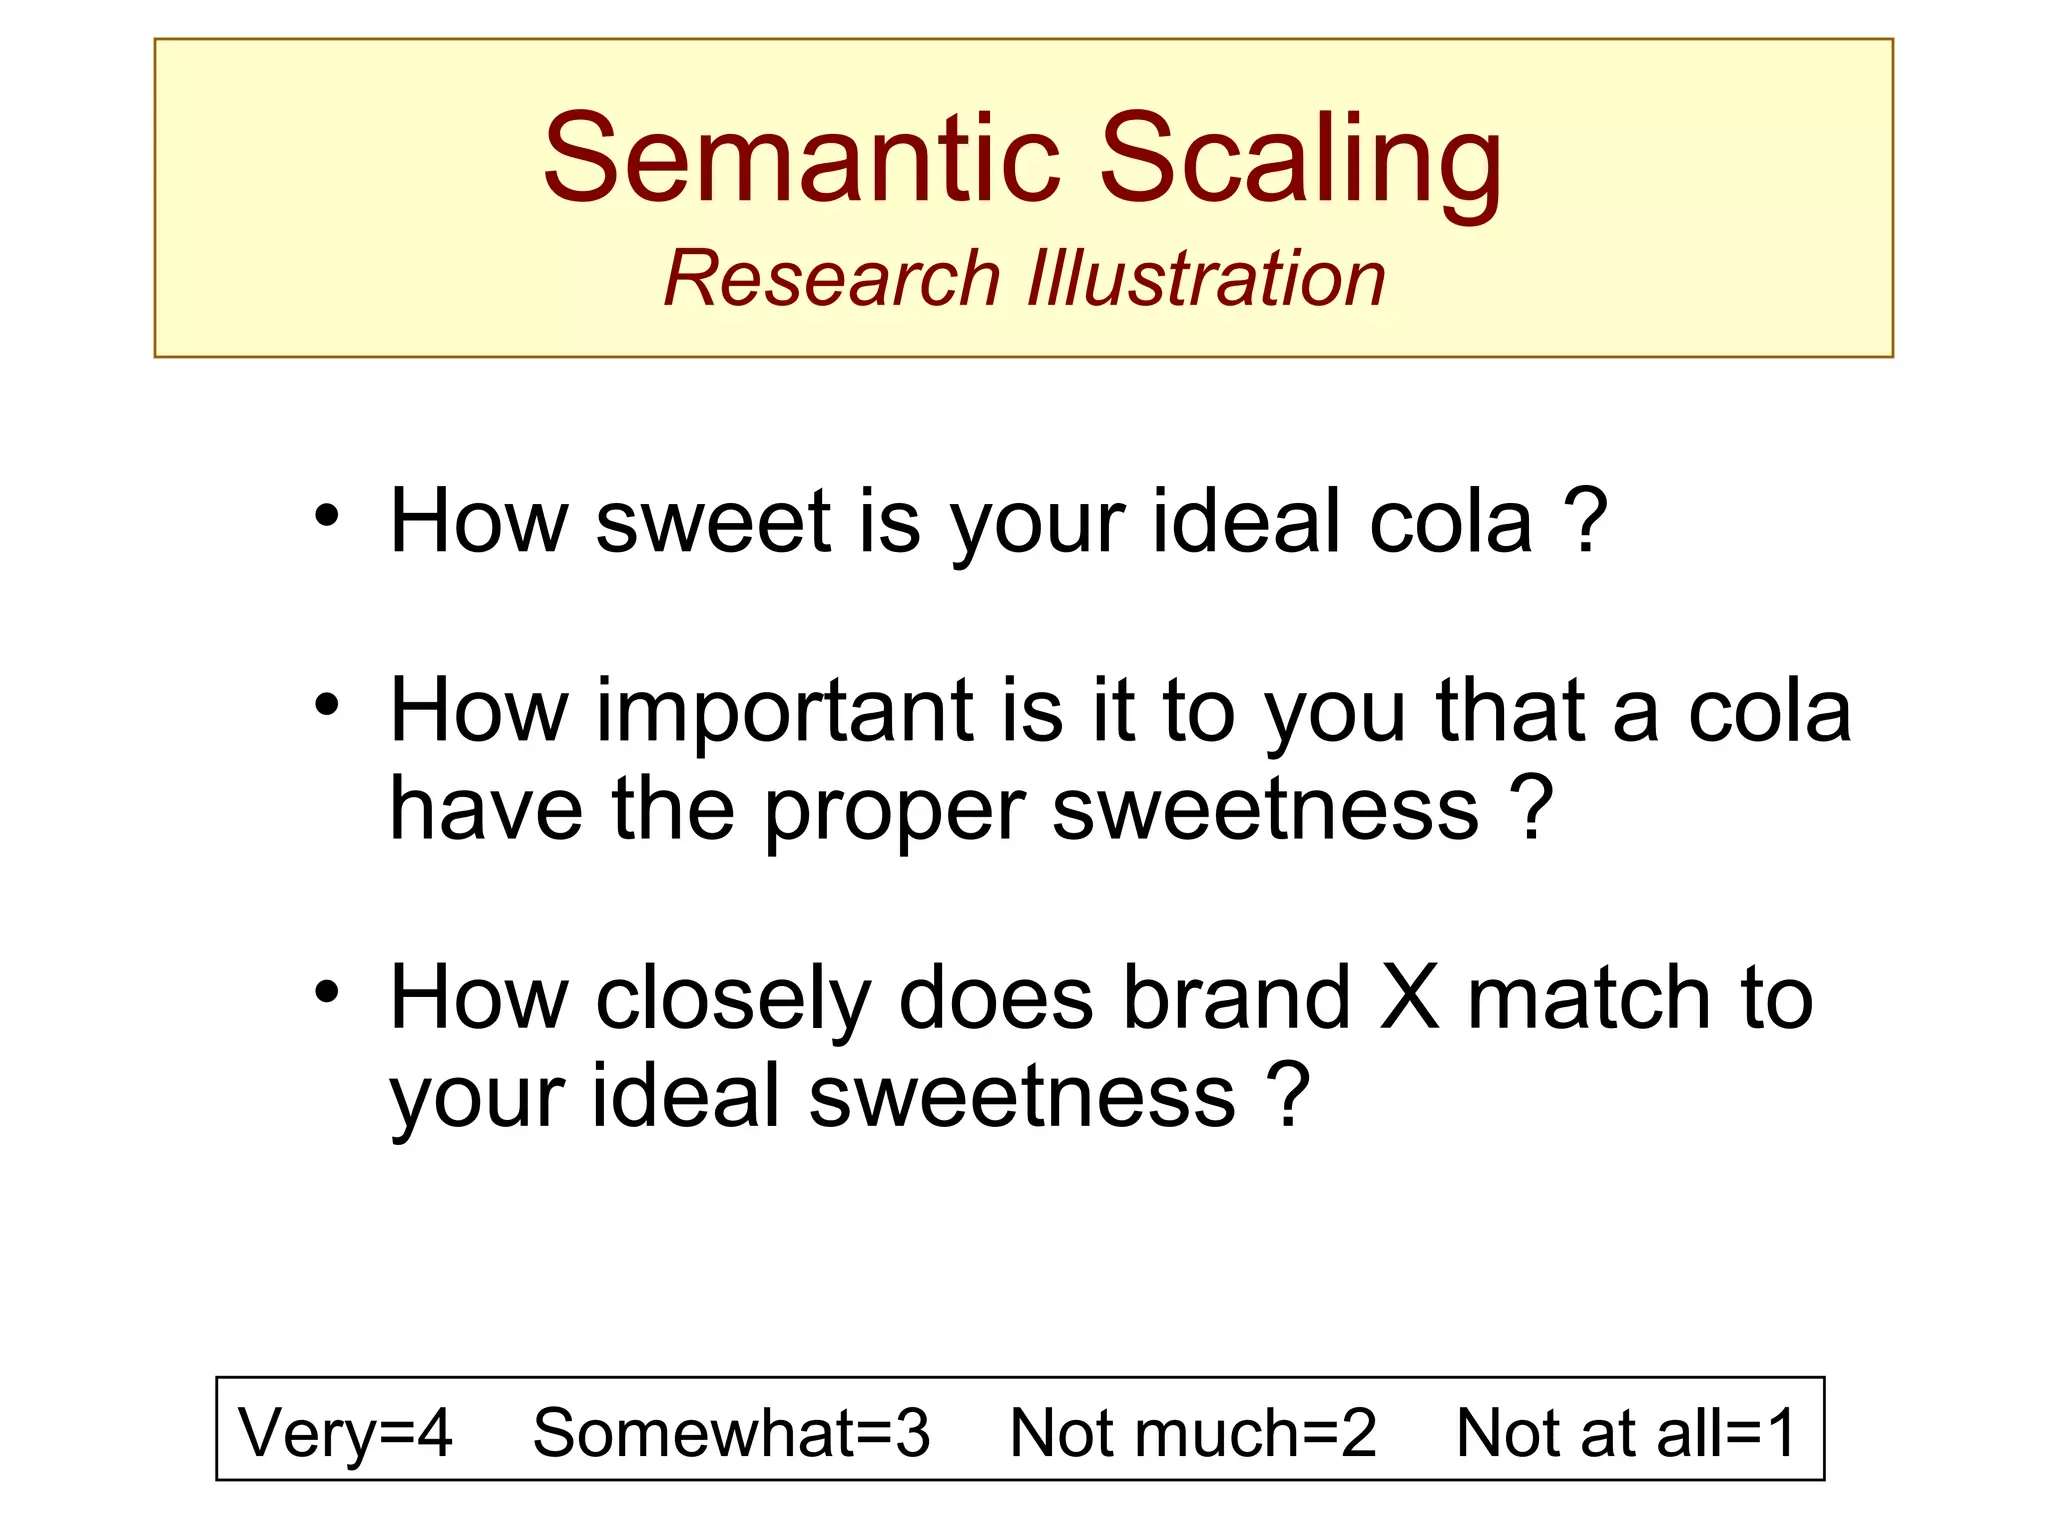
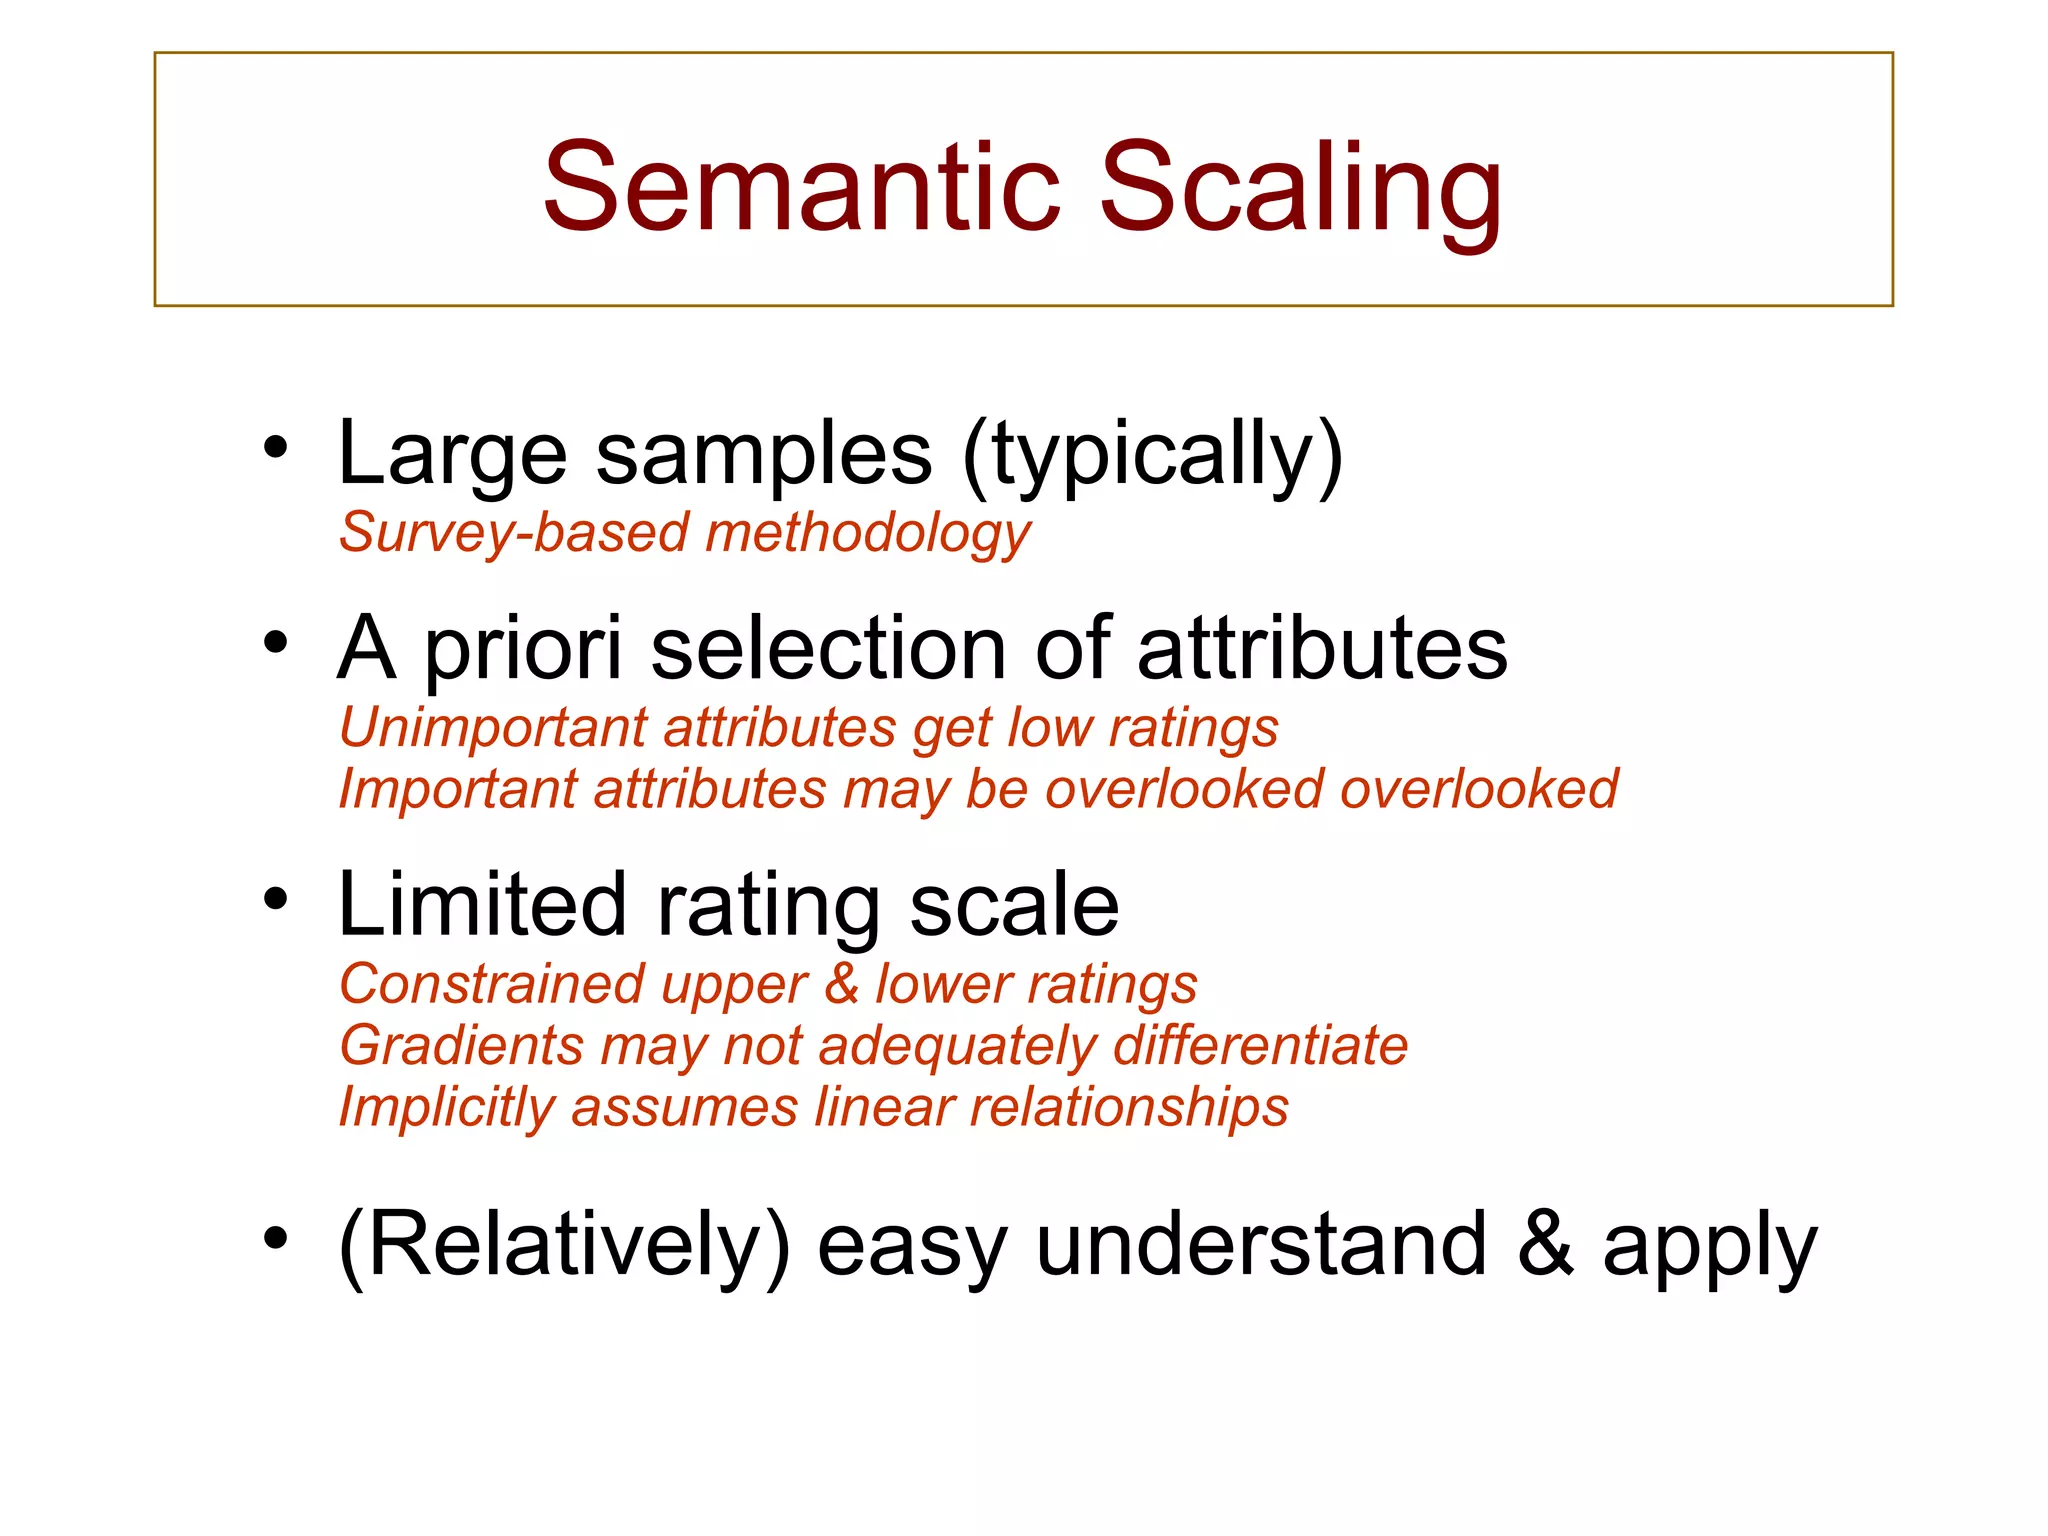
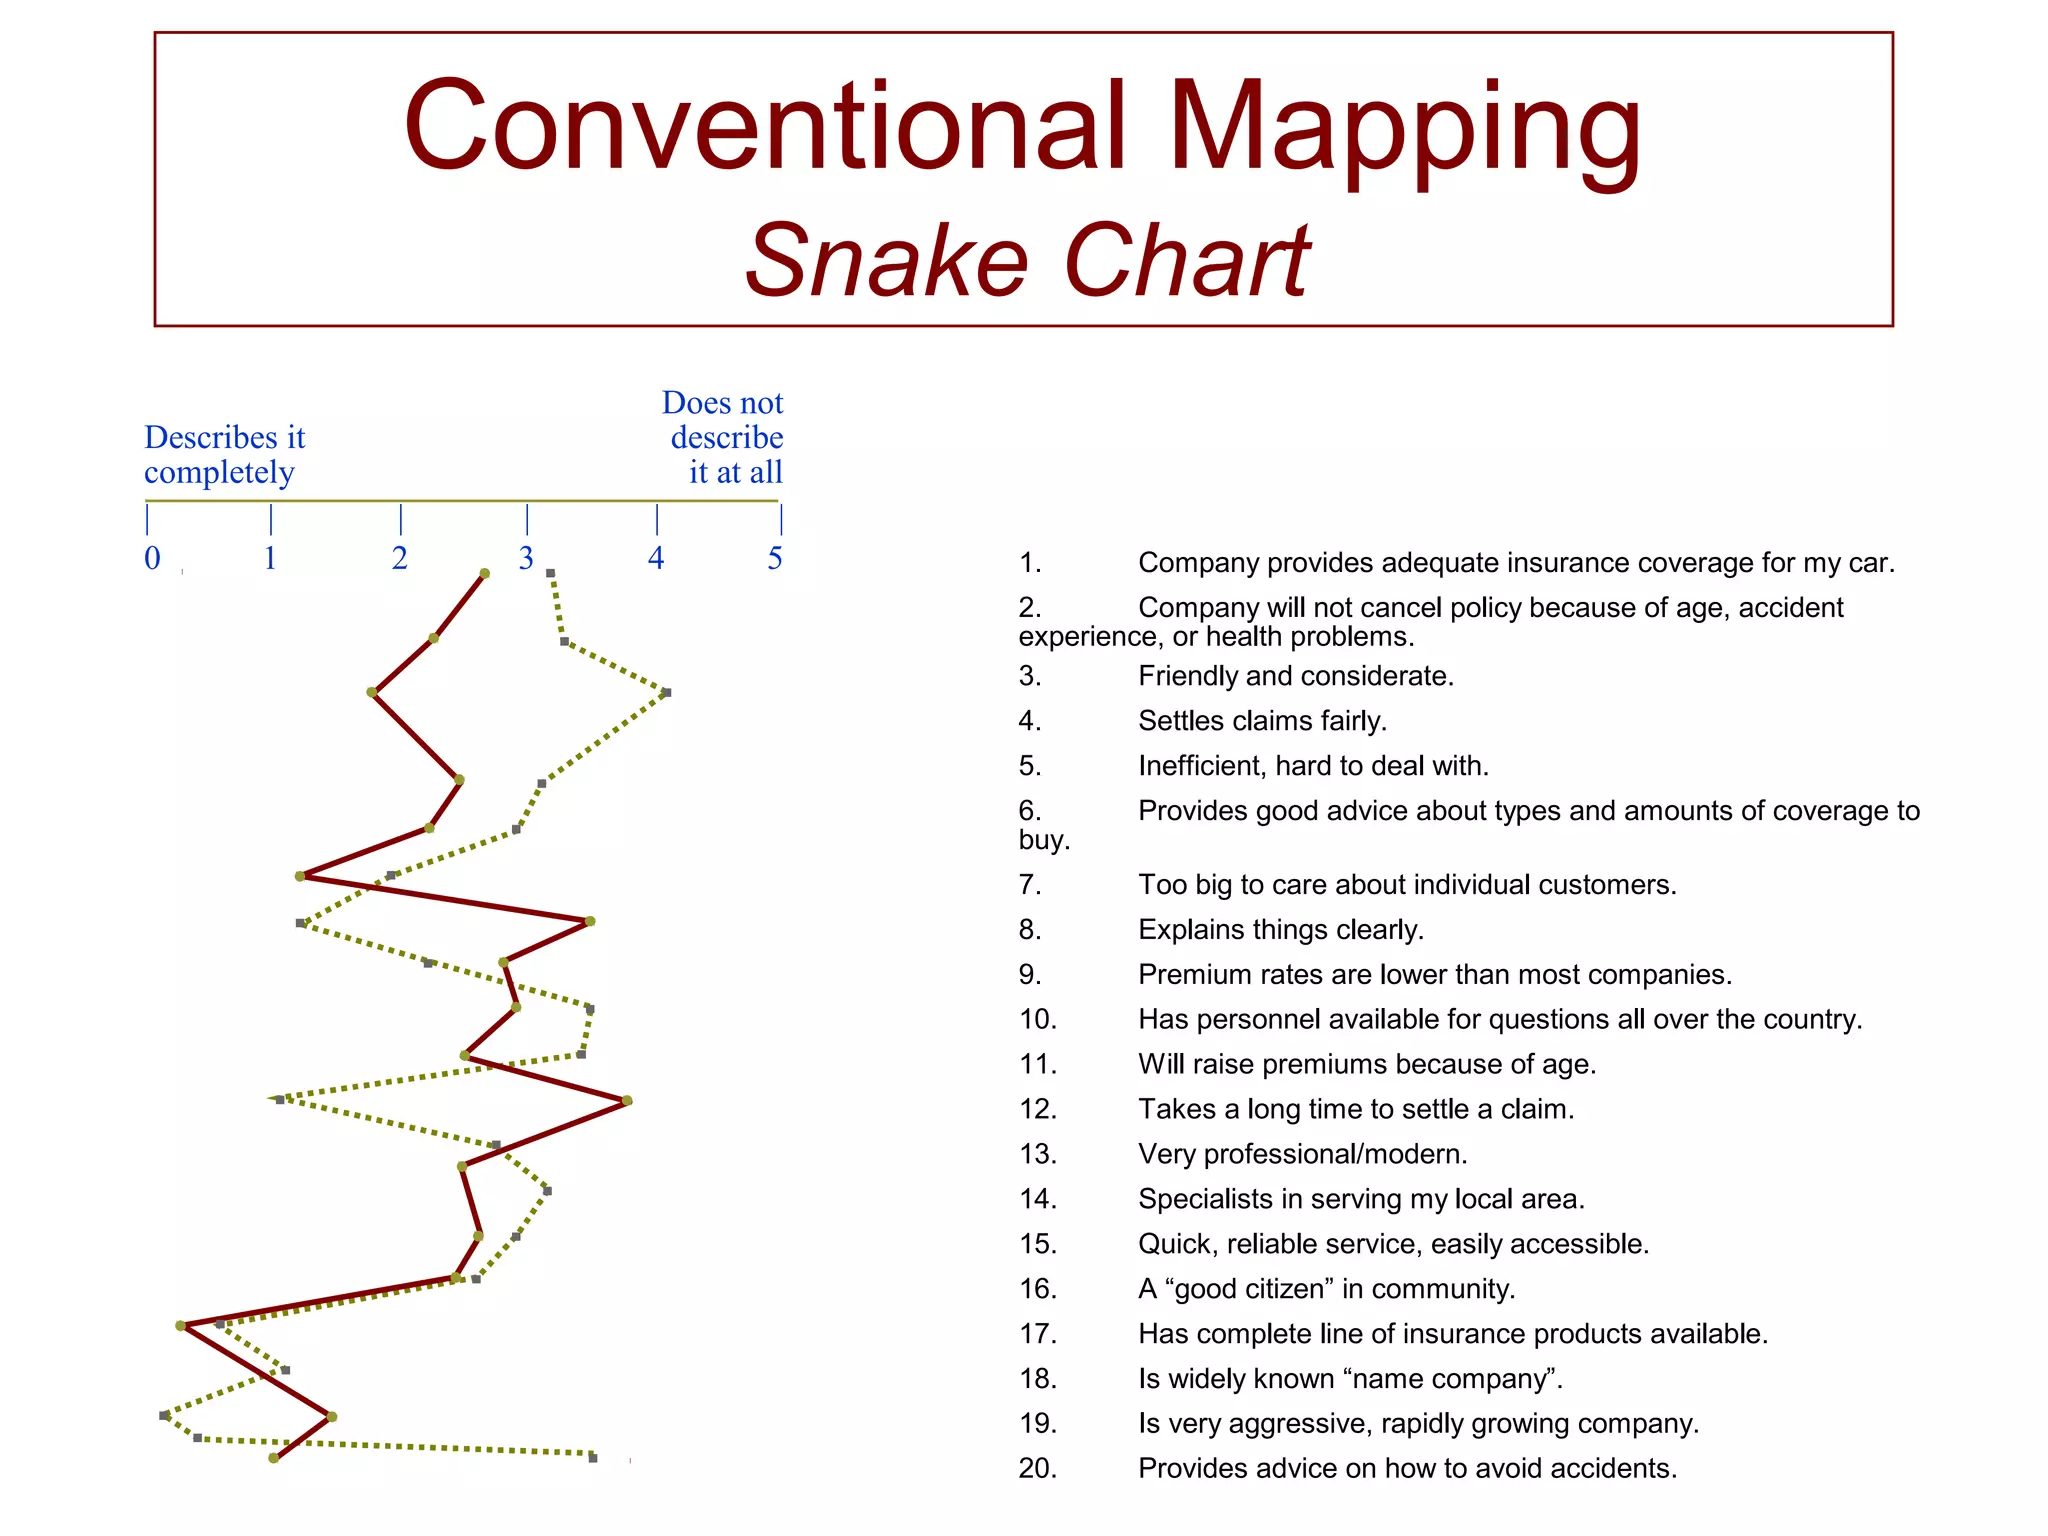
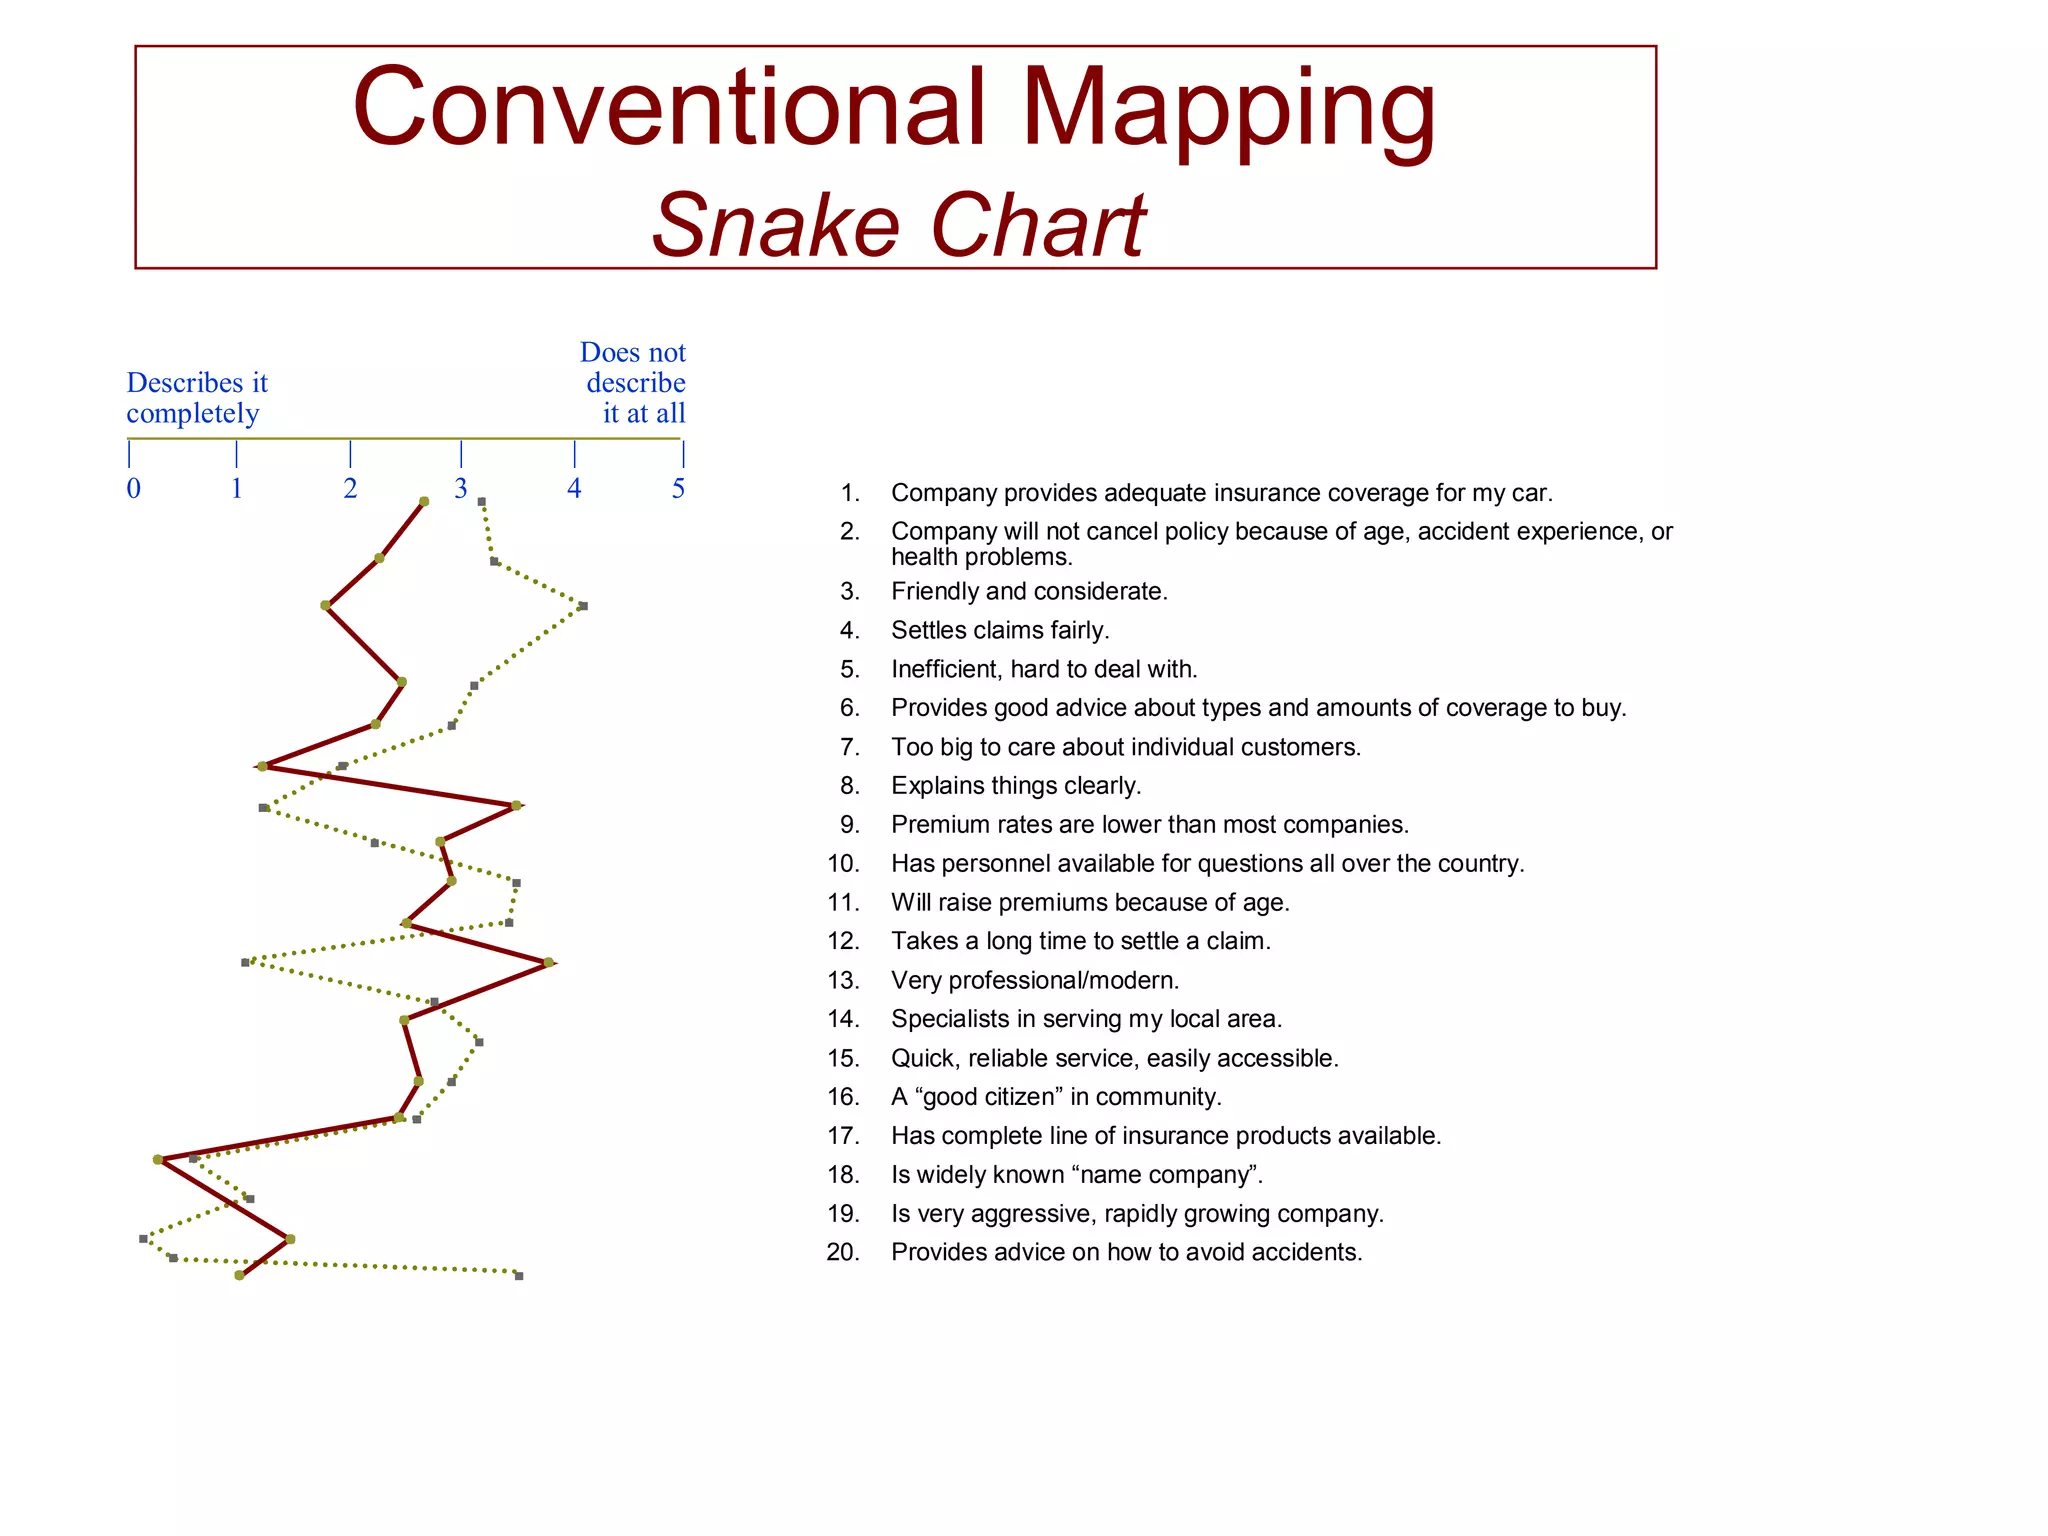
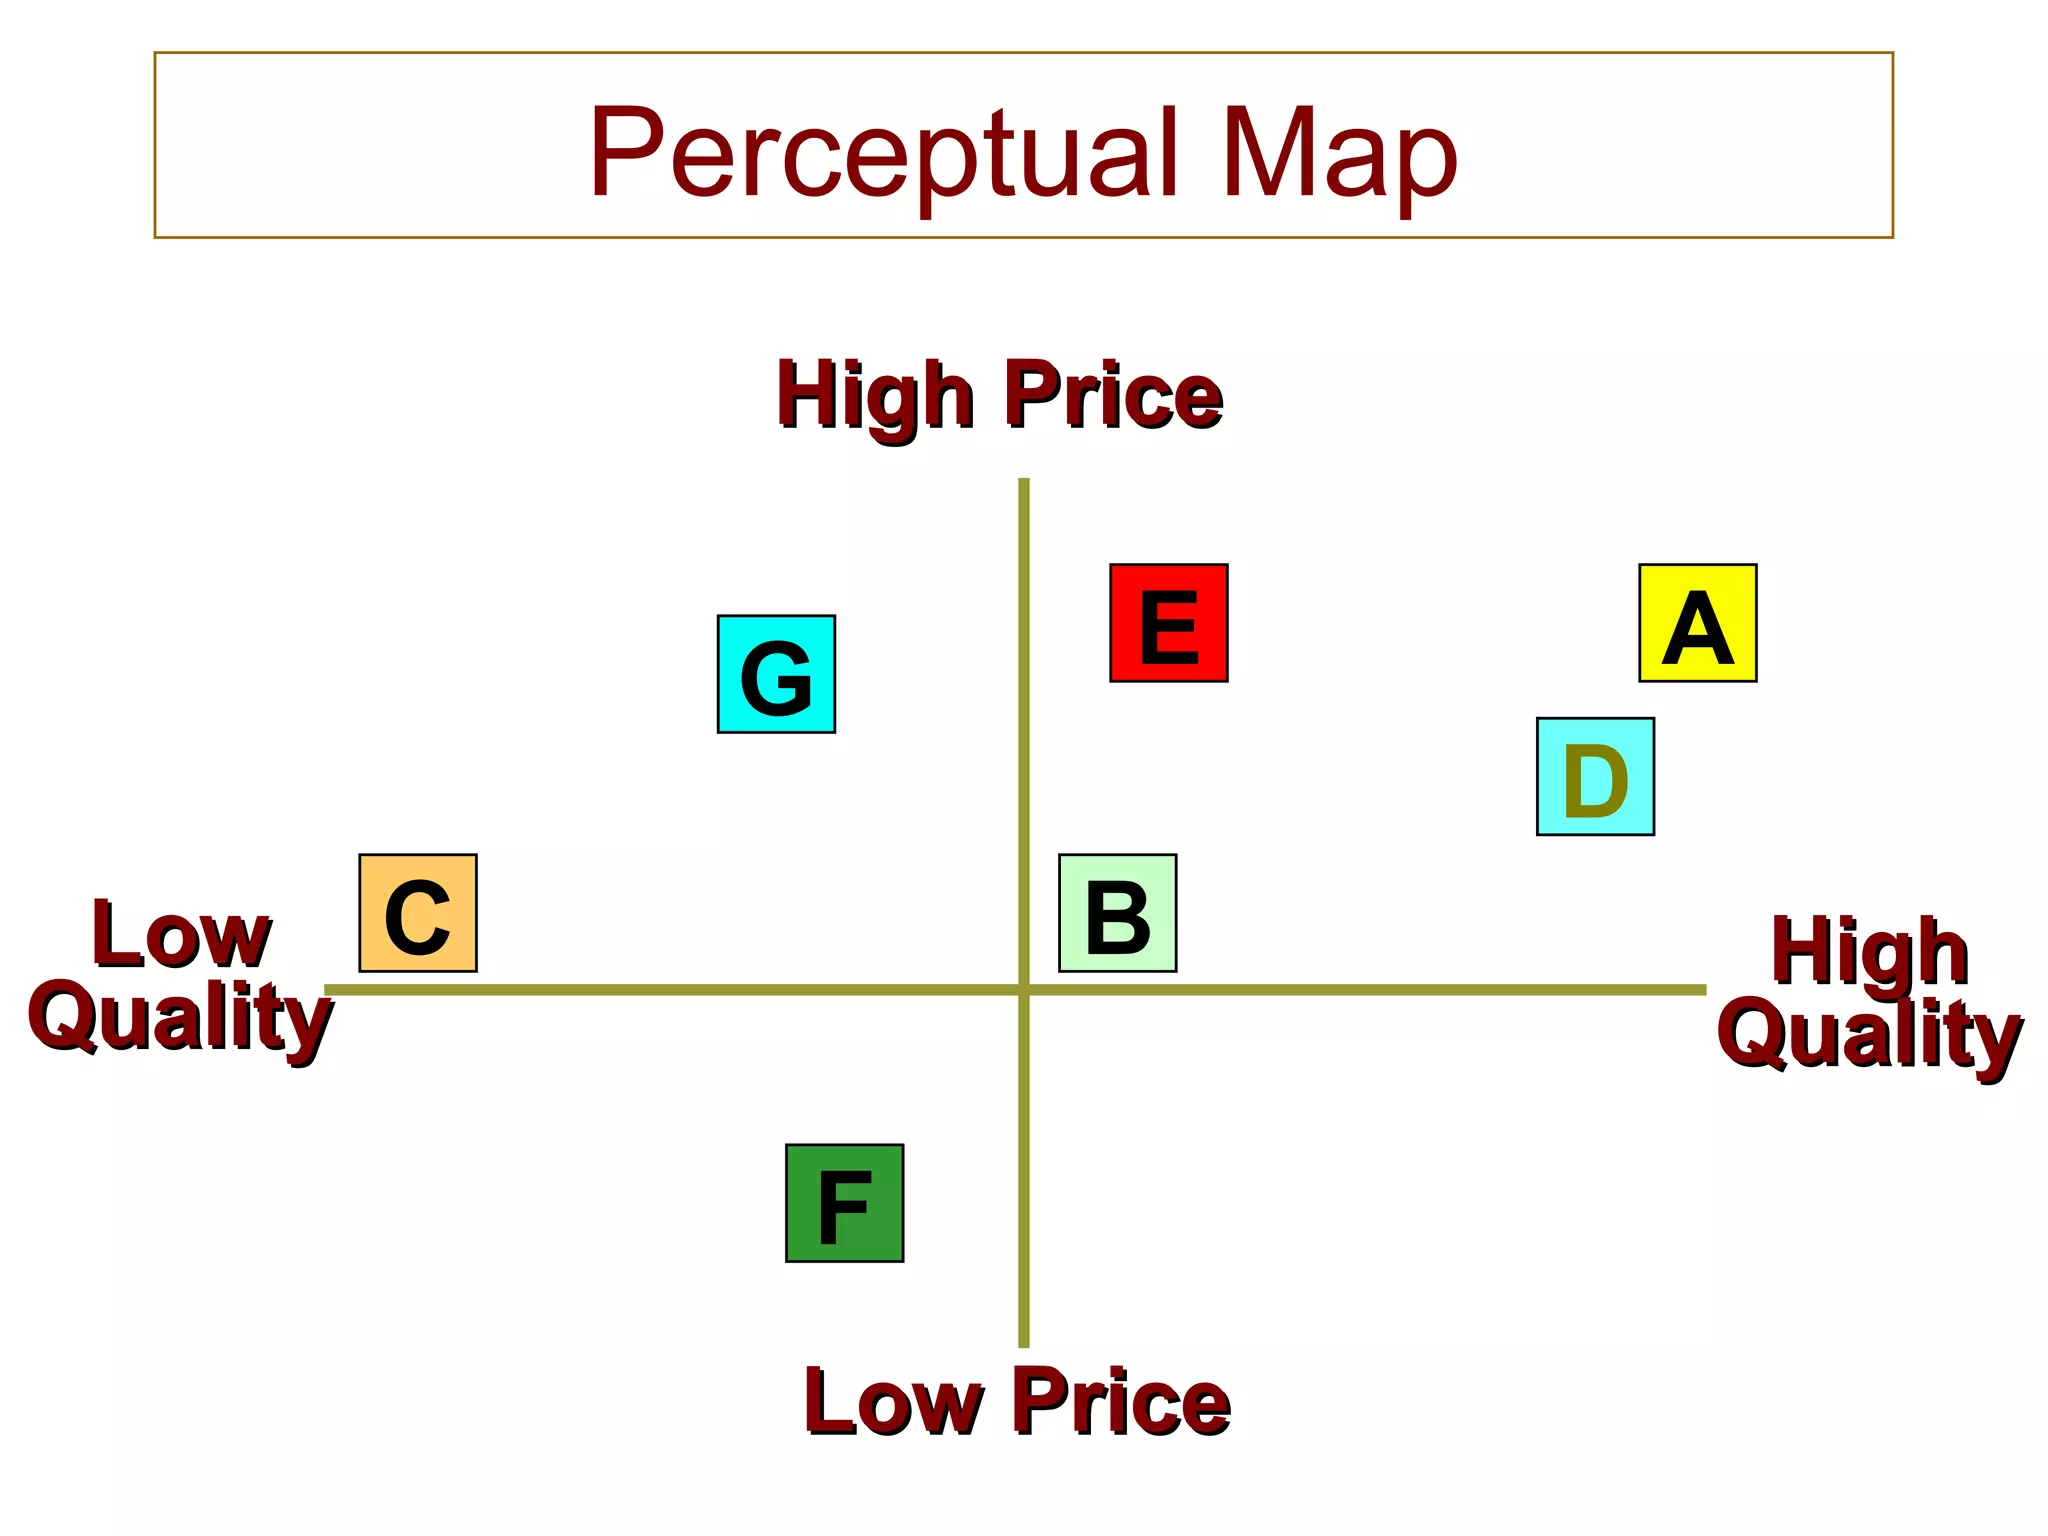
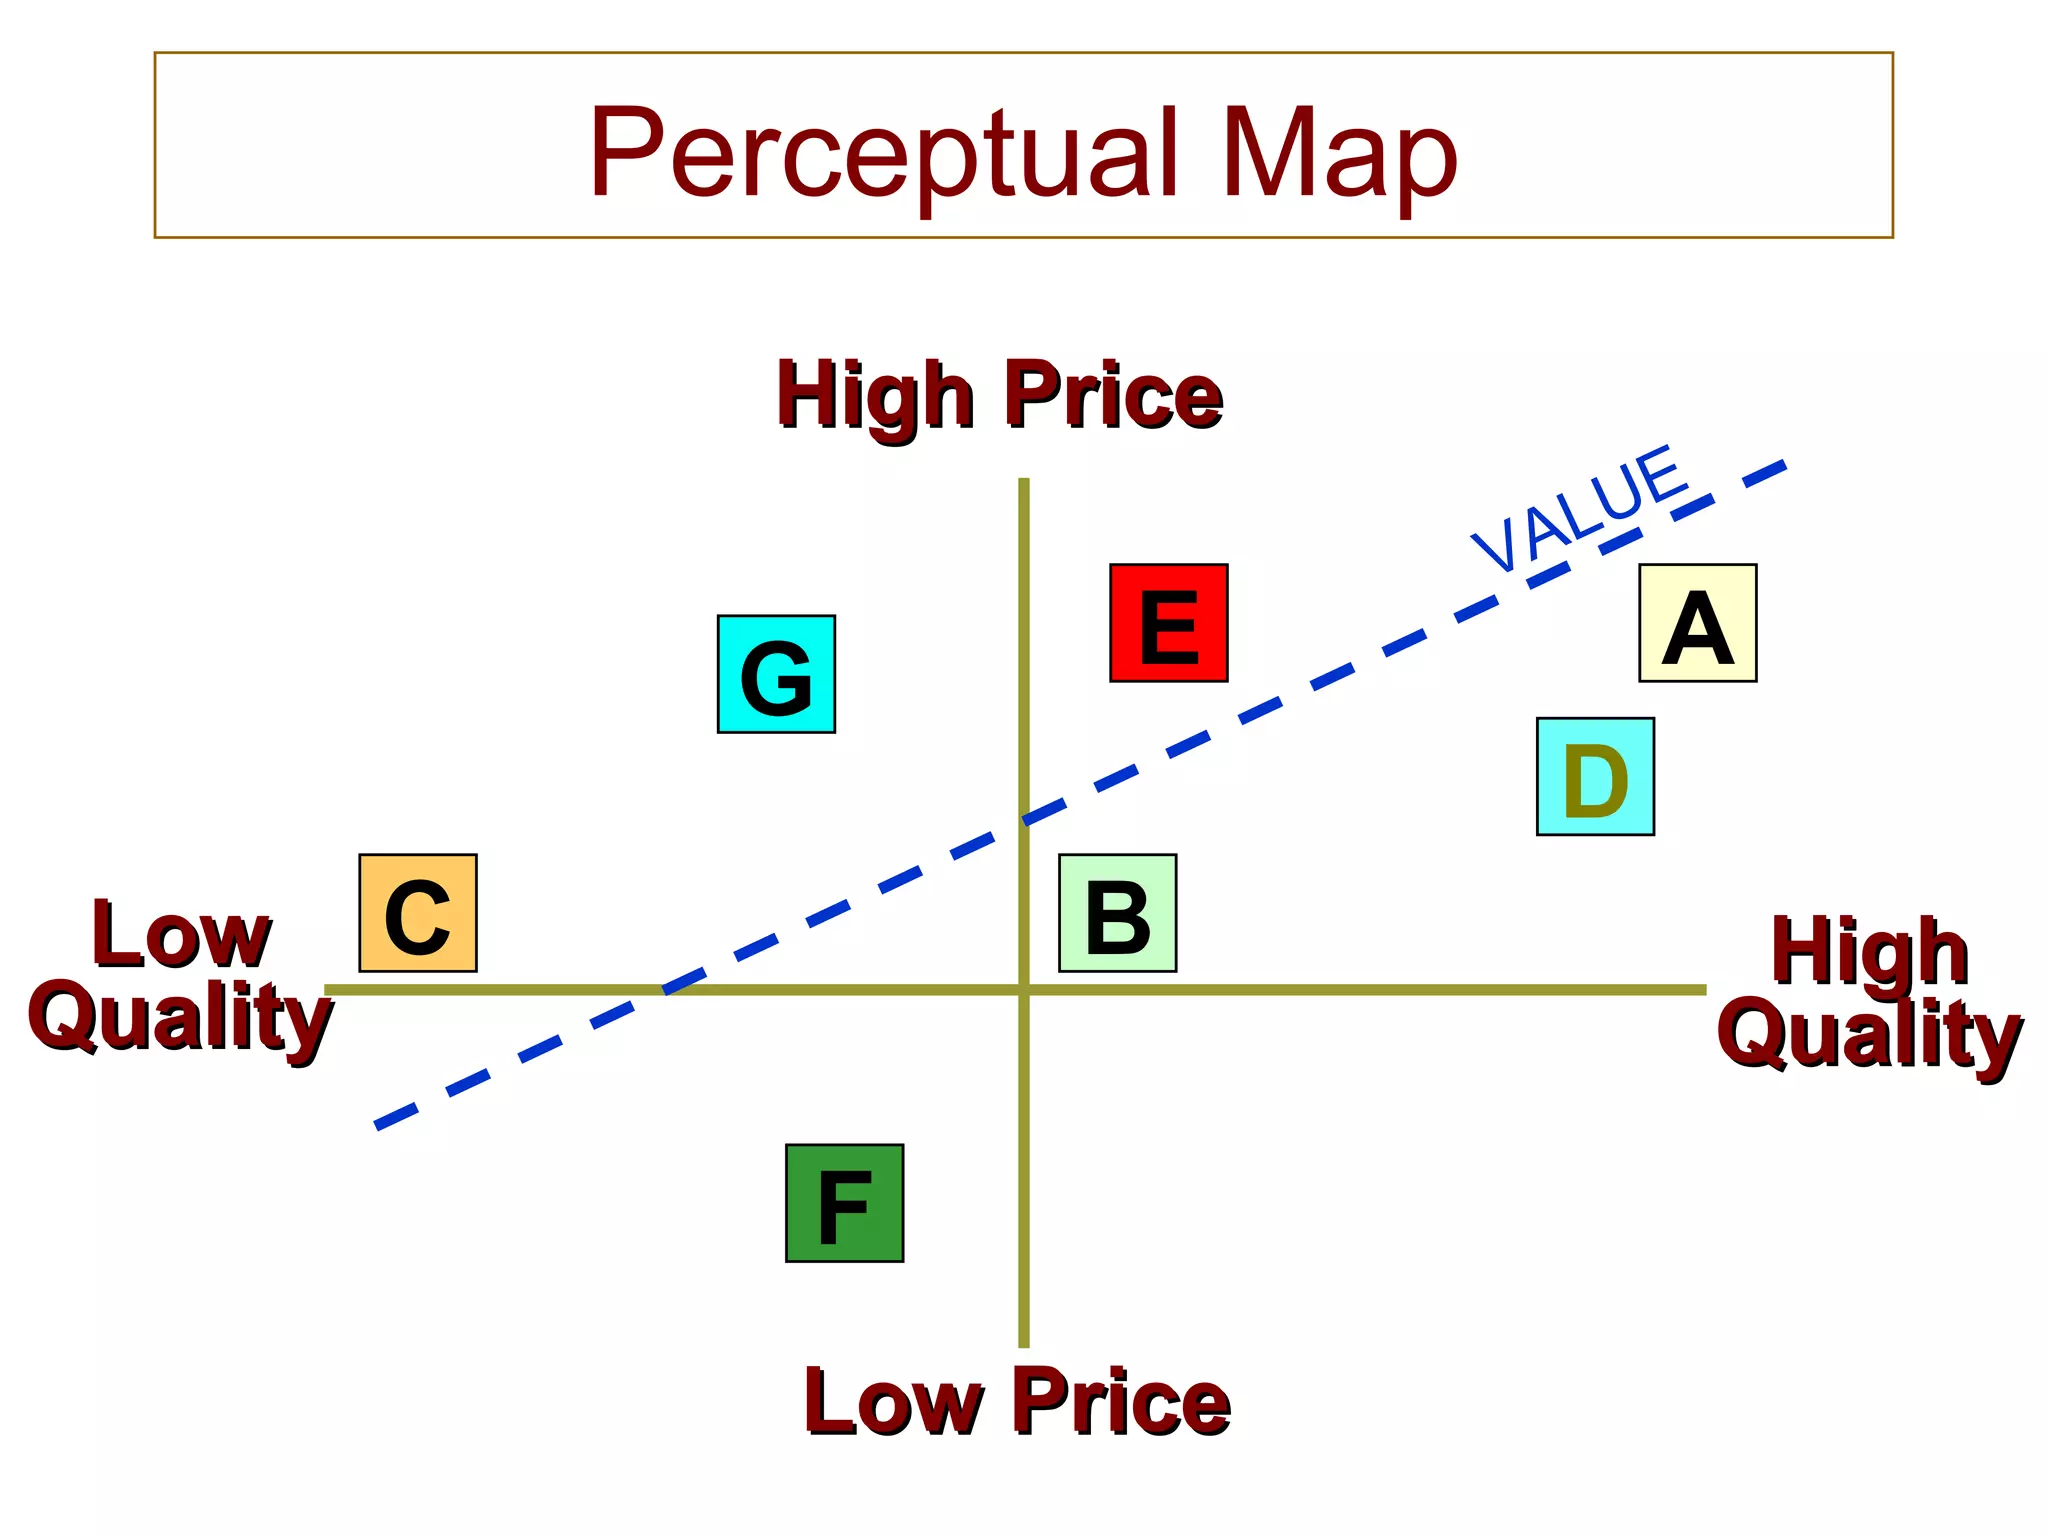
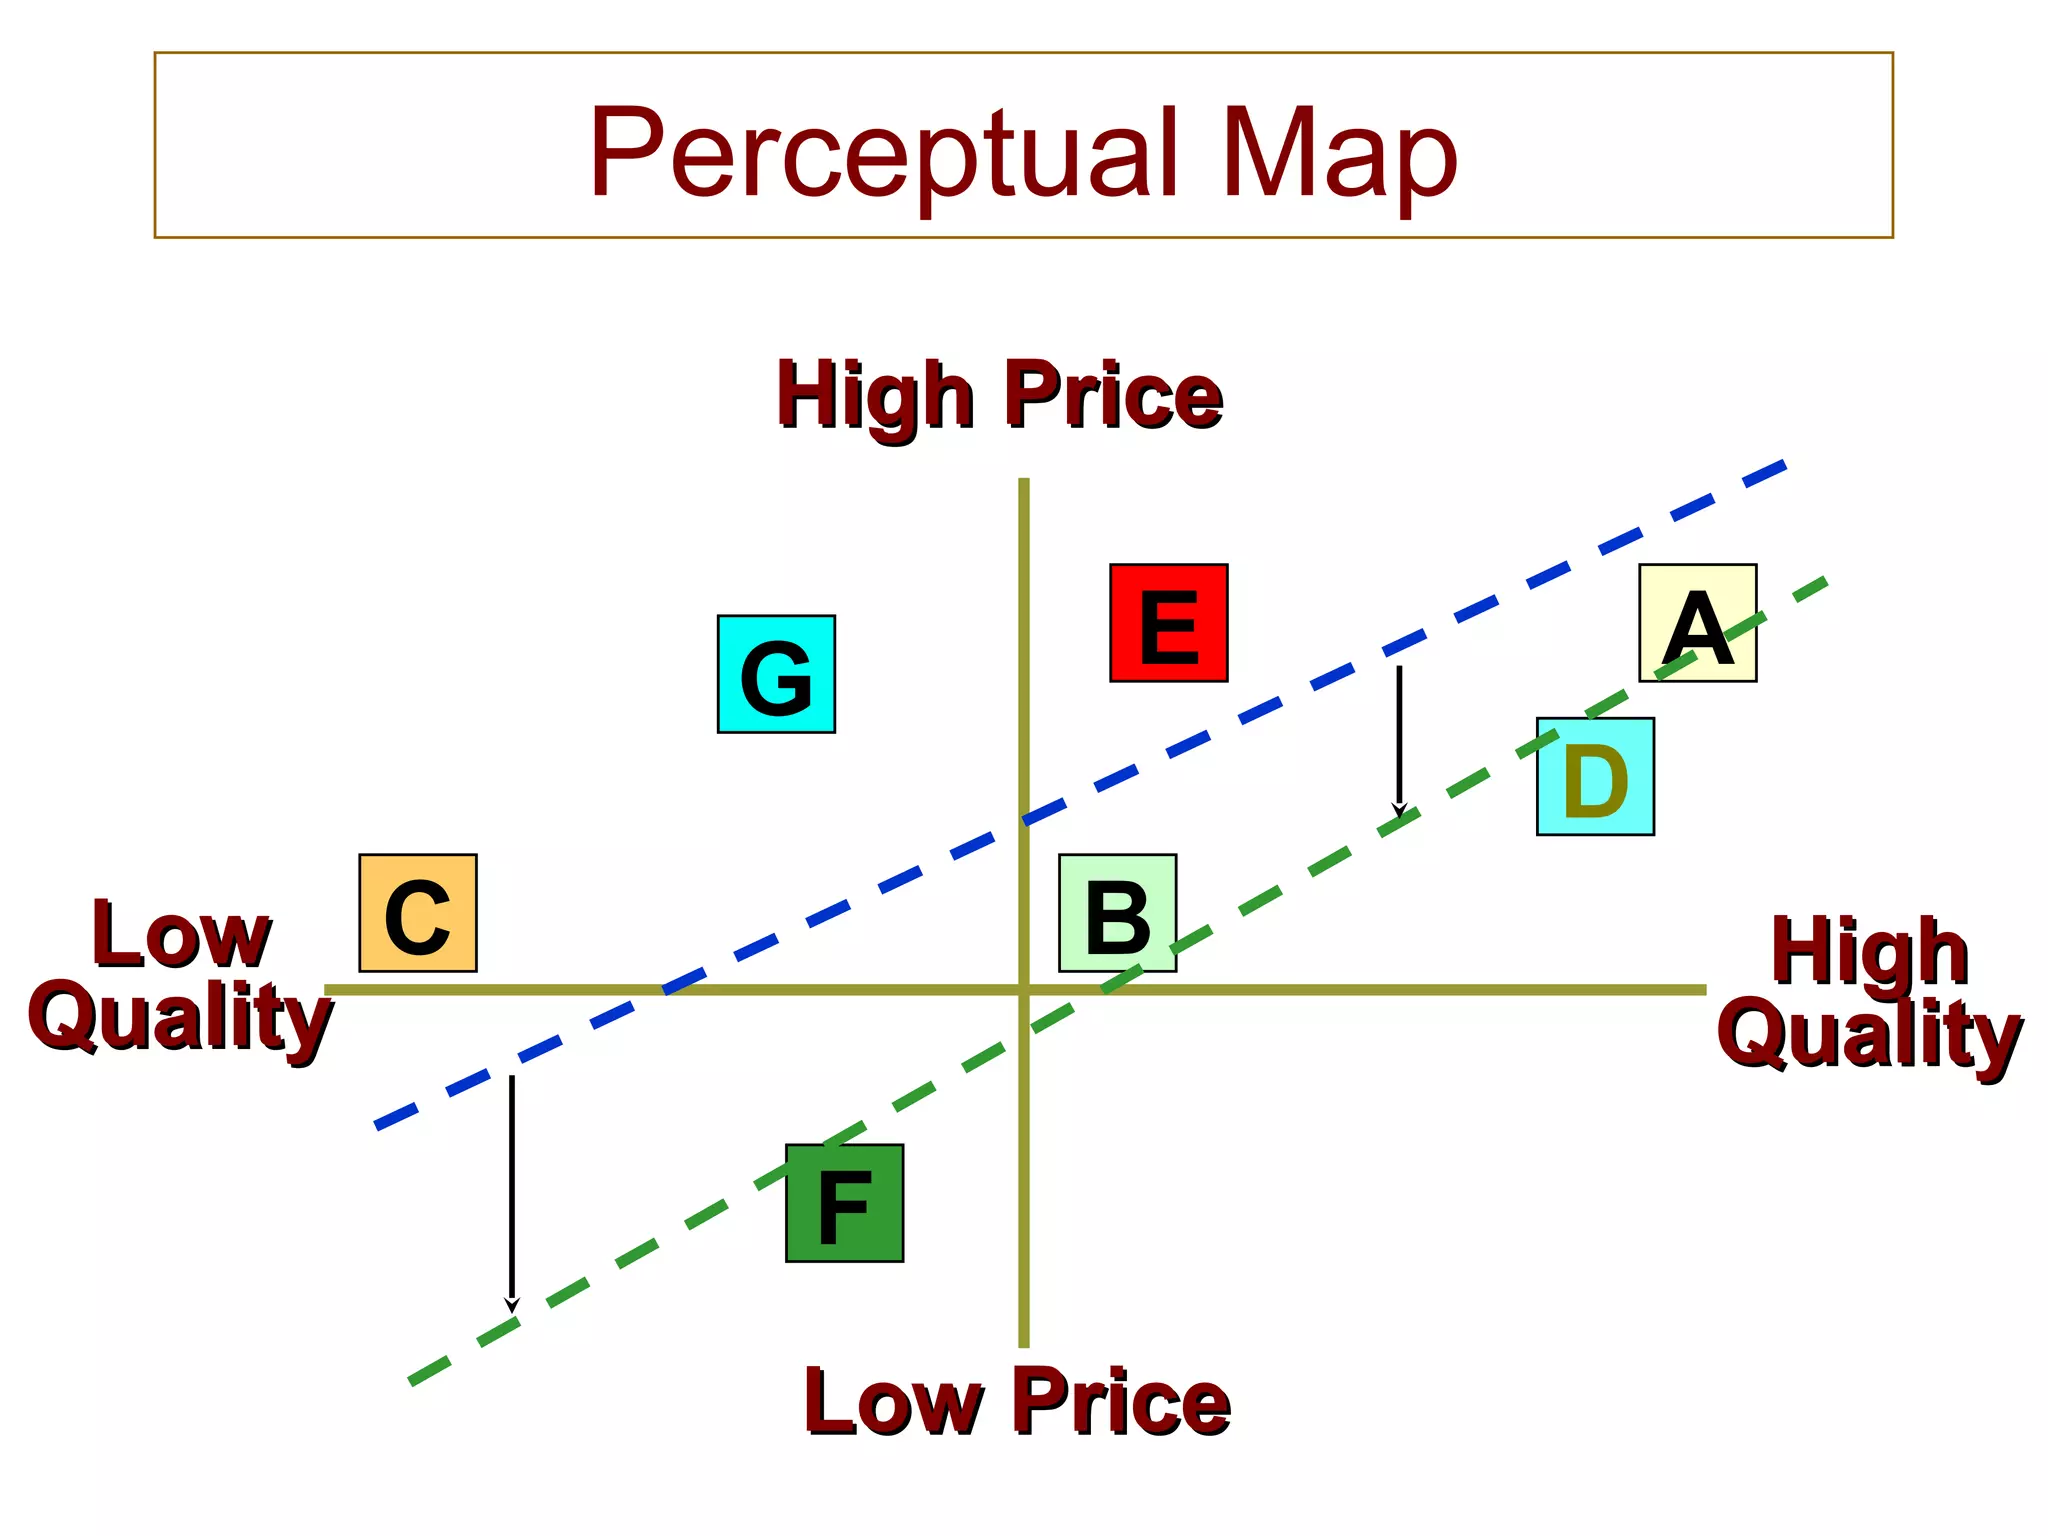
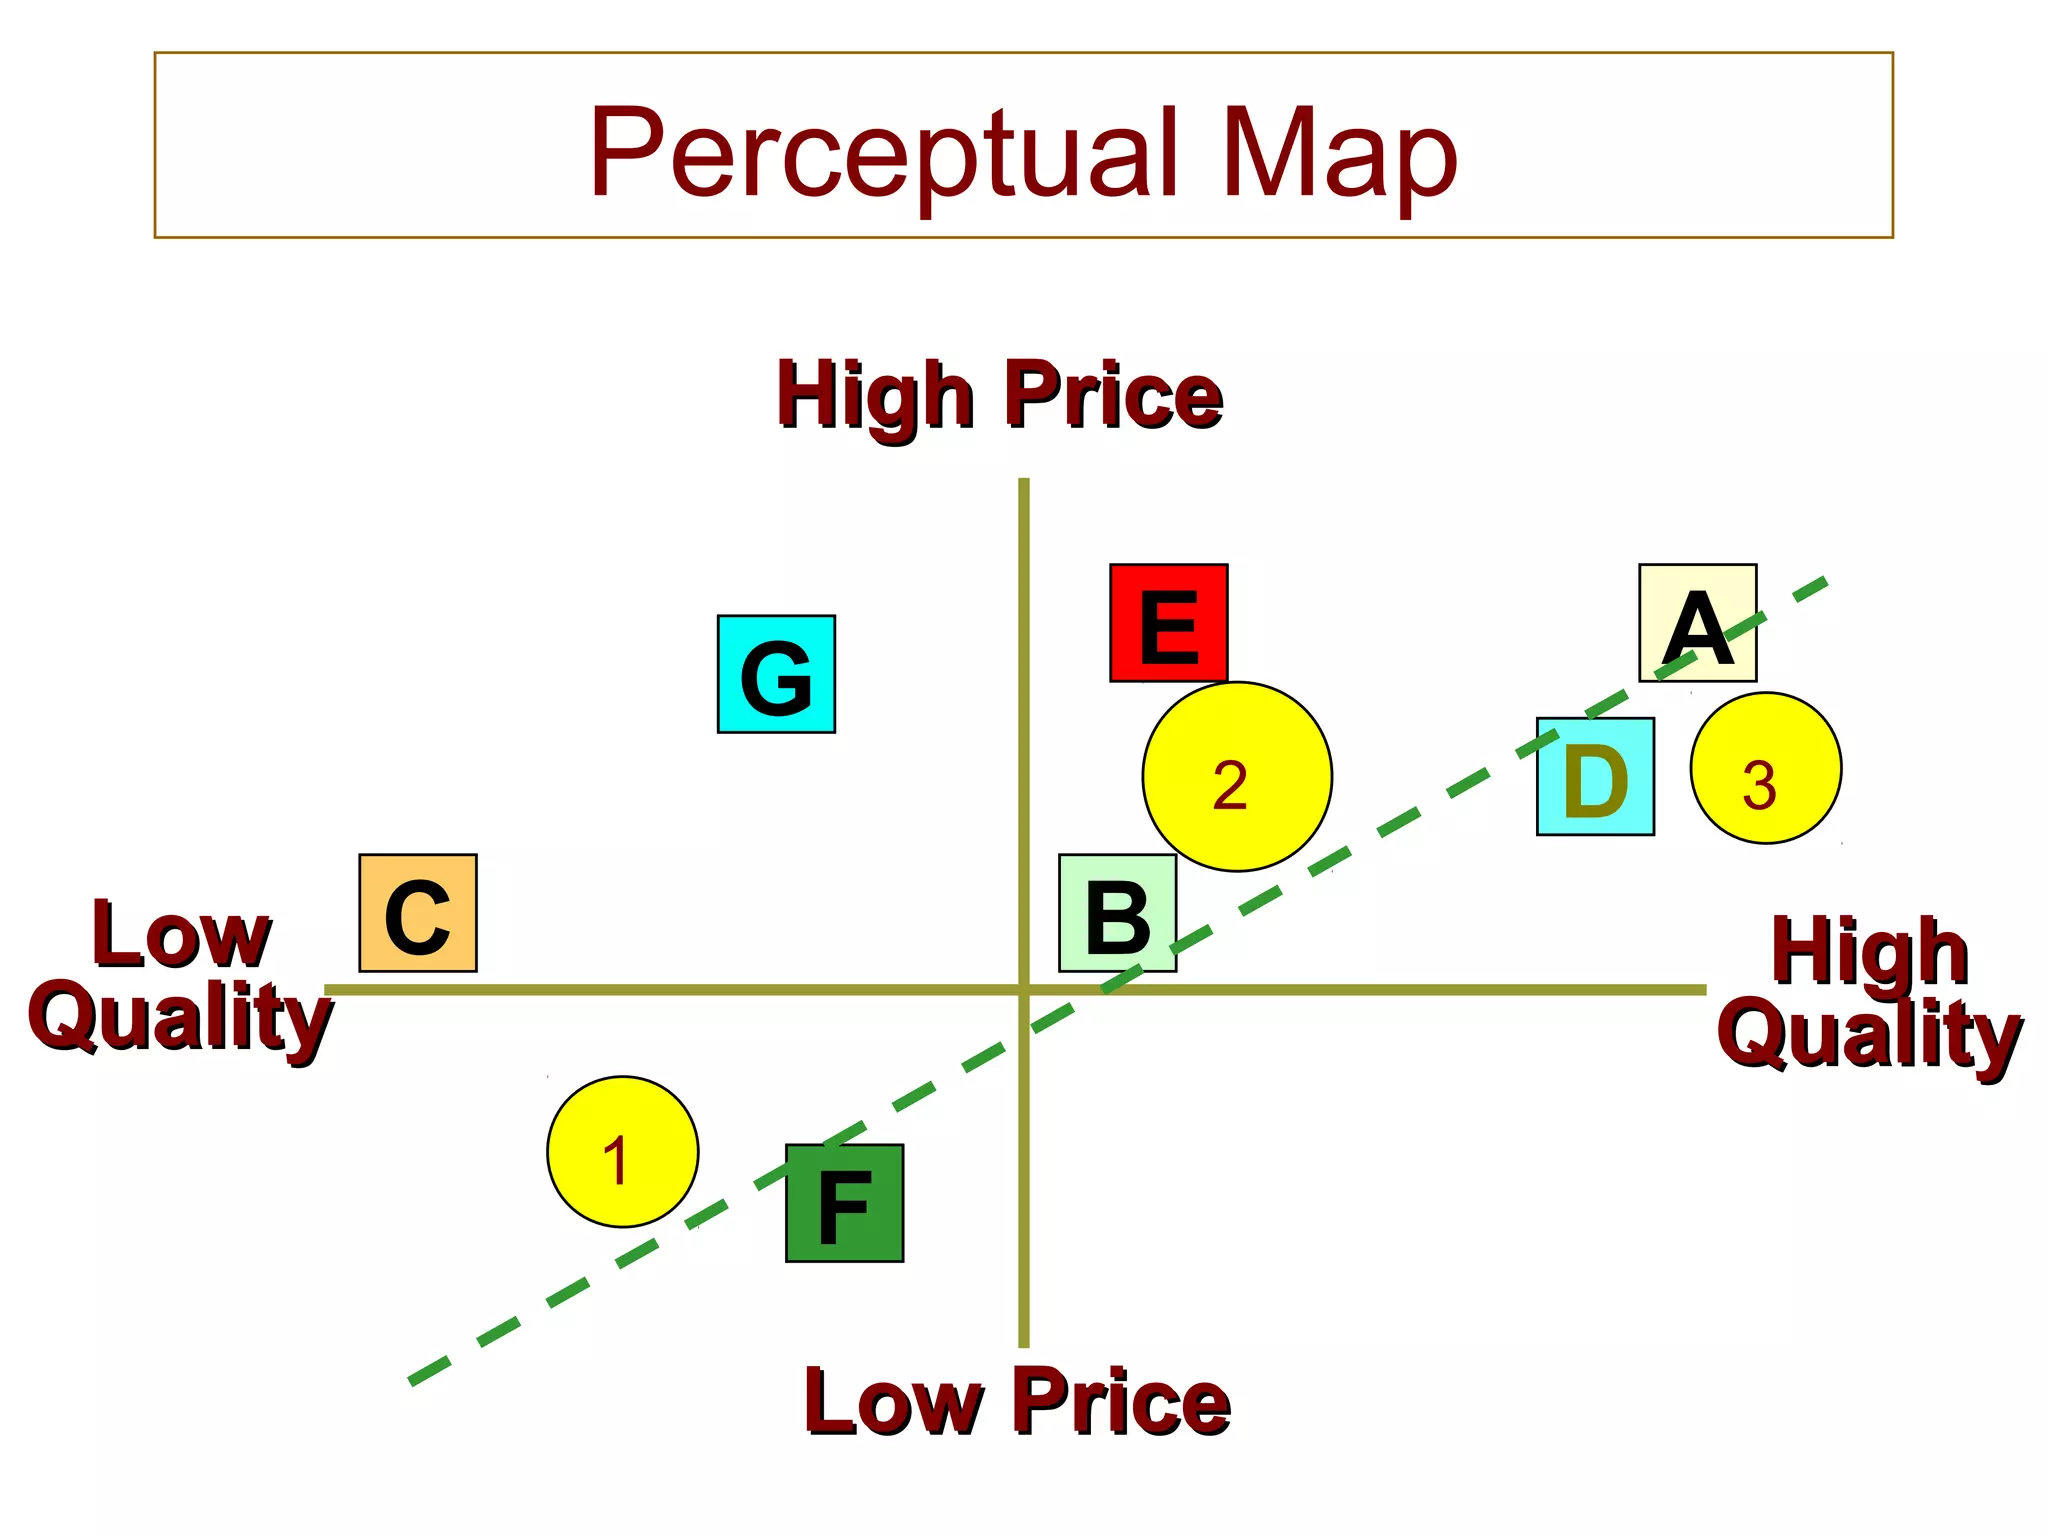

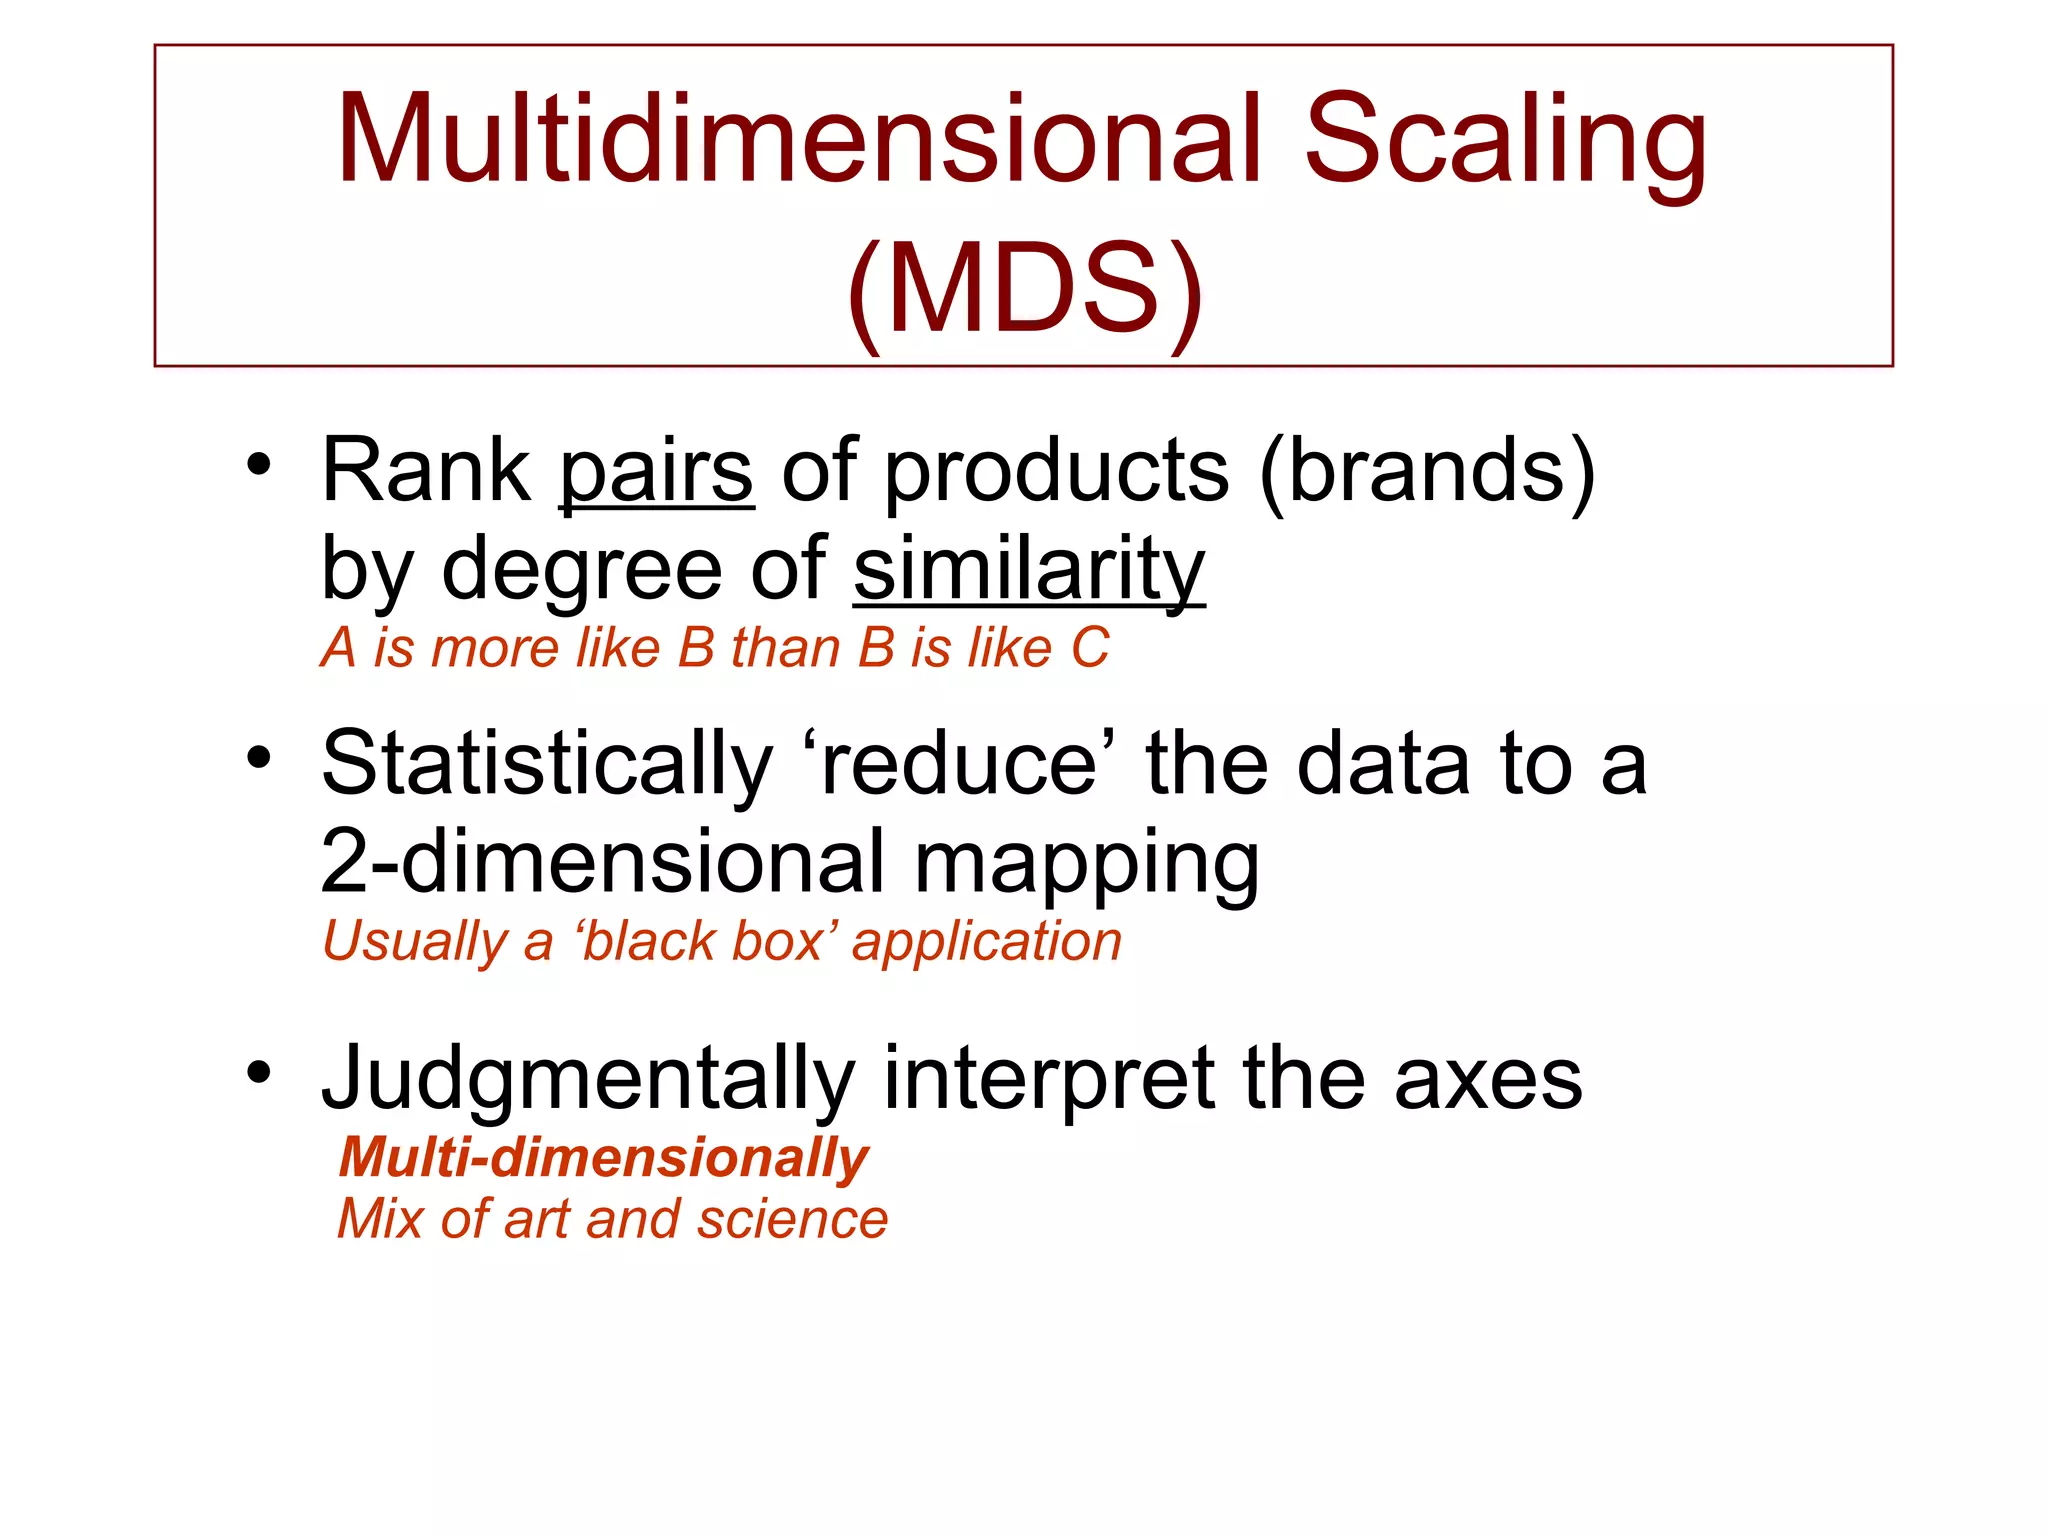
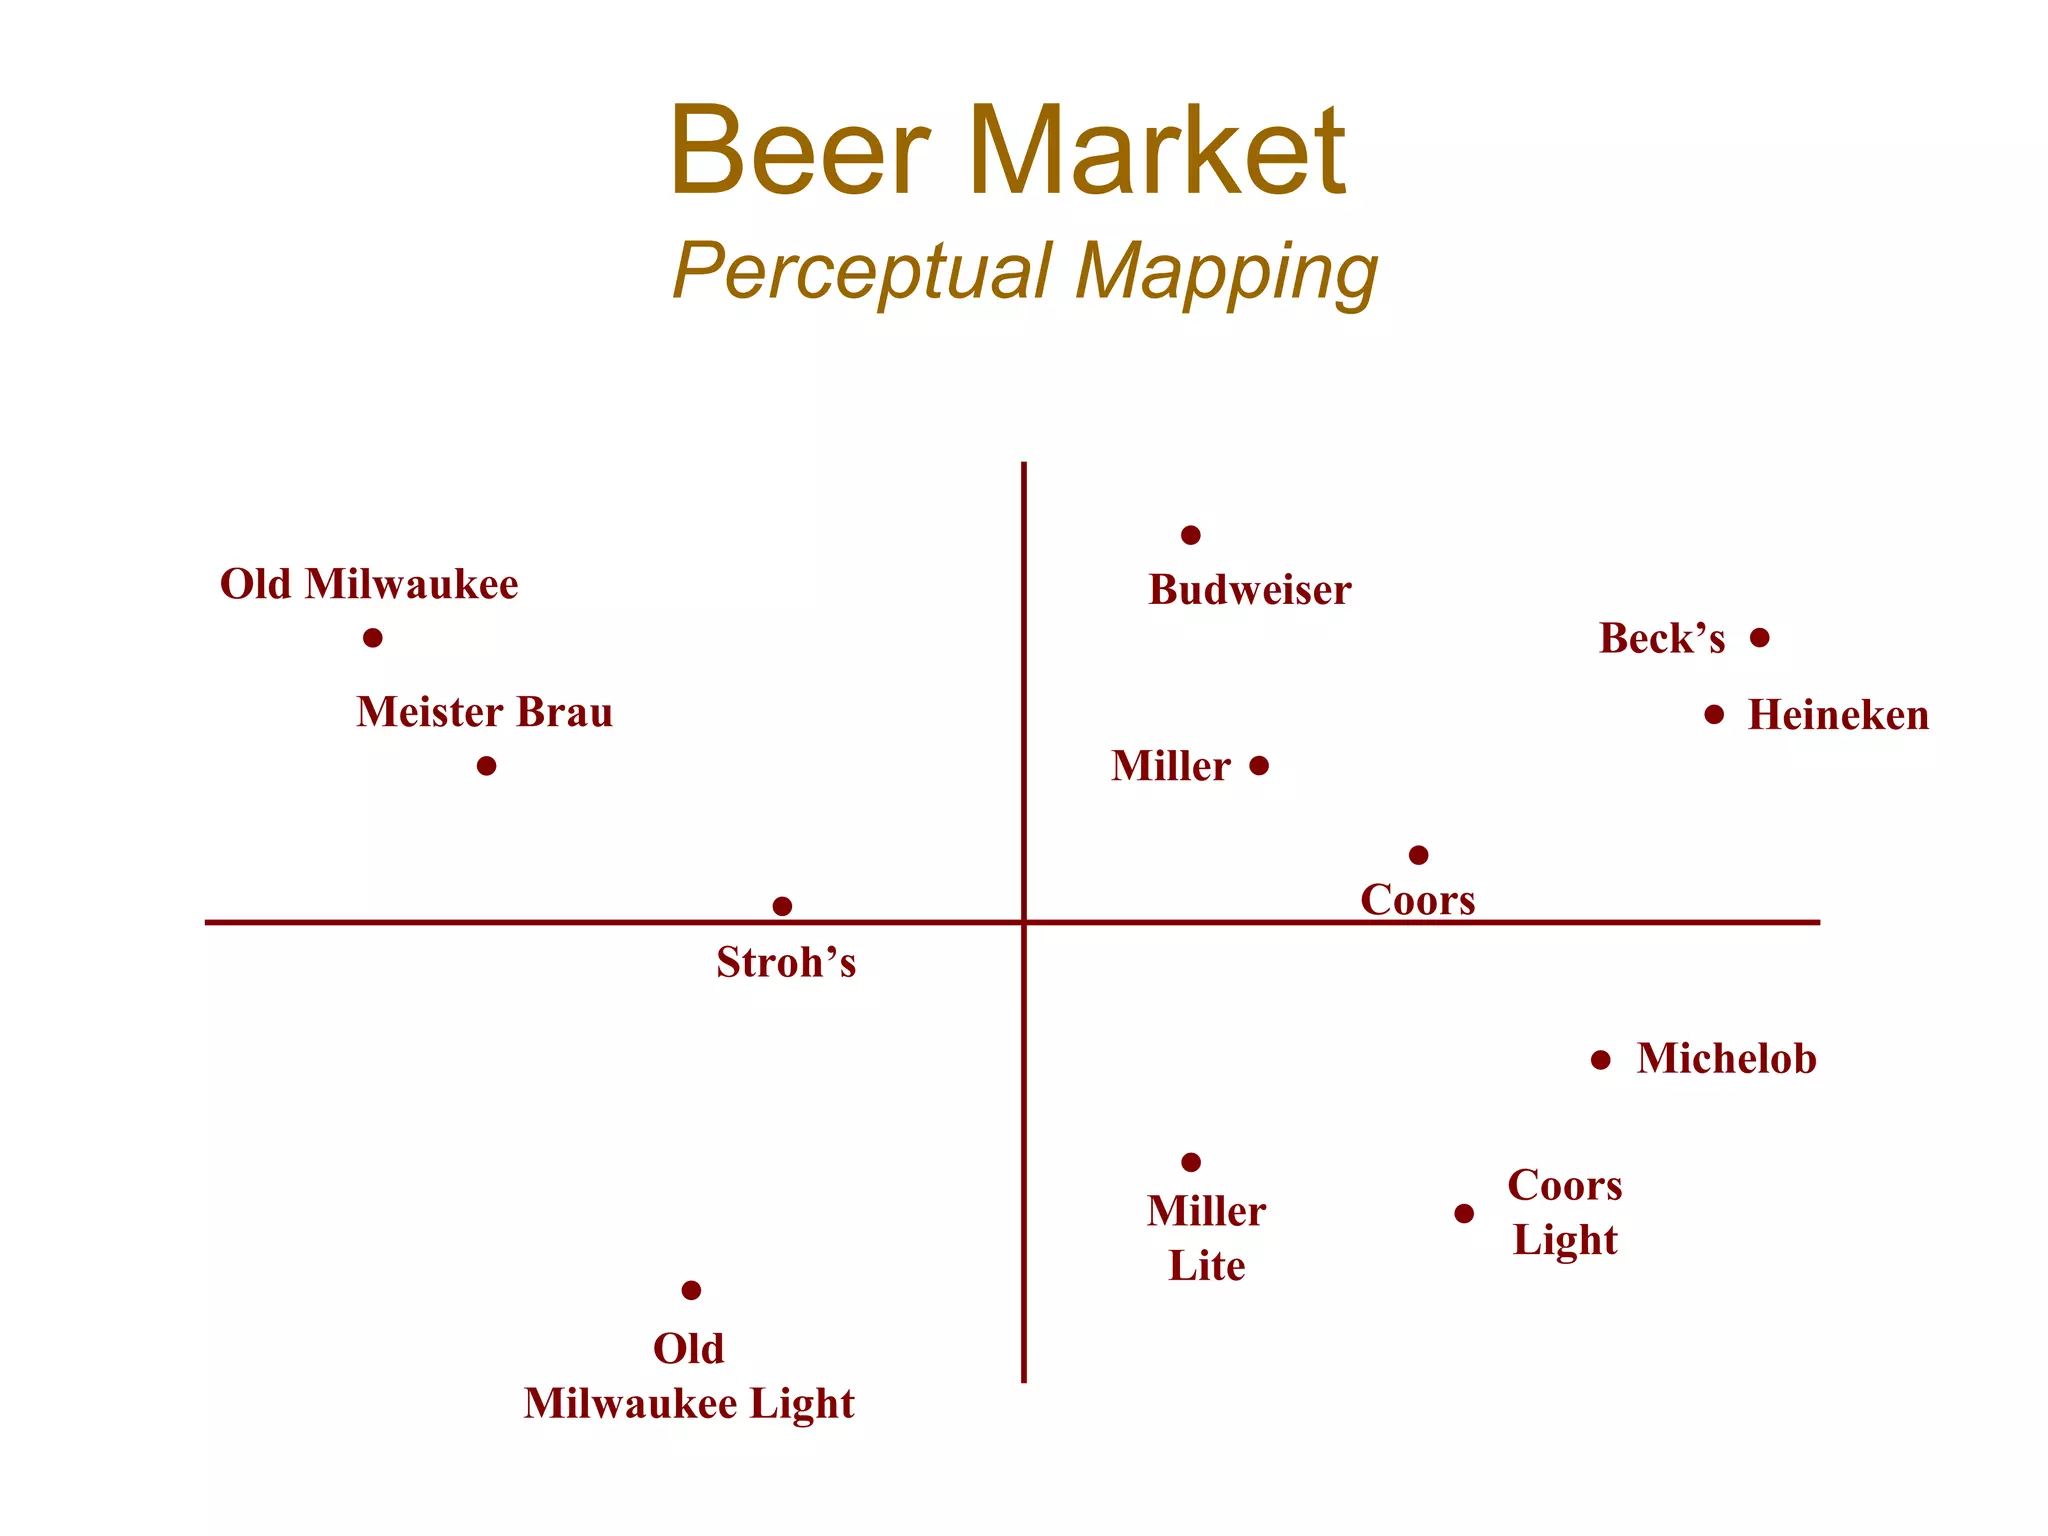
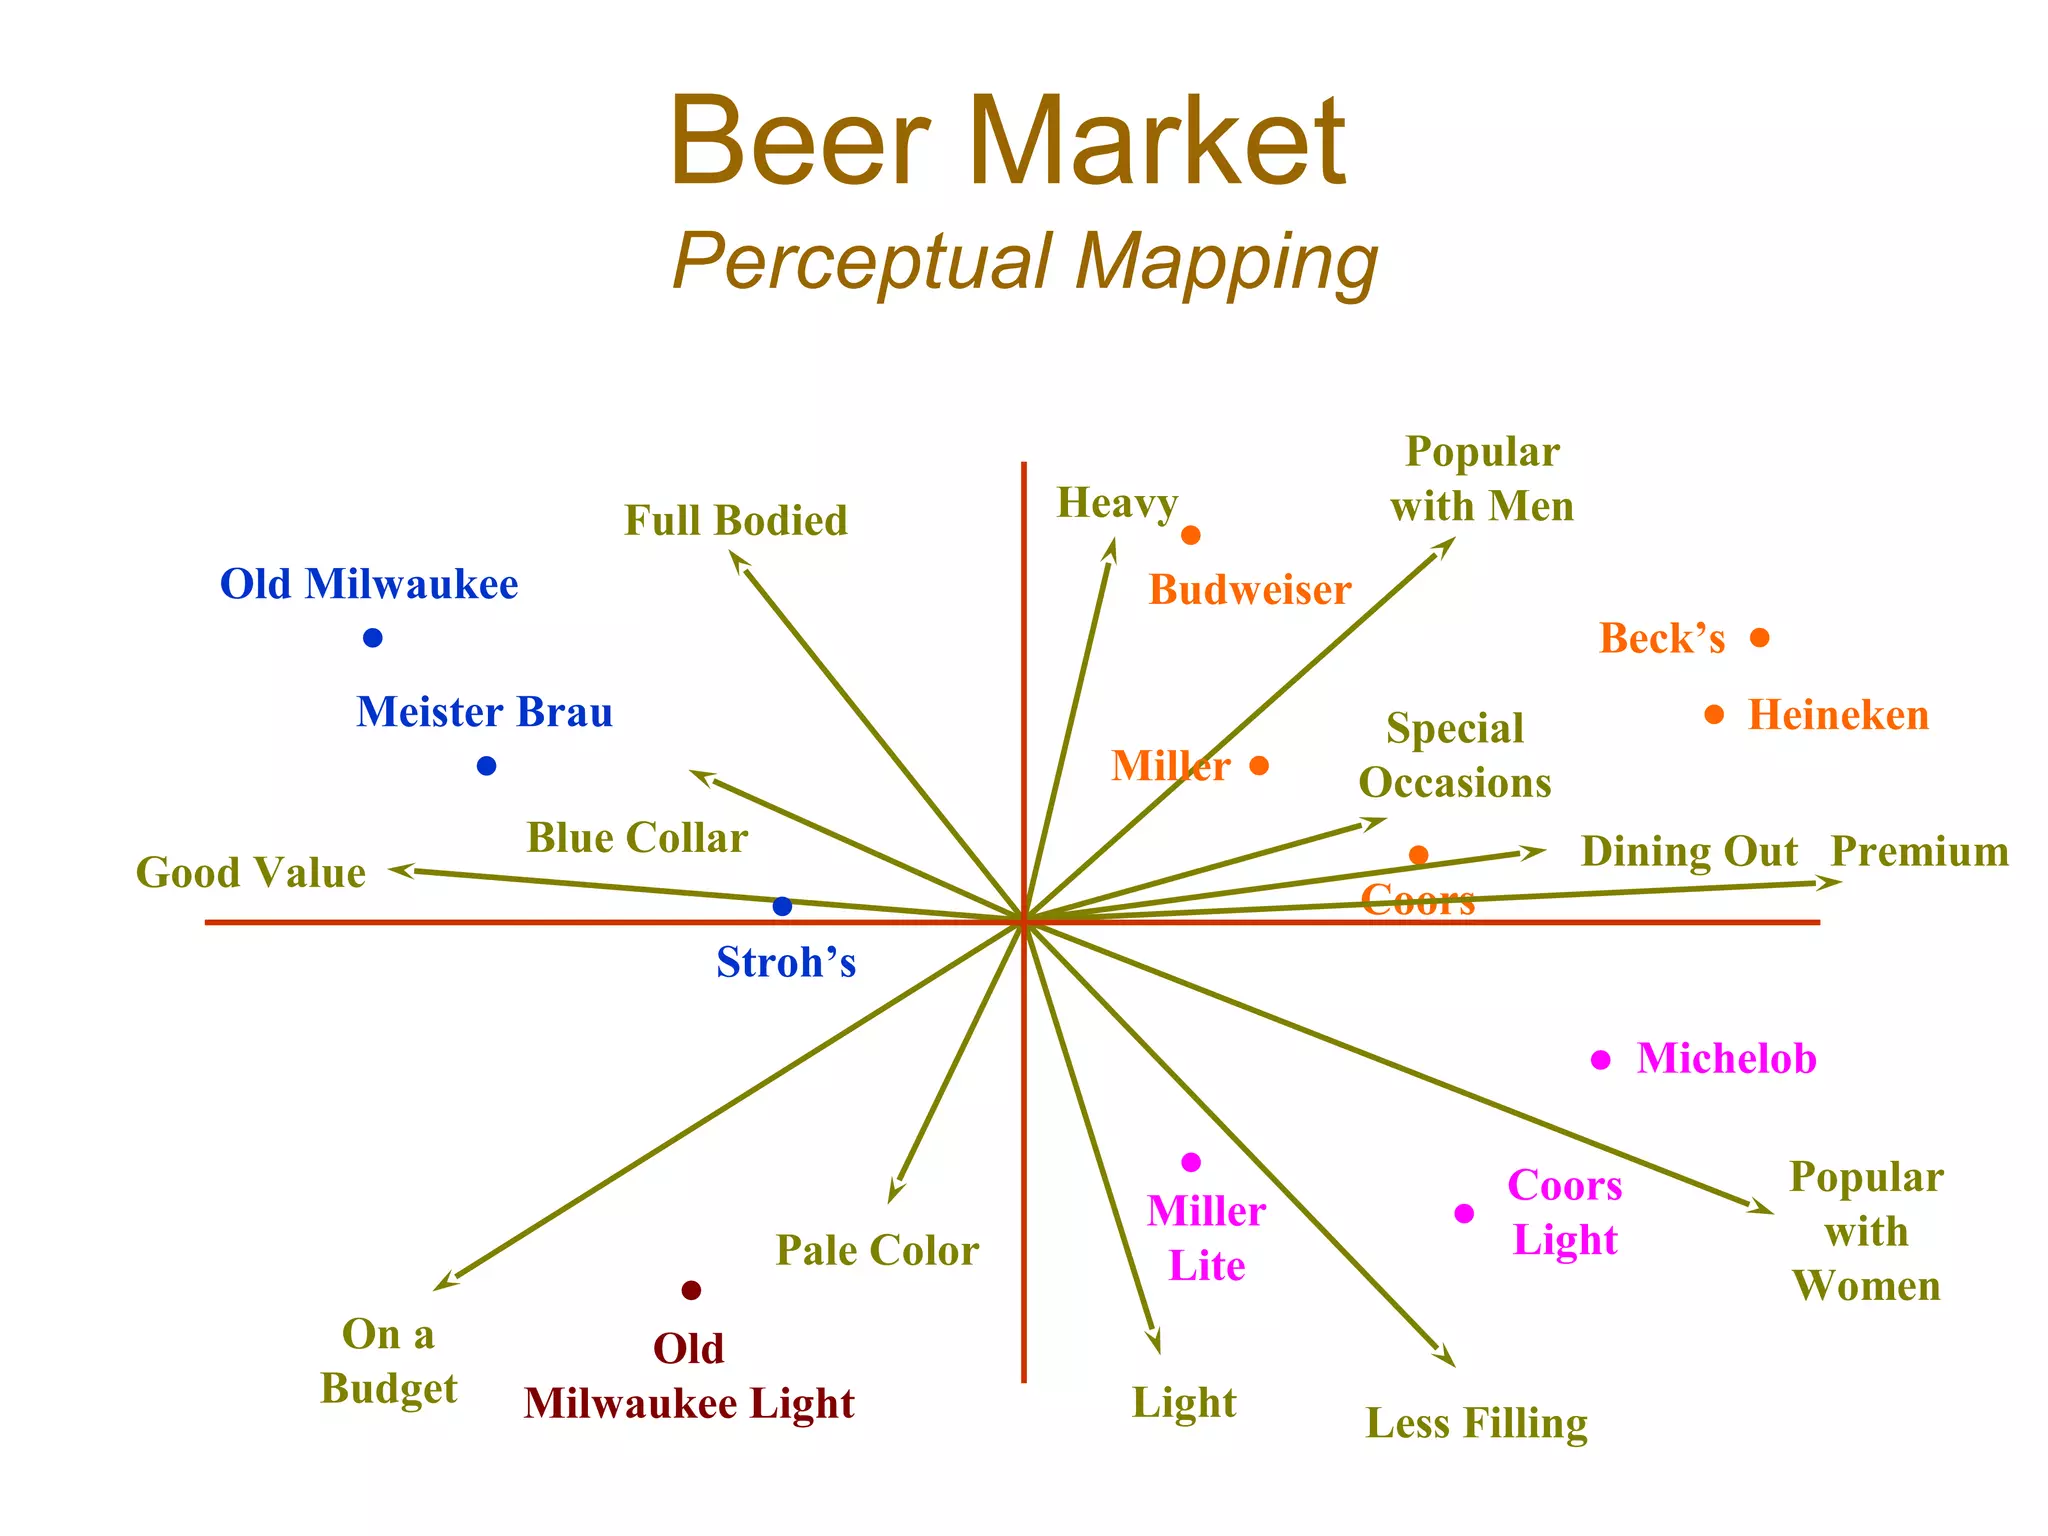
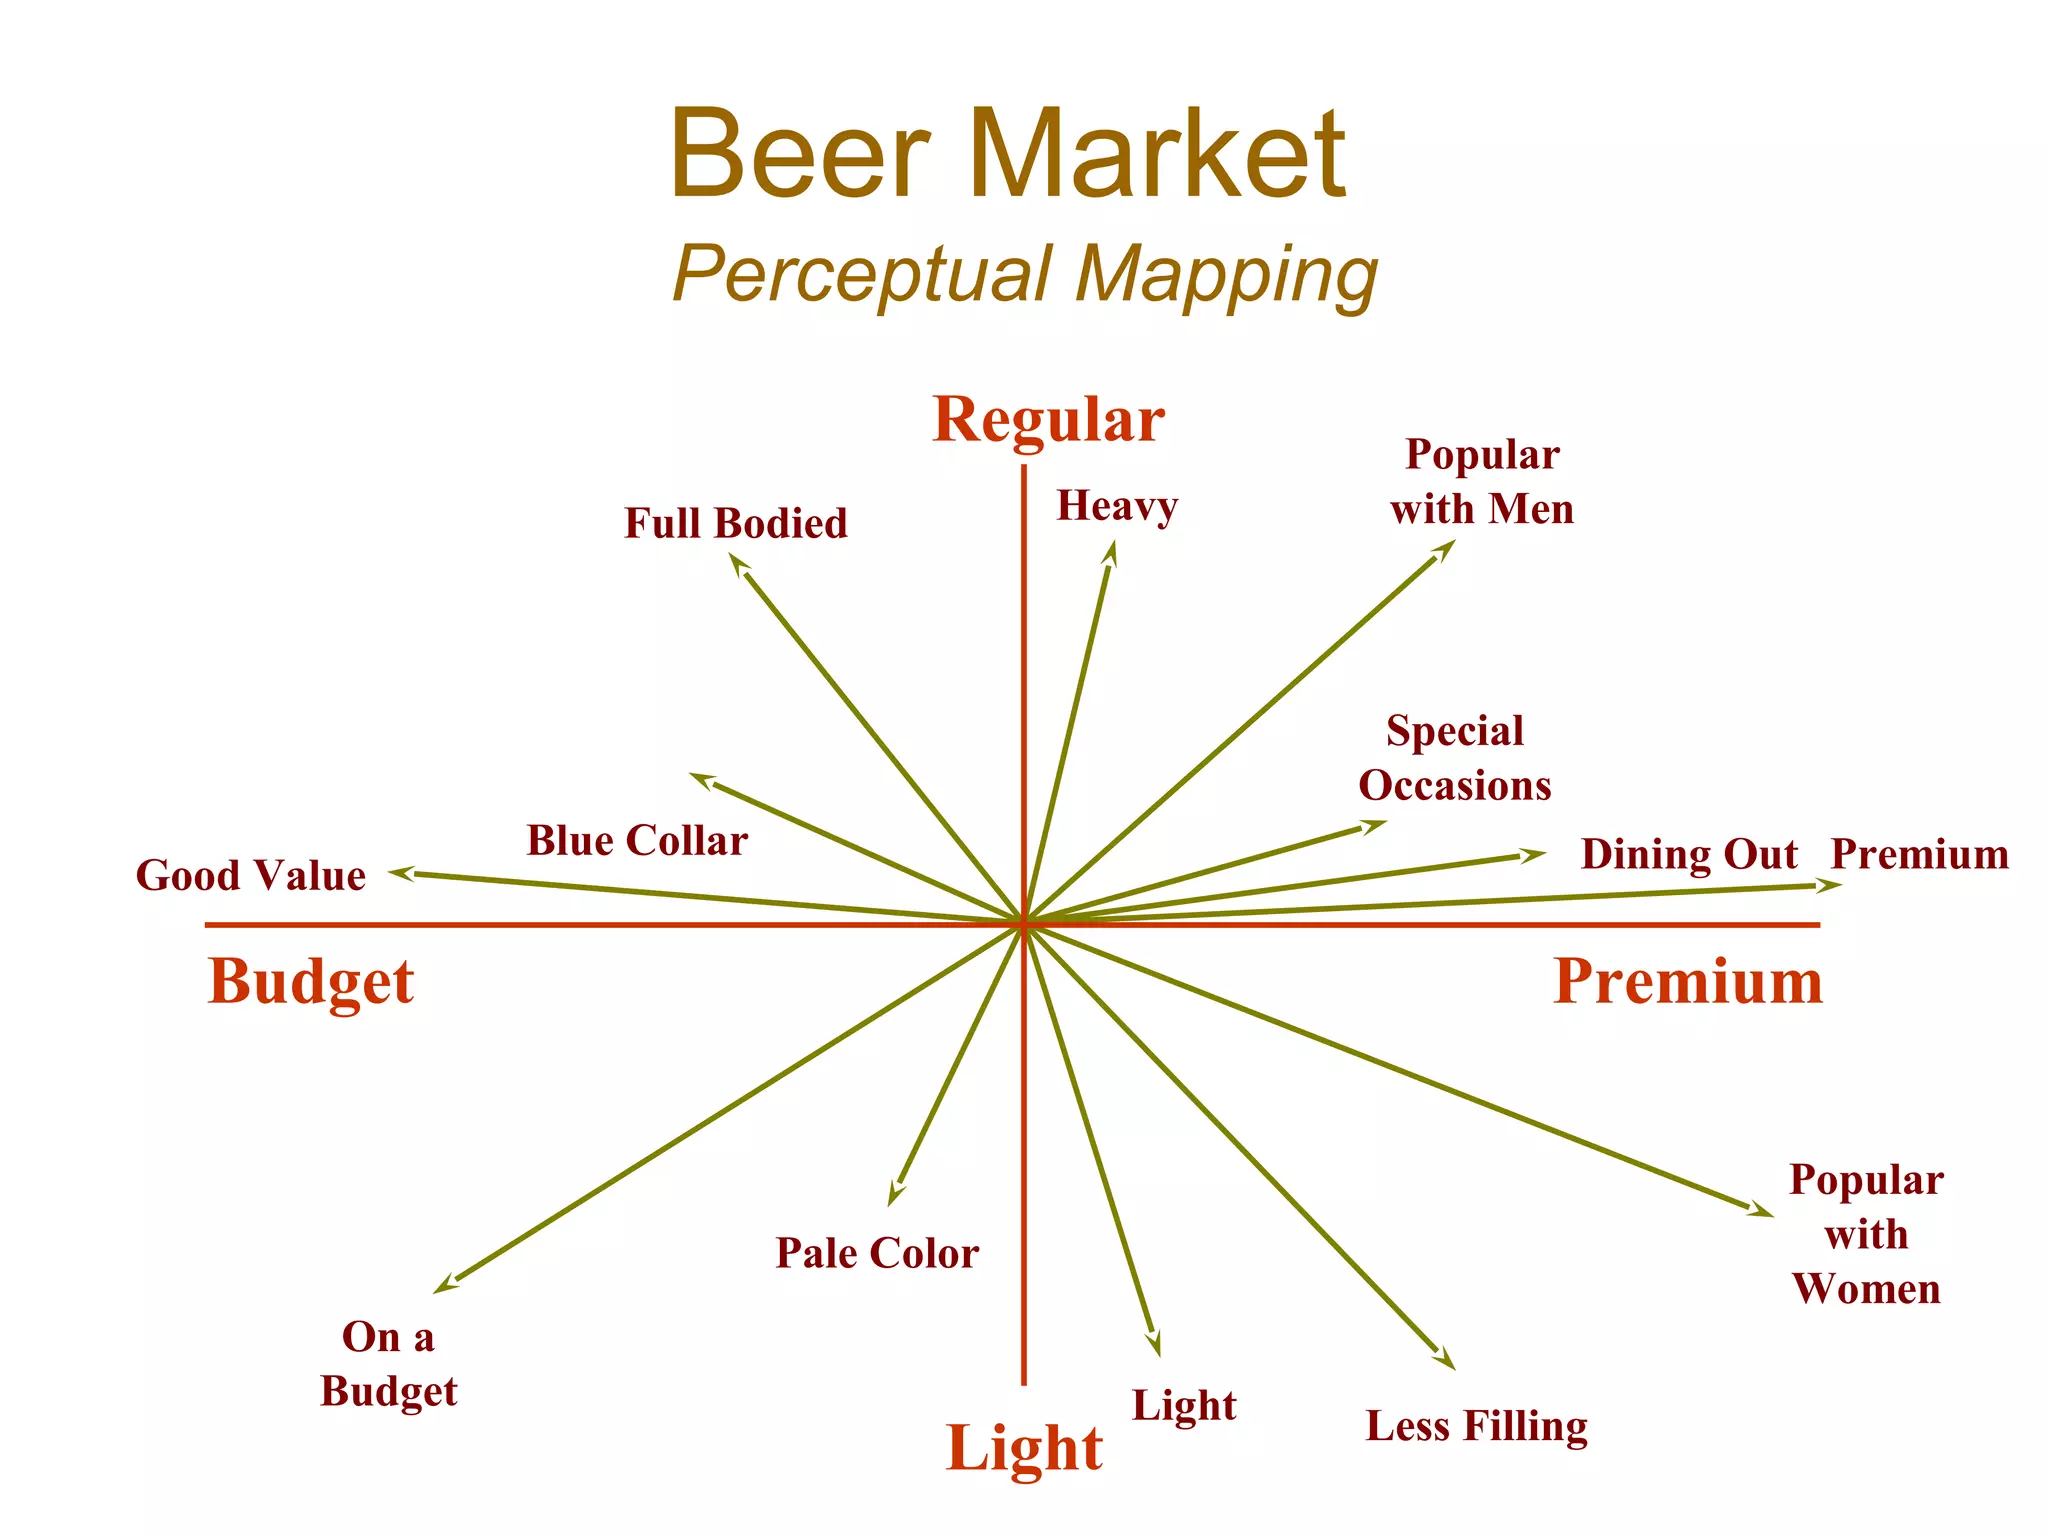
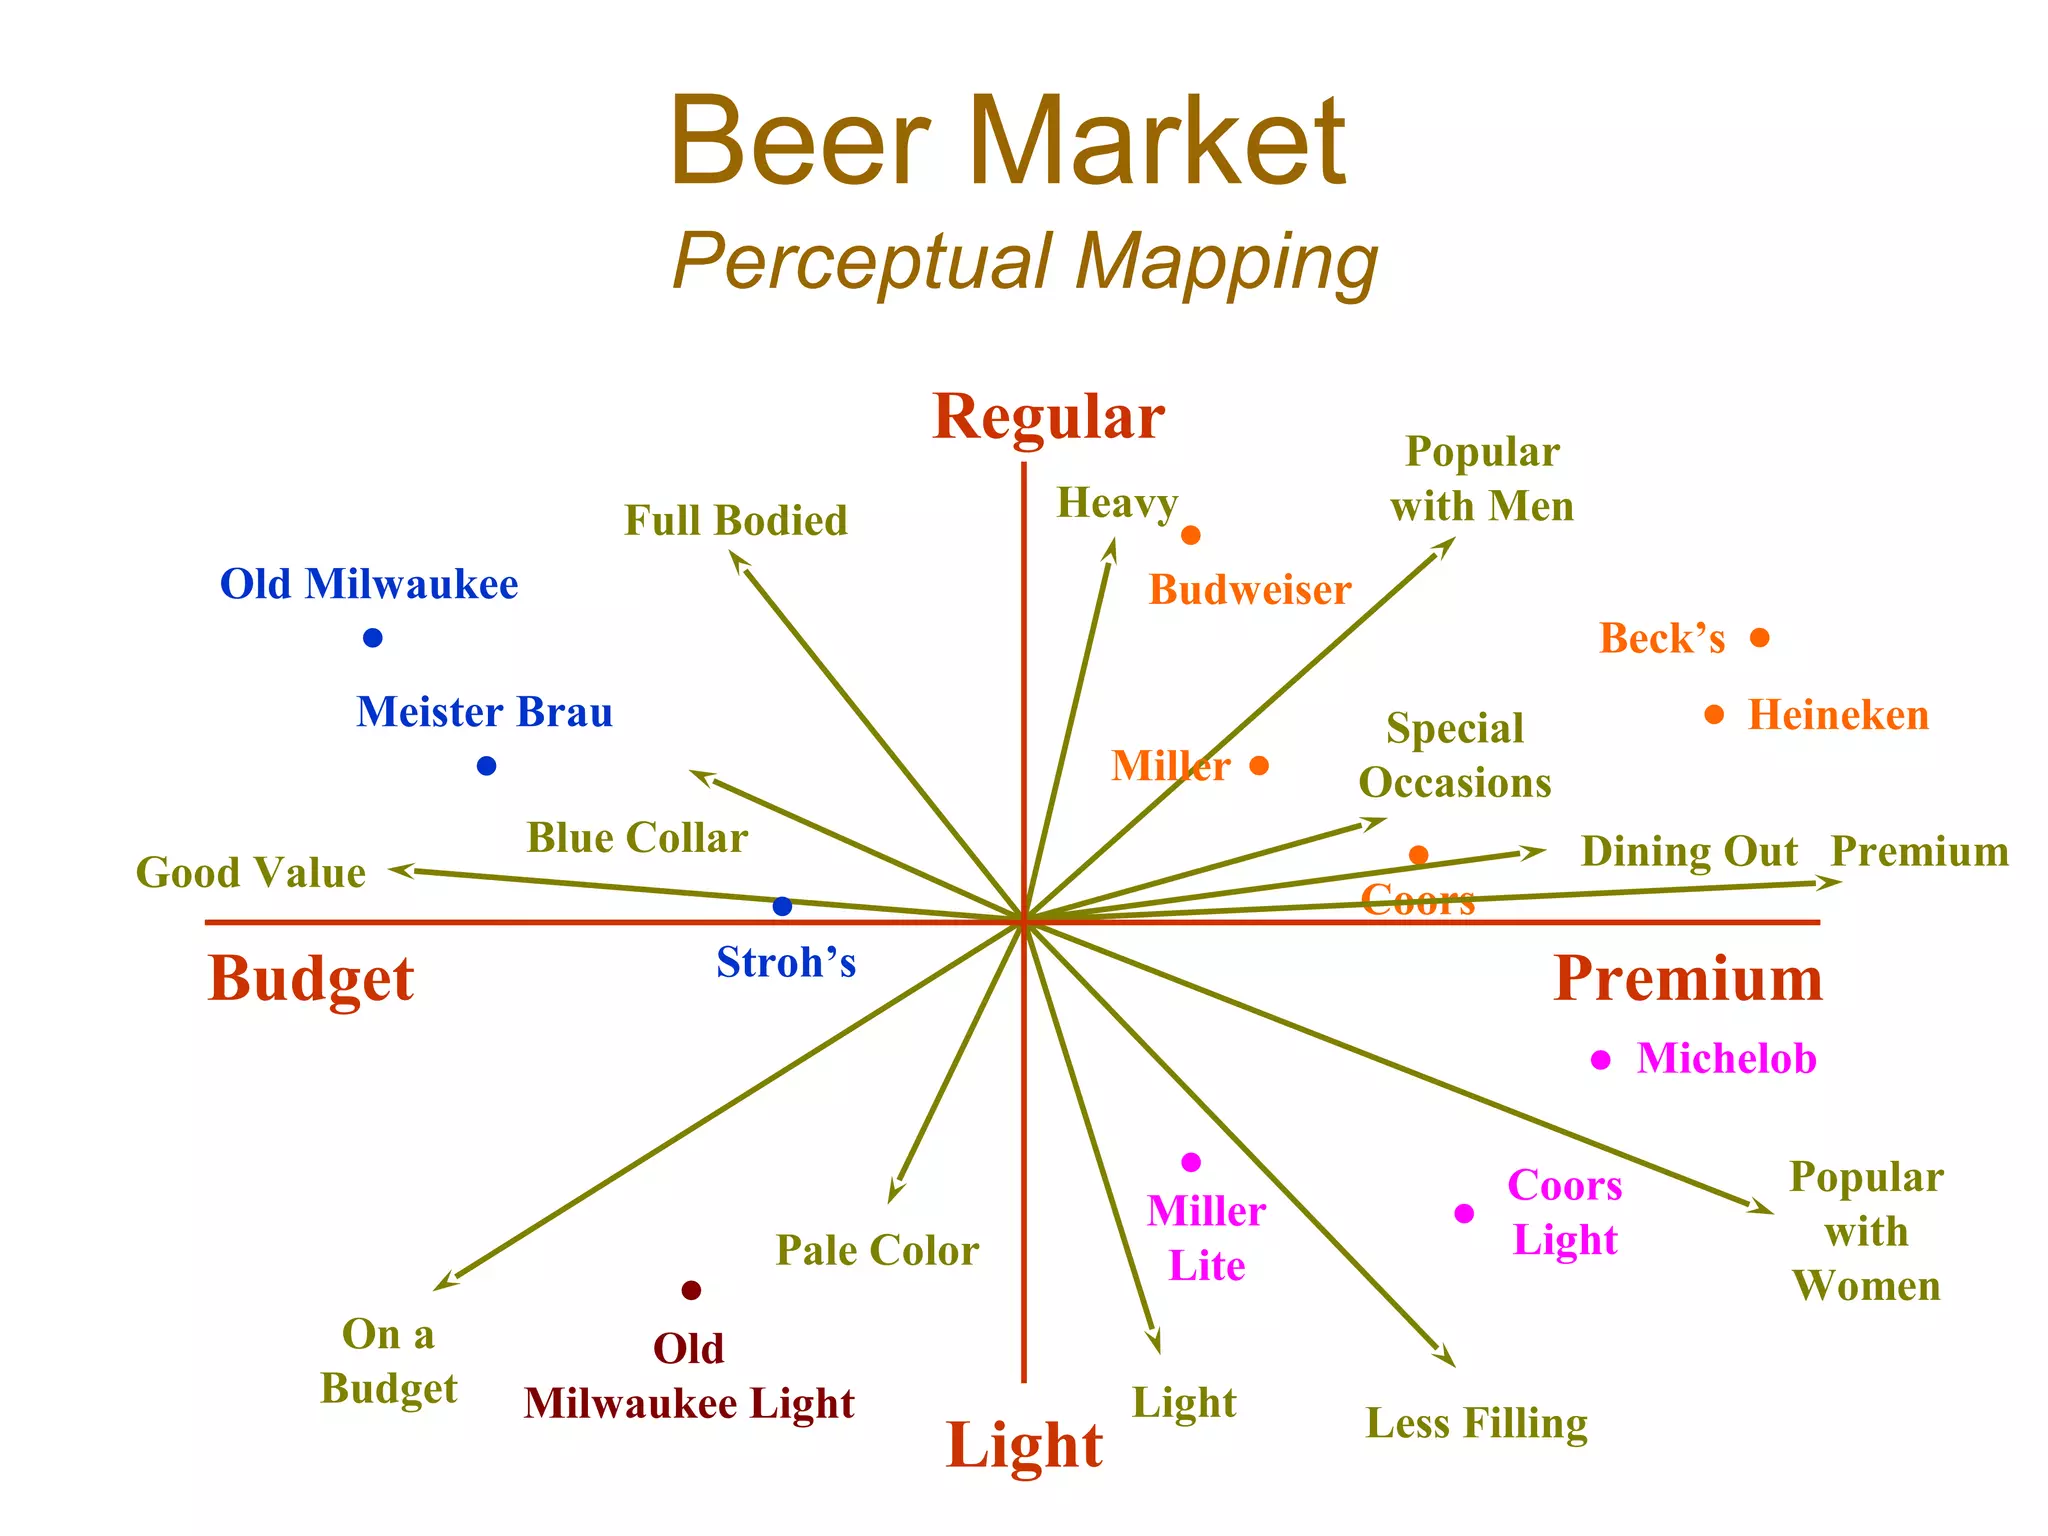
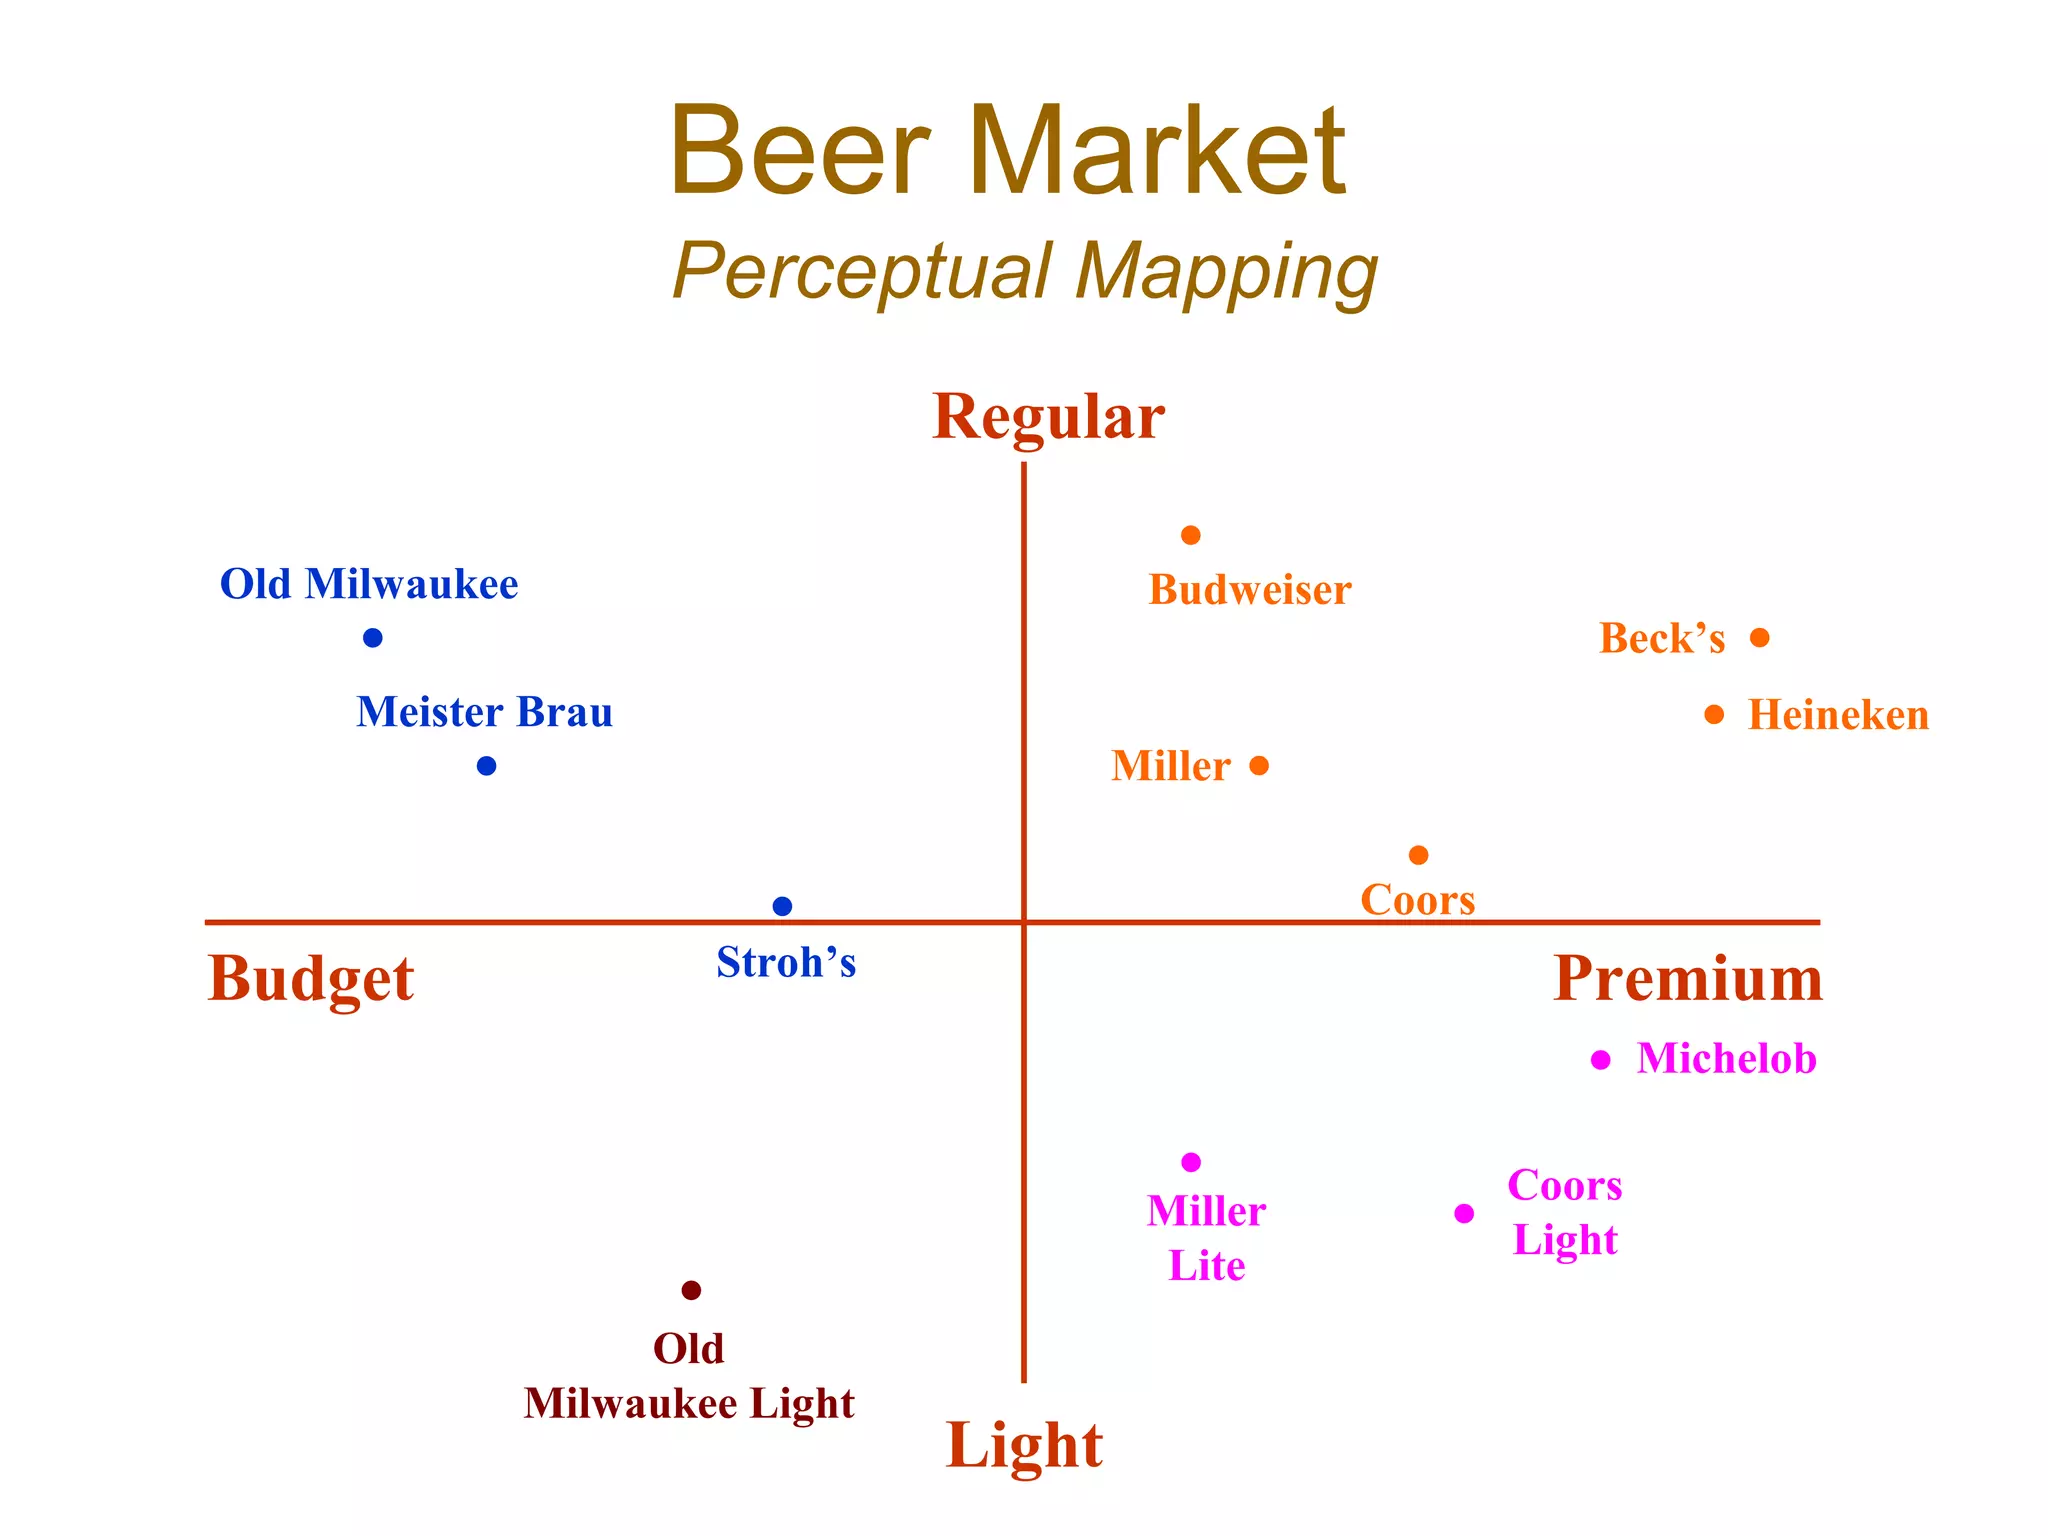
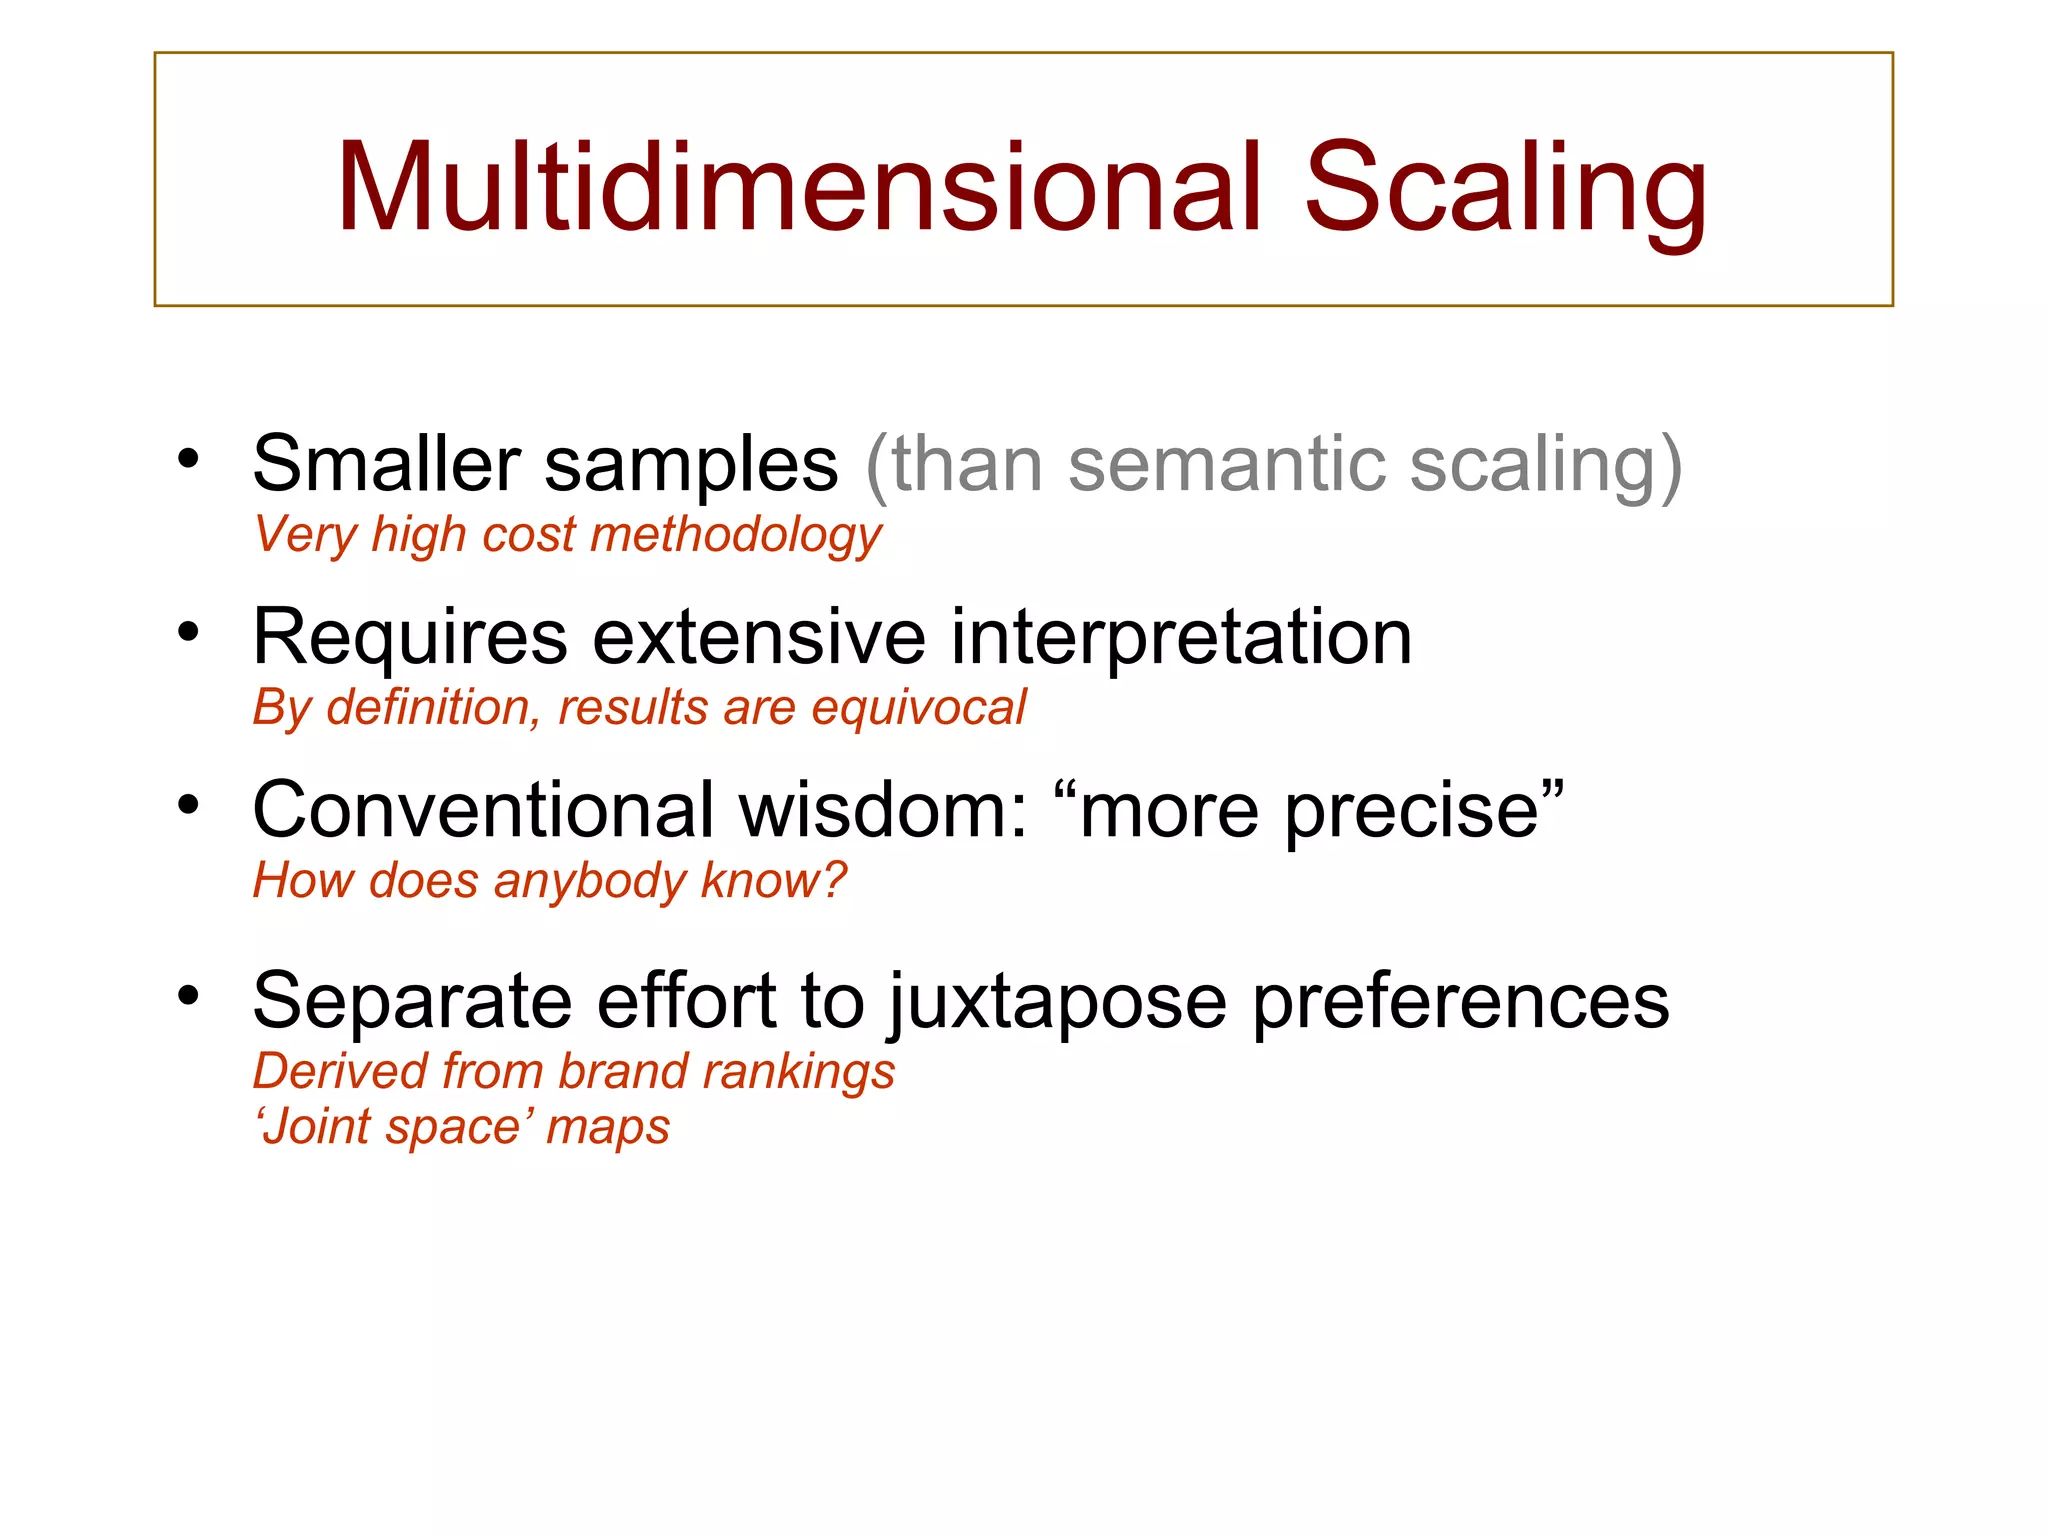
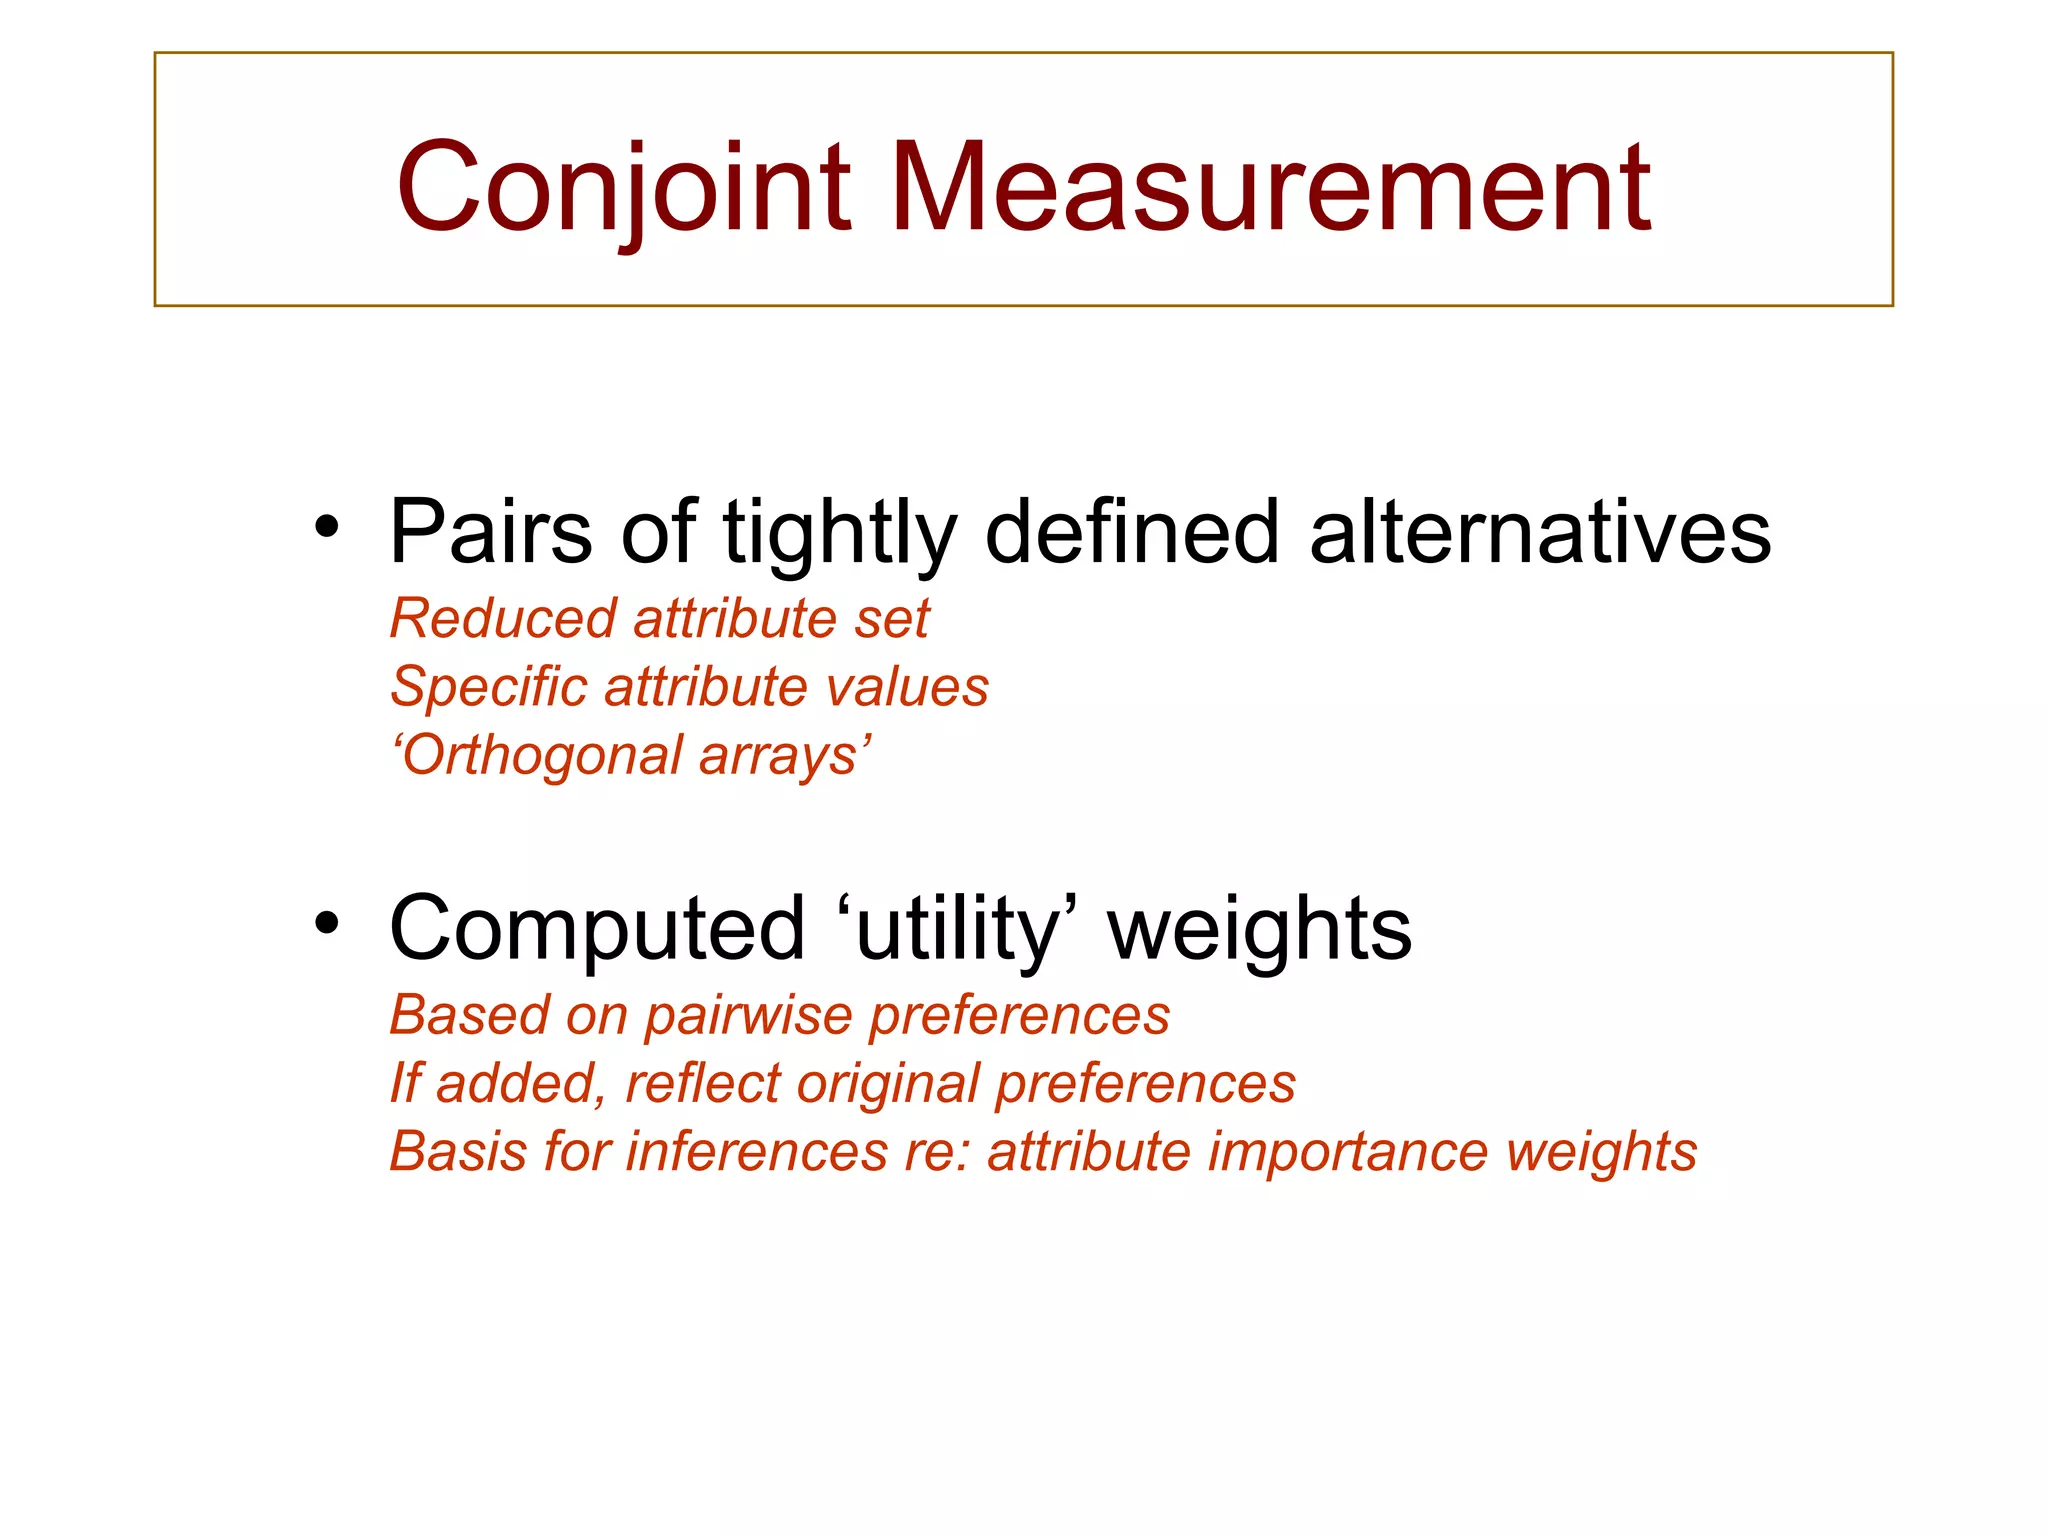

The document discusses various perceptual mapping techniques used to understand consumer preferences and product positioning. It describes semantic scaling surveys that ask consumers to rate products on important attributes to map their perceptions. It also covers multidimensional scaling which statistically maps similarity ratings between products onto a 2D space. Conjoint analysis is mentioned as deriving utility weights for attributes from pairwise preference judgments.