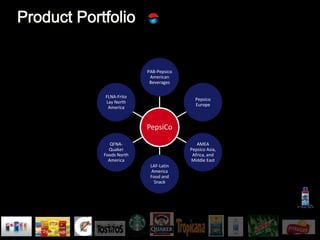
This document provides an overview of PepsiCo's financial performance and operations in 2012. Some key points:
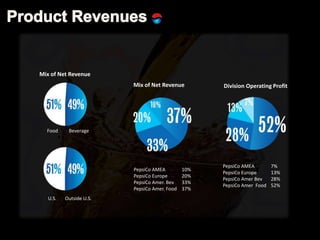
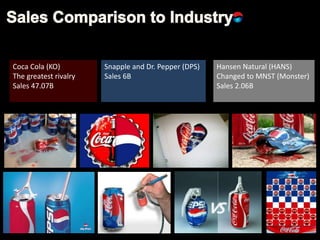
- PepsiCo's net revenue was $66 billion in 2012, with Frito-Lay North America and Quaker Foods North America making up 52% of operating profits.
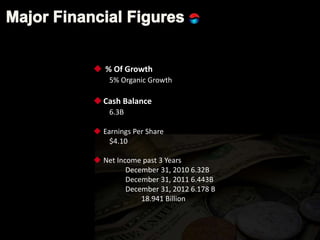
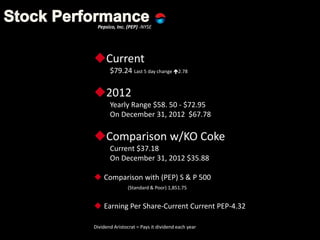
- Organic revenue growth was 5% in 2012. Earnings per share were $4.10 and net income over the past 3 years totaled $18.941 billion.
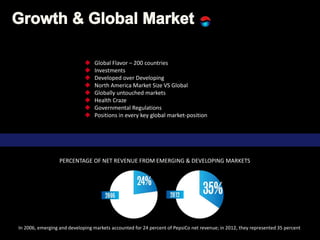
- PepsiCo operates globally, with 10% of net revenue from Asia, Africa, and the Middle East, 20% from Europe, and 33% from American beverages.
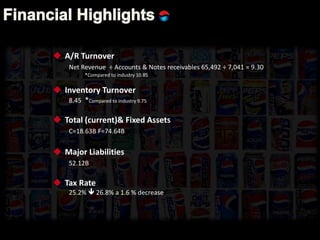
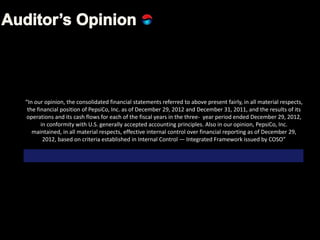
- The auditors found PepsiCo's financial statements and