Download to read offline
![Further reading
• White, H. (2007a) Combining bibliometrics, information
retrieval, and relevance theory, part 1: First examples
of a synthesis. JASIST 58(4), p. 536-559
• White, H. (2007a) Combining bibliometrics, information
retrieval, and relevance theory, part 2: Some
implications for information science. JASIST 58(4), p.
583-605
• Schneider, Jesper W., Birger Larsen, Peter Ingwersen.
(2007). Pennant Diagrams: What Is It [sic], What Are
the Possibilities, and Are They Useful? Presentation at
the 12th Nordic Workshop on Bibliometrics and
Research Policy. Copenhagen, Denmark
18](https://image.slidesharecdn.com/2013-09-26pennants-130930033426-phpapp01/85/Pennants-for-Descriptors-18-320.jpg)

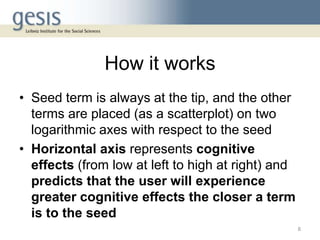
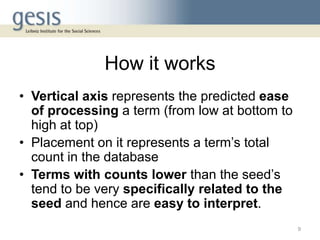
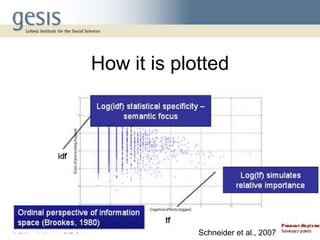
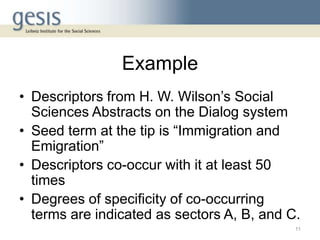
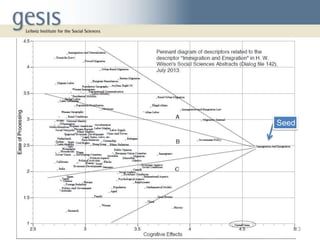
Pennants are a visualization technique that maps descriptors related to a seed descriptor based on their cognitive effects and processing effort. Descriptors are placed on a diagram with the seed at the tip, with their positions determined by tf-idf weighting of their co-occurrence counts with the seed. This allows the structure of descriptor relationships in literature to be explored. An example using immigration descriptors demonstrated sectors of specificity, with closely related terms nearer the seed and more general terms farther out. Pennants provide an alternative way to browse descriptor relationships and starting points for retrieval.