Download to read offline

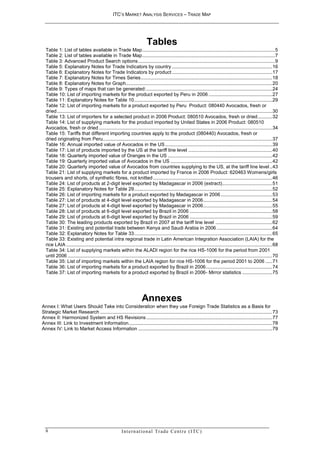

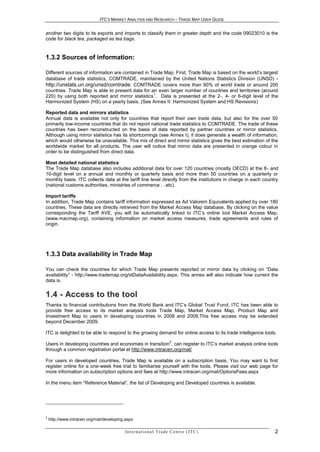
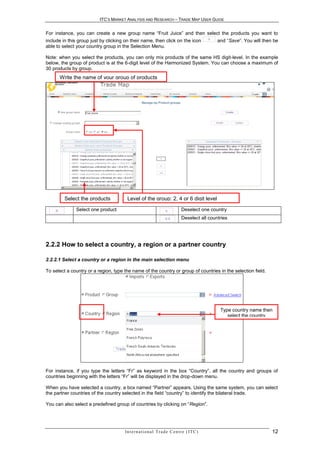
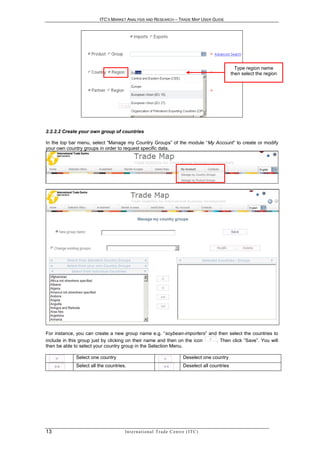
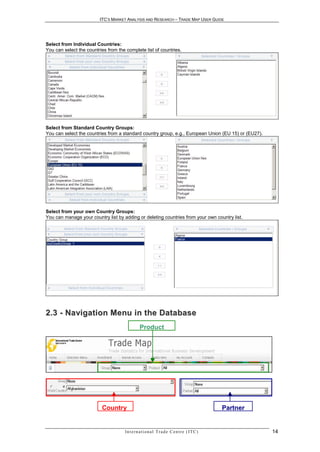
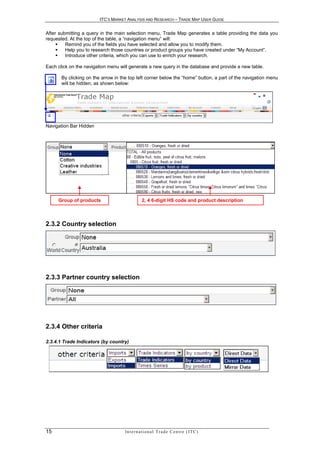
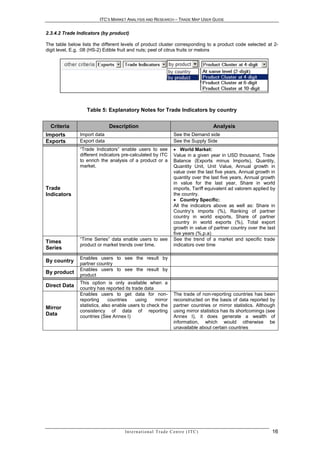
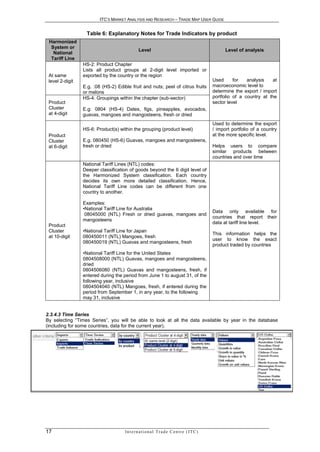
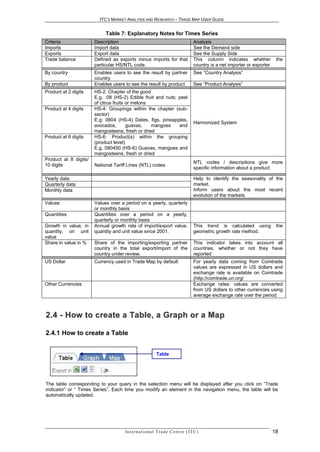
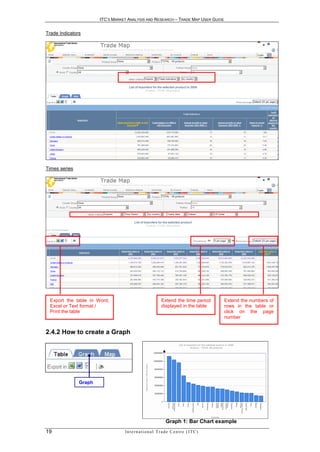
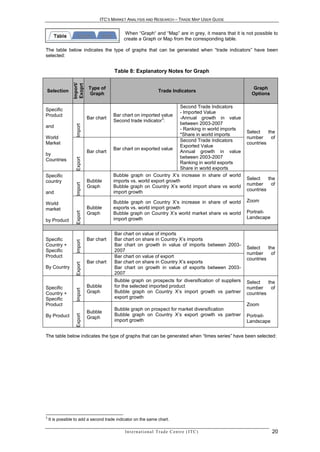
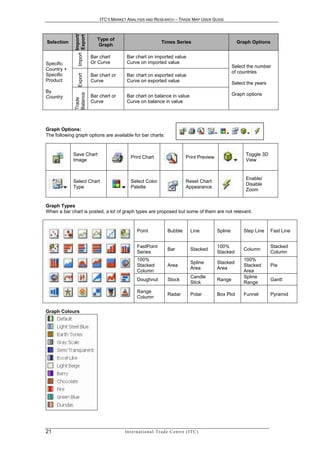
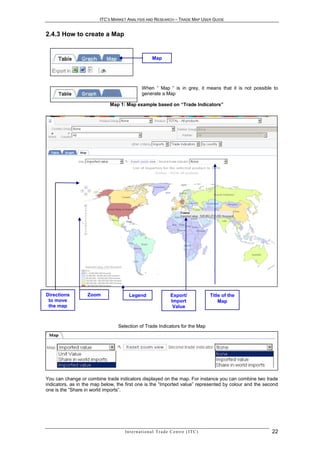
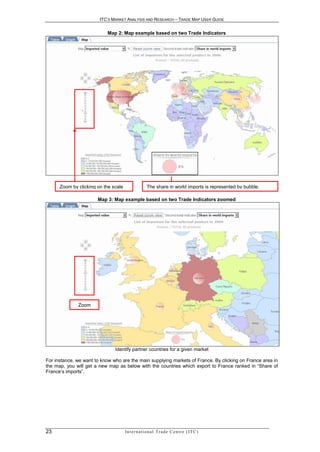
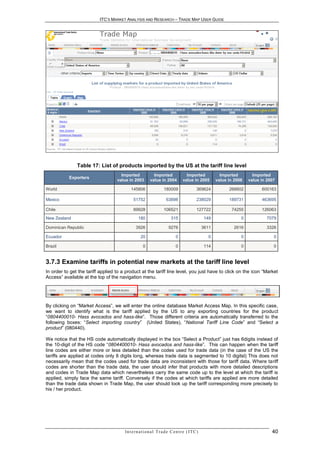
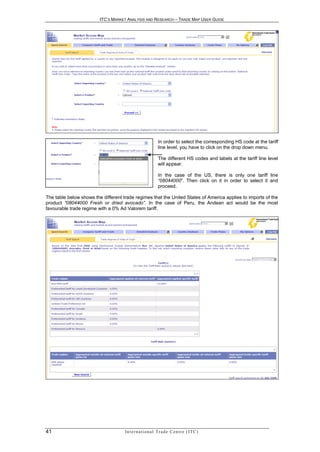
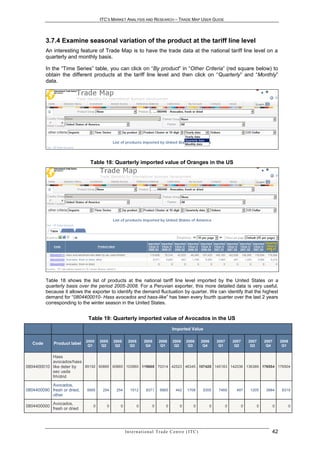
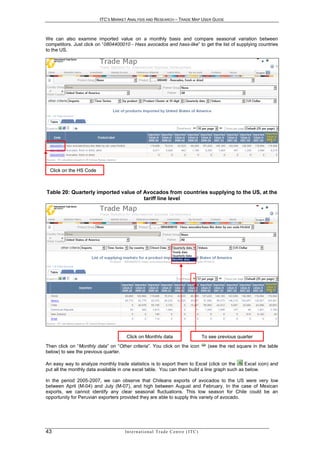
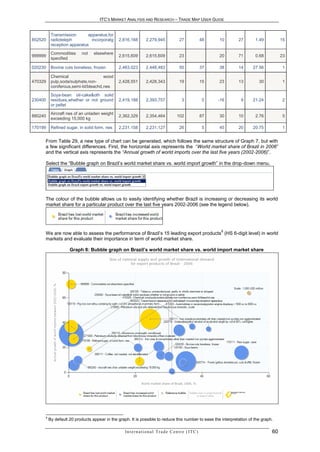
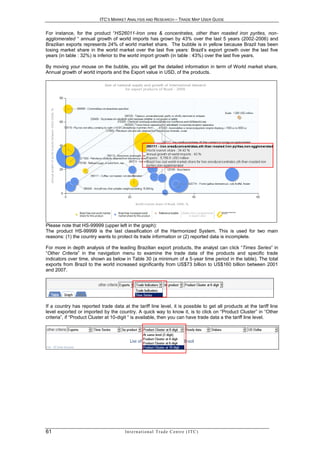
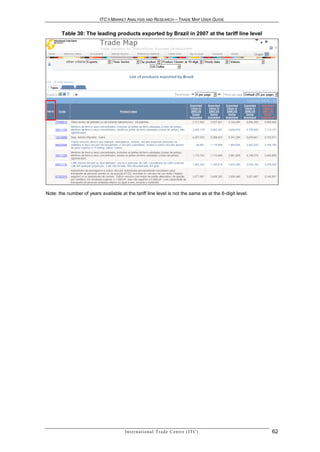
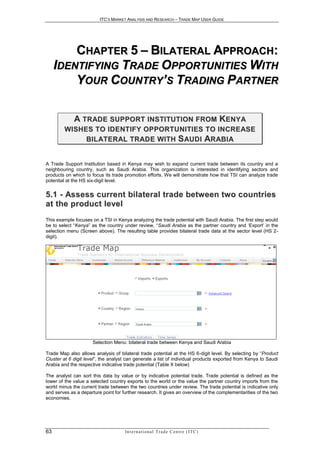
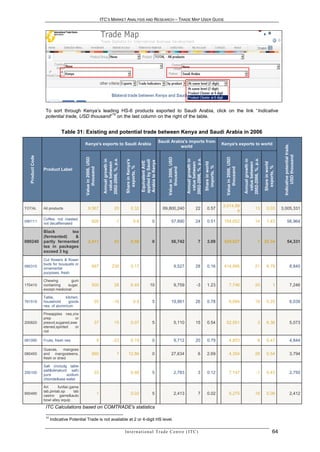

This document is a user guide for Trade Map, an online database of international trade statistics maintained by the International Trade Centre. The guide provides instructions on how to navigate the Trade Map interface and conduct analyses. It explains how to select products, countries, and time periods. It also demonstrates how to generate tables, graphs, and maps from the trade data. The guide walks through examples of how exporters and government analysts can use Trade Map to research new export markets, analyze trade portfolio diversification opportunities, and evaluate national and sectoral trade performance trends.


![Canada's State of Trade - Trade & Investment Update 2011 [DFAIT]](https://cdn.slidesharecdn.com/ss_thumbnails/canadasstateoftrade-tradeinvestmentupdate2011dfait-110819101715-phpapp01-thumbnail.jpg?width=640&height=640&fit=bounds)


