Download as PDF, PPTX
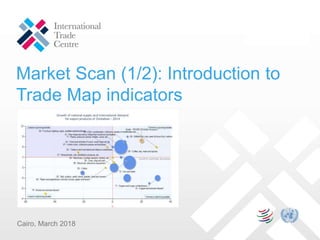
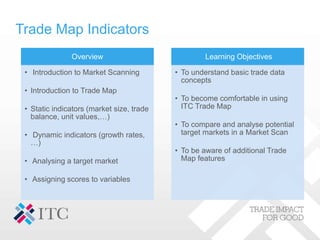
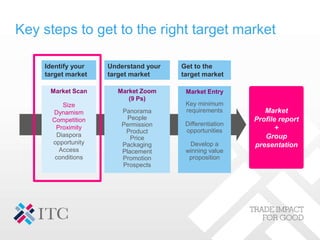
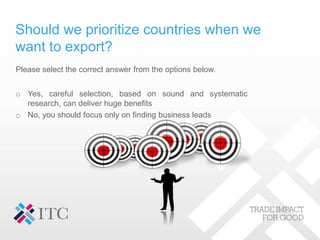

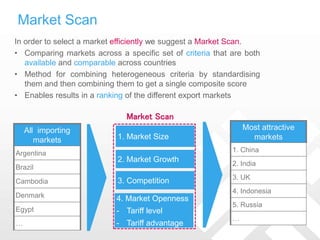
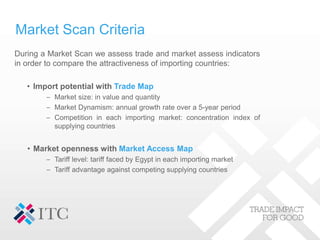
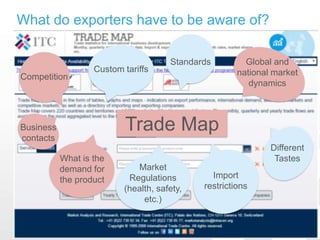
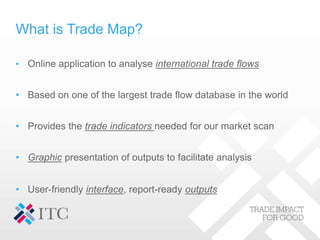
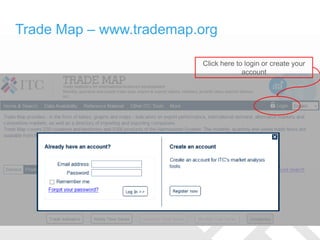
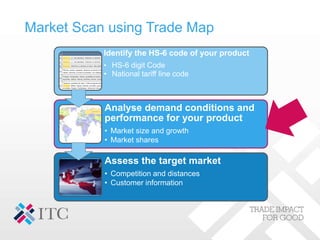

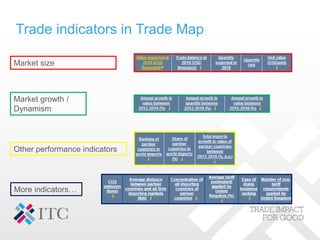
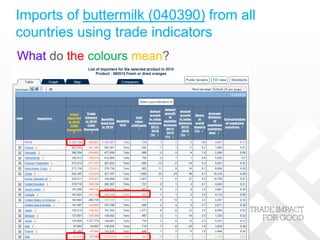
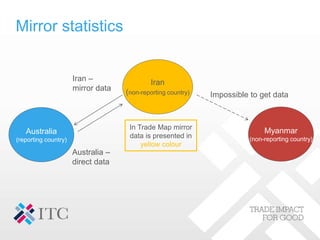
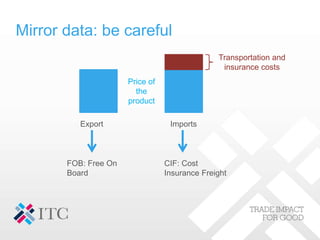
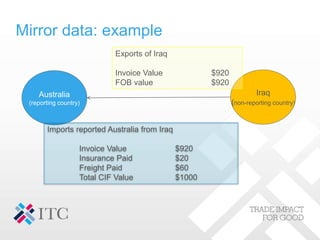
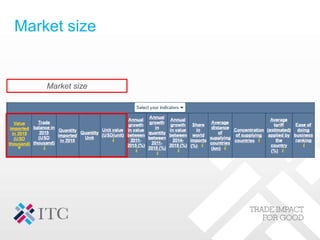
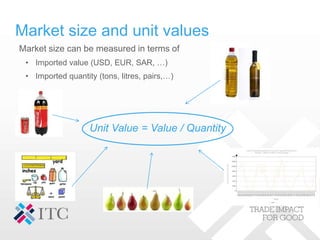
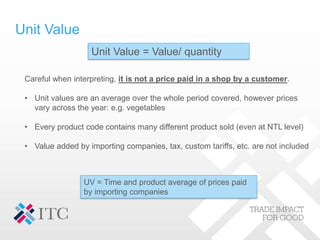
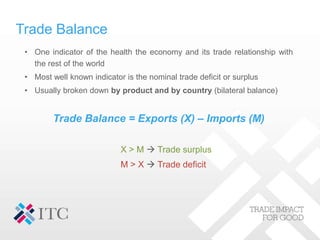
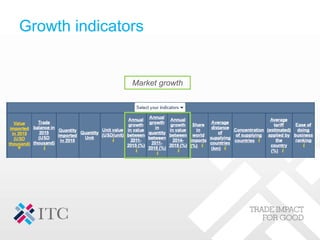
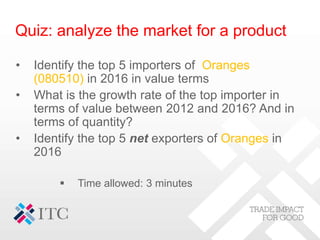
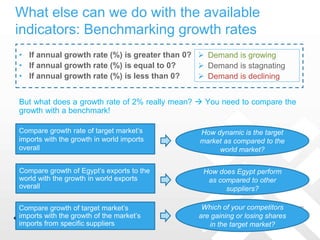
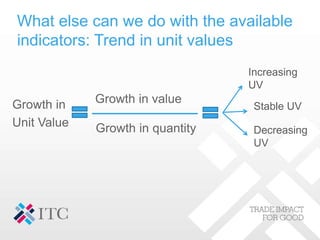
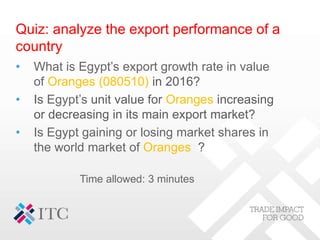
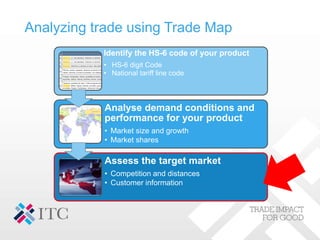
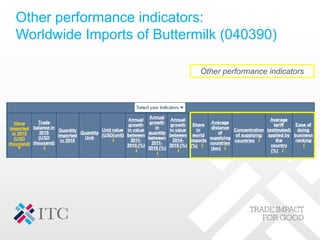
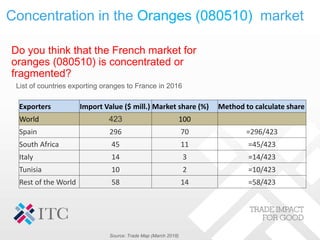
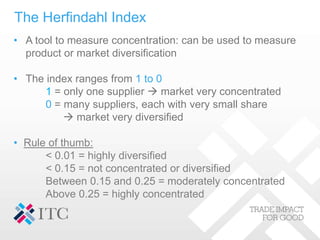
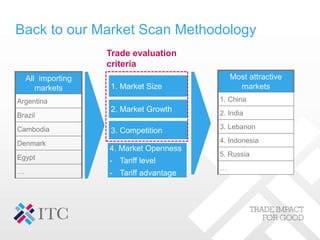
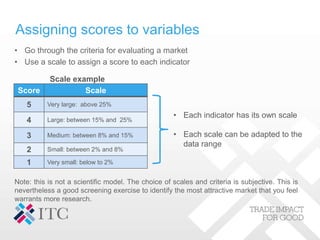
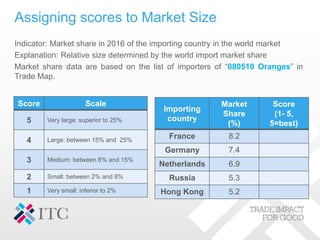
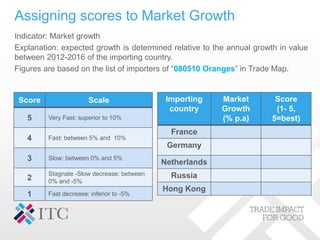
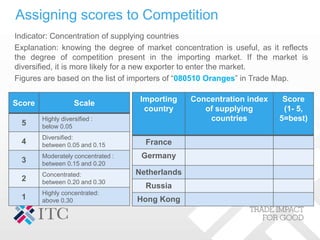
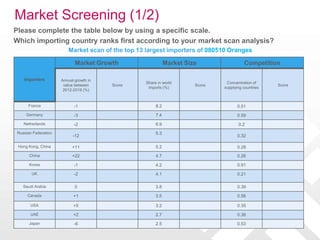
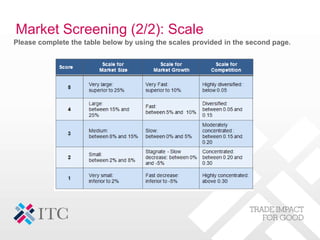
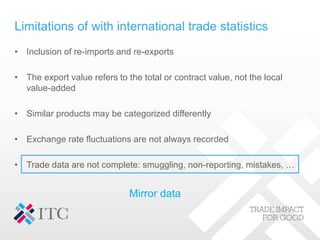

The document provides an introduction to using Trade Map indicators to conduct market scanning and select target export markets. It discusses key concepts like identifying target markets, comparing markets across criteria like size, growth, and competition using standardized scores. Trade Map is introduced as an online tool that provides trade data indicators needed for market scanning, like market size, growth rates, unit values, and competition levels. The document emphasizes benchmarking growth rates and interpreting unit values to better understand market dynamics. It also highlights limitations of mirror trade data and demonstrates how to assign scores to criteria in a market scan analysis to identify the most attractive markets.


