Download to read offline

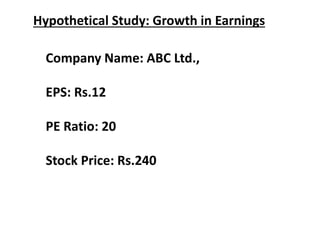
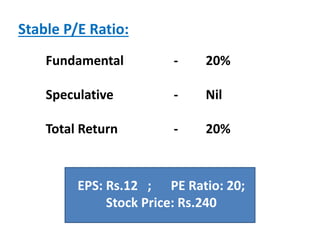
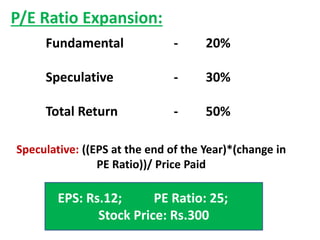
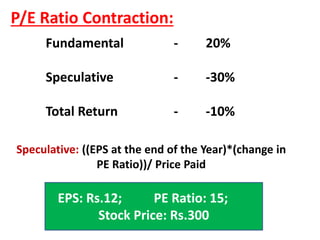

There are two sources of equity returns: fundamental and speculative. Fundamental returns come from earnings and dividends. Speculative returns arise from changes in the market's valuation of a company's performance and profitability prospects. A company's stock price is determined by multiplying its earnings per share by its price-to-earnings ratio. The total return from holding a stock is the sum of the fundamental return from earnings and any return from expansion or contraction of the price-to-earnings multiple assigned by the market.