PD cell Kaizen event presentation
•Download as PPTX, PDF•
0 likes•764 views

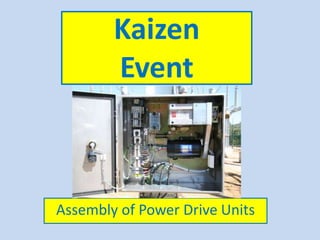
The Kaizen event focused on improving the assembly process of power drive units. Previously, the assembly area was small and cluttered, requiring operators to walk long distances to retrieve parts. The team redesigned the assembly cell layout into a U-shape with dedicated areas for each sub-assembly process and parts/tools within reach. This reduced the cycle time from 260 to 135 minutes and walking distance. The new layout allowed completing assemblies with two operators instead of four, improving productivity from 12 to 20 units per week while reducing space and work-in-process inventory.

Recommended
More Related Content
What's hot
What's hot (13)
Viewers also liked
Viewers also liked (15)
Similar to PD cell Kaizen event presentation
Similar to PD cell Kaizen event presentation (20)
PD cell Kaizen event presentation
- 1. Kaizen Event Assembly of Power Drive Units
- 2. Team Members Greg Williams and 7 other team members who shall remain nameless for this version of the presentation. Those chosen had considerable experience with the existing power drive manufacturing and assembly process and had some exposure to a previous Kaizen event
- 3. Previous state The team recorded: • Area = 80sq/m • Working environment was a small area in the aisle between assembly benches and racking. • Limited access for forklift into racking when assembling Power Drives. • Walking distances 650 metres per PD x 2.5 PD a day = 1.62km per day • No of operators = 4 required by ST point scheduling • Cycle time = 260min
- 4. Previous state Packing crates as benches, cubicles stored on floor Components difficult to access Components strewn in various non-defined locations. Batching of assemblies
- 5. Previous state Recorded times were transferred to bar charts Version 3 - New two operator sequencing Version 3 with a further 30 minute reduction in cycle time. Now 135 minutes. Further reductions were expected by reduced walking times with new cell layout
- 6. Previous state Parts retrieval spaghetti chart Previous state 650 mtrs walked for each Power Drive assembled equated to 1.62klms per day
- 7. Version 4 - New two operator sequencing NOTE: Further reductions expected by reduced walking times with new cell layout. Recording of new times still required to show 15 minute reduction in cycle time. The target of 4 Power Drives a day was achieved.
- 8. Cell design • The team used a combination work chart to: – Reduce cycle time – Decide the correct sequence of standard work – Synchronise sub assembly and main assembly operations • Decide on U shaped counterclockwise cell layout • Right sized part racks and buckets within easy reach • Modified jigs and fixtures • Dedicated pedestal and bench drills for eliminating jig setup times • Lift trolleys for one piece flow assembly providing easier access and manipulation of assemblies • Fastener and tool trolleys • Crane for ease of lifting into cabinet and crates
- 9. White board was installed for operators and management walk around to track progress
- 10. Dedicated drills to eliminate jig setup times Dedicated tool and fastener trolleys Component buckets positioned for ease of access Adjustable trolley heights reduced operator movement when accessing heavy parts
- 11. Result of New Cell Design 4 Complete main mech assy 3 Drill motor and auxy switch 2 Start main mech assy 1 Drill gearbox 8 Pack 7 Install main assy into cubicle 6 Prepare cubicle 5 Electrics installed overnight
- 12. Results Before After Improvement Area 80sq/m 61sq/m 24% reduction Cycle time 260min 135min 48% reduction Crew size 2 req normal scheduling 4 req for EA schedule planning 3 in training Target of 2 25% reduction in ST planned crew size Target is 50% crew size reduction WIP = = None Inventory = = None Productivity 12 PDs per week 20 PDs per week 66% increase
- 13. To Do • Further gains are anticipated through investigation of the following: – Shaft and stop design to remove welding process – Chain cut to length by subcontractor – Breather gauze and foam cut by subcontractor – Din rail cutter which has been implemented already – Wire handle cap retaining chain made outside – Crane required – Sharing with Ergon cell at present – Supply and install of the wiring loom. This is essentially our drum beat. – Hand over to continuous improvement team/cell operators – Cell operators have already listed various other improvements on their whiteboard
Editor's Notes
- Reason for Kaizen event Due to the high demand of deliveries for Energy Australia earlier this year, a decision was made to run a Kaizen event on the assembly of Power Drives. As with the Ergon cell the focus was on the one piece flow cell concept, the sequencing of operations, reduction in cycle time and the identification and reduction of waste.
- Team members A team was chosen who have had considerable experience with Power Drive design, manufacture and assembly and also Kaizen experience.
- Previous State The team recorded: Total area used was = 80sq/mtrs. Walking distances for retrieval of components was 650 metres per Power drive. 4 operators were required by ST Point scheduling software. The times of each process were recorded and the cycle time for one Power Drive was calculated as 260 minutes although some versions are up to 297 minutes.
- Previous State Working environment was cluttered, with packing crates as assembly benches. Components were difficult to access or strewn in various locations. Batching of assemblies was common practice. Assemblies in various stages of completion. Limited access for forklift into adjacent racking.
- Recorded times were transferred to bar charts by hand. Operator sequencing was determined by transferring those times to a series of combination work charts. Some operations were combined for ease of operator sequencing 3 versions of operator sequencing reduced the cycle time from 260 minutes to 135 minutes.
- A Spaghetti chart was created to determine the movements staff required to assemble. Each Power Drive required approx 650 meters of walking to retrieve components from Stores, yard area and Factory 1 at 27 Walker St for nameplate engraving. This equated to 1.62 klms per day.
- Version 4 of Operator Sequencing Further reductions were expected when the walking distances were reduced with the new cell layout. The team used the combination work chart and spaghetti chart To reduce cycle time Decide correct sequence of standard work Synchronise sub assembly and main assembly operations Reduce operator movement
- Cell design The team decided on a U shaped counterclockwise cell layout Ergonomically positioned part racks in easy reach of operators Modified jigs and fixtures Dedicated drilling machines for each operation to reduce jig set up times Lift trolleys for ease of access and movement of the assembly around the cell
- A white board was introduced to allow the management walk around and operators to track orders to ensure progress was on time.
- Improvements included: Dedicated drills to eliminate jig set up time Dedicated fastener and tool trolleys New benches for component storage and ease of access. Adjustable trolleys for ease of operators to manipulate components from storage locations.
- Result of the new cell design and counterclockwise one piece flow layout.
- Results Results allowed the cell operators to keep up with the required TAKT time for Energy Australia deliveries. The more significant results were: Required area reduction of 24% Cycle time reduction of 48% Crew size reduction of 25% and will hopefully soon reach 50% reduction Inventory and WIP remained the same as the scheduling process still operates to purchase components Productivity increase of 66%.
- Greg - Slide 13 To do There are still further improvements to be investigated such as: Shaft and stop design to remove the welding process Chain cut to length by subcontractor Din rail cutter which has already been implemented New crane to eliminate sharing with Ergon Supply and install of the electrical loom which is our main constraint or our ‘Drum beat’ Hand over to continuous improvement team The cell operators have already listed various other improvements on their whiteboard.