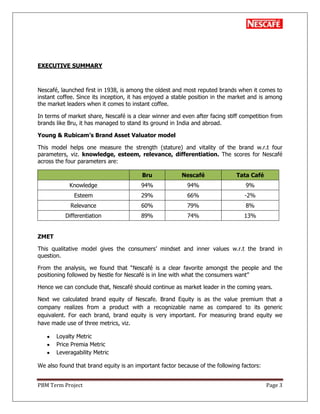
SlideShare a Scribd company logo
1 of 60
PBM Term Project Page 1
Praxis Business School
Project 1: Brand Tracker
A report submitted to
Prof. Srinivas Govindrajan
In partial fulfillment of the requirements of the course
Product & Brand Management
On 15/09/2013
By
Ankan Jyoti Bhattacharyya (B12010)
Lakshman Singh (B12021)
Subhra Dutta (B12050)
Sunil Manchandia (B12051)
PBM Term Project Page 2
S_No Table of Contents Page No.
1 Executive Summary 3
2 Brief History of the Brand 6
3 Quantative Research (BAV) 12
4 Qualitative Research (ZMET) 21
5 Brand Equity: A Definition 27
6 Brand Equity Measurement: the Logic 28
10 Brand Equity v/s Brand Value 30
11 Techniques of Brand Equity Measurement (BEM) 31
12 Tool employed for BEM 36
13 Analysis of Data Collected 39
15 Brand Valuation Basics 47
16 InterBrand Model 50
17 Analysis of the Data (finding RBI, BSS, Brand Value) 55
18 Inferences and Recommendations 58
19 References 59
PBM Term Project Page 3
EXECUTIVE SUMMARY
Nescafé, launched first in 1938, is among the oldest and most reputed brands when it comes to
instant coffee. Since its inception, it has enjoyed a stable position in the market and is among
the market leaders when it comes to instant coffee.
In terms of market share, Nescafé is a clear winner and even after facing stiff competition from
brands like Bru, it has managed to stand its ground in India and abroad.
Young & Rubicam‟s Brand Asset Valuator model
This model helps one measure the strength (stature) and vitality of the brand w.r.t four
parameters, viz. knowledge, esteem, relevance, differentiation. The scores for Nescafé
across the four parameters are:
Bru Nescafé Tata Café
Knowledge 94% 94% 9%
Esteem 29% 66% -2%
Relevance 60% 79% 8%
Differentiation 89% 74% 13%
ZMET
This qualitative model gives the consumers‘ mindset and inner values w.r.t the brand in
question.
From the analysis, we found that ―Nescafé is a clear favorite amongst the people and the
positioning followed by Nestle for Nescafé is in line with what the consumers want‖
Hence we can conclude that, Nescafé should continue as market leader in the coming years.
Next we calculated brand equity of Nescafe. Brand Equity is as the value premium that a
company realizes from a product with a recognizable name as compared to its generic
equivalent. For each brand, brand equity is very important. For measuring brand equity we
have made use of three metrics, viz.
Loyalty Metric
Price Premia Metric
Leveragability Metric
We also found that brand equity is an important factor because of the following factors:
PBM Term Project Page 4
Understand drivers of brand strength in order to support strategic decision making
To evaluate performance of brand management in increasing equity over time
To evaluate efficacy of brand building programs
To assess the value of the brand for purposes of licensing or sale
We used a structured questionnaire to understand the consumer‘s perception towards Nescafe
and other competing brands.
To measure loyalty we used the Colombo Morrison model and the Shared Tier model. The first
model revealed that Nescafe has a loyalty value of 48.75% while the second model revealed
that the majority of consumers of Nescafe lie in the Q1P1 and Q1P2 segment which means
that the loyalty for Nescafe is more sustainable in the long run.
To measure price premia we used the Van Westendorp PSM and it measured the price
sensitivity for different brands and generated a price premia index of 1.29. Also among
different brands Nescafe was the most selected as the brand for which customers were willing
to pay ―whatever it costs‖.
To measure leveragability we used the Millward Brown Brand Optimor model (BrandZ™). This
model measured the elasticity of the brands across categories and here also Nescafe scored the
highest 2.35 (across categories) and 2.97 (in associated categories) & 1.73 (in no related
categories).
From the data collected in the different segments we calculated a Brand Equity Index (BEI)
using the WINNING B®ANDS™ model of The Nielsen Company. The BEI for Nescafe was
found to be 0.980.
Next step was valuing the brand Nescafe.
The 1980‘s saw a rise in M&A‘s wherein companies were paying a premium for acquiring
companies. This premium was at times far greater than the actual book value of the company.
To understand this research was conducted and it was found that this premium was more due
to the brands in the company which hiked the price paid. This led to the concept of brand
valuation and companies started looking more closely at this method.
There are many techniques to brand valuation which are roughly categorized as research
based approach and financial based approach. Of the different methods under each
approach, InterBrand‘s valuation technique is the closest to measuring the actual value of the
brand.
The InterBrand method makes use of three pillars to arrive at brand value. These are viz.
financial performance of the organization, role of the brand in the purchase decision and
strength of the brand to ensure continued and certain cash flows. For the purpose of our
research we used this method with minor variations. We have assigned different weights to the
components of the model as per the importance of the component in the brand‘s lifecycle.
PBM Term Project Page 5
The balance sheet of Nescafe was analyzed to predict profits for the brand in the future. The
growth rate for the future has been taken as the percentage contribution of Nescafe towards
the sales of Nestle (equal to 12%). The sales of Nestle have been projected as per the
estimated values given (10.2%).
For calculating the RBI and BSS we took a sample to test the brands on the components of the
InterBrand model, we used a structured questionnaire to collect data on a sample size of 31
individuals.
Calculating the economic profit and discounting it subsequently by the discount rate we arrived
at the brand value of US$ 17.48 billion. The RBI was found to be 87.16% and BSS was
found to be 86.97%.
Our recommendation for the brand is that Nescafe should keep its present status and try to
understand its consumers better.
PBM Term Project Page 6
BRIEF HISTORY OF THE BRAND
 HISTORY & PRODUCT RANGE
“A Nestlé brand that started as an idea to solve the problem of what to do with
unsold coffee”
Nescafé is a brand of instant coffee made by Nestlé. It comes in many different product forms.
The name is a portmanteau of the words "Nestlé" and "café‖.
(First print ad of Nescafé)
(Initial Ads of Nescafé)
PBM Term Project Page 7
In 1929, Louis Dapples, the Nestle Chairman at the time, was presented
with and interesting task by his former employer, the Banque Française et
Italienne pour l‘Amérique du Sud.
Following the Wall Street Crash and the collapse of coffee prices, the bank
had a lot of coffee sitting unsold in warehouses in Brazil and Nestle was
asked to turn this stock into ―soluble coffee cubes‖ to be sold to
consumers. A chemist Dr Max Morgenthaler joined the company to help its
researchers find a solution. After three years of research they discovered
that café au lait – coffee mixed with milk and sugar- converted into
powder kept its flavor for longer. But this powder was not easily soluble,
and the milk and sugar caused production challenges.
Dr Morgenthaler concluded that the secret of preserving the coffee aroma lay in creating a
soluble coffee with enough carbohydrates. This was anew thought and went against the
conventional way.
A year later he used a specific technique to produce a powder that did this, and presented it to
the Nestlé Executive Board and technical directors as drinkable soluble coffee samples.
Two years later on April 1, 1938, the soluble coffee product, named Nescafé, was launched in
Switzerland. Nestlé set up a large-scale production line of coffee extraction and „spray
drying‟ coffee beans to produce Nescafé at its factory in the Swiss town of Orbe.
The brand was then rolled out in the United Kingdom two months later and by 1939, Nescafé
had reached the United States of America. By April 1940, Nescafé was present in 30 countries
worldwide.
During the Second World War, three quarters of consumption of Nescafé came from
Switzerland, UK and the USA. The primary reason for this was Nescafé‘s shelf life which was
longer than fresh coffee and this made Nescafé a hot favorite. Its sales figures doubled and
bulk of its production was provided to the US Troops as ration. To meet this growing demand,
in 1943, Nestle set up two factories in the US
In 1952, the Nescafé factory at St. Menet, France produced another innovation in the form of a
coffee powder that didn‘t require any carbohydrates. During 1960‘s it was re-launched in
Europe and Japan in glass containers to help preserve the freshness. This is the present
Nescafé Classic variant.
PBM Term Project Page 8
Later, Nestlé introduced a new brand in the US called "Taster's Choice", which supplanted
Nescafé for many years. Taster's Choice was also introduced into Canada at the same time, and
continues to be sold as a separate product, branded as superior to Nescafé, and is higher
priced.
PBM Term Project Page 9
In 1965, the brand launched another new product Nescafé Gold which was a freeze dried
soluble coffee.
Over the decades, Nescafé has expanded the portfolio of soluble coffee recipes by creating an
array of varieties viz. Nescafé Decaffeinated, Nescafé Gold Espresso, Nescafé Frappé,
Nescafé Cappuccino and Nescafé Ready-to-Drink.
In the 1990‘s the researchers developed a proprietary self foaming solution to improve the
texture of the milk froth and this formulation is now being used in Nescafé Cappuccino.
Nescafé also entered the coffee machine market in 2006 with the introduction of Nescafé
Dolce Gusto in Switzerland, Germany and UK. By 2007, they had also entered the Spanish
market.
The ―coffee shop-at-home‖ machine can switch from hot to cold. Nescafé, Nestea and Nesquik
capsules are available for the five machine ranges including Melody, Circolo, Piccolo,
Fontana, and Creativa. (Seen in the figure below)
PBM Term Project Page 10
Two years later Nescafé Barista, which is available exclusively in Japan, was developed as the
only ―at-home coffee by the cup‖ system of its kind that uses soluble coffee.
 ADVERTISEMENTS & POSTIONING
Nescafé has always positioned itself as the first instant coffee brand and its advertisements
have always portrayed relationships and creativity as the major themes. The initial
advertisements always emphasized on the benefits of using instant coffee over the conventional
fresh coffee.
The first Nescafé television ad featured Margaret Draper and portrayed how instant coffee
makes the life of a housewife simpler, came on air in the 1960s. In the United Kingdom,
a television advertisement campaign, the Gold blend ad starring Anthony Head and Sharon
Maughan ran in 12 installments between 1987 and 1993.
―The coffee with life in it. Made in just 5 seconds‖.
That‘s how Nescafé announced its entry into India in 1963. Before the ad campaign hit bill-
boards across the country, Indian coffee lovers were stuck with the idea that coffee is
something that takes minute attention to prepare and cannot be instant.
 COMPETITION
The main challenge for Nescafé in India is Hindustan Unilever‟s Bru, which is also been sold
in small sachets and packs to woo customers. Bru has in fact been given Nescafé a run for its
money and is banking on an old marketing mantra – straddling the pyramid. In simpler
parlance, offering a product at each price point. And Bru is fighting Nescafé everywhere.
PBM Term Project Page 11
So when Nescafé roped in Bollywood actor Deepika Padukone, Bru brought in its own brand
ambassadors, Shahid Kapoor and Priyanka Chopra.
But industry experts say both can co-exist for some time because of the low-level of penetration
of the drink. Compared to tea penetration at 96 per cent, coffee penetration is as low as 16
per cent.
(As per Business Standard report dated January 7, 2013 http://www.business-
standard.com/article/management/Nescafé-s-early-bird-advantage-113010700056_1.html)
PBM Term Project Page 12
QUANTITATIVE RESEARCH METHODOLOGY
(Using a variant of the Young &Rubicam‟s BRAND ASSET VALUATOR Model)
 THE BAV MODEL: AN INTRODUCTION
The BAV model is used to measure the position of the company in question vis-à-vis its
competitors. It is a proprietary tool of Young & Rubicam‟s and measures the consumer
perception across 4 pillars viz. Brand Knowledge, Brand Esteem (which together give the
brand‘s stature) and Brand Relevance, Brand Differentiation (which together give the
brand‘s vitality).
PBM Term Project Page 13
The various pillars of the BAV model can be defined as:
DIFFERENTIATION: the brand‘s unique identity w.r.t competition in the market
RELEVANCE: measure of how appropriate is the brand‘s offerings for the consumer
ESTEEM: measures how much respect and regard is given to the brand by
consumers
KNOWLEDGE: measures the extent of information or knowledge consumers have
regarding the brand
Each pillar is assigned a weightage of 100% and the weightage is distributed across the
questions pertaining to each pillar. So if brand esteem is measured using 2 questions then the
weightage of 100% would be divided amongst the questions either evenly or as per the
importance of the question in the overall framework.
 RESEARCH METHODOLOGY
o Type of Research: Primary research involving Quantitative techniques
o Sample Size: 40
o Target Group: instant coffee consumers in the age group of 21-30
o Sampling Technique: convenience sampling
o Interview Technique: CAPI (Computer Aided Personal Interviewing)
o Brands Selected: Nescafé, BRU, TATA Café
 QUESTIONNAIRE DESIGN
PBM Term Project Page 14
The following questionnaire was used for data collection:
(Brand knowledge)
1. Which brand comes to your mind when I say
“refreshing beverage”? (40%)
2. Identify the brands associated with these logos
(35%)
(DURING ANALYSIS, WE MERGED Q1 & Q2, AND TOOK THE WEIGHTAGE
AS 40+35=75%, TO AVOID DOUBLE CALCULATION)
3. Are you aware of the following brands? (25%)
Brand Code
BRU Cappucino 1
Nescafé Classic 2
BRU Exotica 3
Nescafé Sunrise 4
Nescafé Gold 5
BRU Gold 6
Mr. Bean 7
TATA Kaapi 8
(Brand Esteem)
4. When a friend comes over, which brand of coffee
do you usually prefer? (40%)
a. BRU
b. Nescafé
c. TATA Café
5. Which factors do you associate with the following
brands of coffee? (60%)
Attribute BRU Nescafé TATA Café
Prestigious
Optimistic
Confident
Humble
Dishonest
Arrogant
Rude
PBM Term Project Page 15
Unfriendly
(Brand Relevance)
6. For each brand, rate the attributes given on a 1-5
scale (1 being lowest, 5 being highest) (50%)
Good
Flavo
r
Bitternes
s
Strengt
h
Arom
a
Colo
r of
the
Brew
Frot
h
BRU
Nescaf
é
TATA
Cafe
7. Given below is a list of attributes. Select the
brand that best describes the attribute: (50%)
Attribute BRU Nescafé TATA Café
Has great
taste
Great aroma
Great with
company
Is easily
available
Has good
variety
Has better vfm
(Brand Differentiation)
8. What color are the packs of the following
brands? (50%)
Brands RED GREEN YELLOW BLUE BROWN
BRU
Nescafé
TATA Cafe
PBM Term Project Page 16
9. Identify the packs: (50%)
Brands CORRECT INCORRECT
BRU
Nescafé
TATA Cafe
 BAV METHODOLOGY
o Q1 to Q2 were brand awareness questions while Q3 was a question to test the
respondent‘s knowledge of the different variants. We assigned 40% to Q1, 35% to
Q2, 25% to Q3 thus making the cumulative total of brand knowledge 100%
o Q4 & Q5 were brand esteem questions and we assigned weightage of 40% to Q4
as it only gives an idea of which brand is preferred by the respondent. For Q5 we
assigned a weightage of 60% as by selecting the various personality attributes the
respondent gives us an idea of which brand he relates to
o Q6 & Q7 were brand relevance questions and we assigned 50% weightage to
both questions. Q6 measures ratings (in a 1-5 scale, 1 being lowest) given to various
attributes of coffee brand-wise and Q7 asks the respondent to match attributes to
brands (multiple choice allowed)
o Q8 & Q9 were brand differentiation questions and we assigned 50% weightage
to both the questions. We measured the extent of differentiation by asking the
respondent to select the color of the pack and identify the pack shots
Knowledge Measurement:
Brand Wise Awareness
Awareness Measure Bru Nescafé Tata Café Others
Tom 23% 78% 0% 0%
Spont 68% 23% 0% 13%
Aided 10% 0% 5% 0%
Total 100% 100% 5% 13%
PBM Term Project Page 17
Variant Wise Awareness
Brands BRU
Cappuccino
Nescafé
Classic
BRU
Exotica
Nescafé
Sunrise
Nescafé
Gold
BRU
Gold
Mr.
Bean
TATA
Kaapi
#
Respondents 40 38 22 29 25 28 11 6
%-age 100% 95% 55% 73% 63% 70% 28% 15%
Esteem Measurement:
Preference of Brands
Brand Name #Respondents
Weighted %-age
(%-age * 0.4)
Bru 6 6.00%
Nescafé 34 34.00%
Tata Café 0 0.00%
Personality Trait Association
We selected both positive and negative personality traits (4 traits each) to get a clearer picture
of how the respondent feels w.r.t different brands. At the time of analysis, we found the
percentage of responses (out of 40) for each attribute. Then we added the positive and
negative attribute percentages separately and divided by 4. Then we multiplied by the weight
(60%) to the values and subtracted negative attribute percentages from positive attributes.
Attribute Bru Nescafé Tata Café Bru Nescafé Tata Café
Positive
Prestigious 18 33 3 45.0% 82.5% 7.5%
Optimistic 20 27 4 50.0% 67.5% 10.0%
Confident 20 27 2 50.0% 67.5% 5.0%
Humble 22 14 7 55.0% 35.0% 17.5%
Negative
Dishonest 3 2 6 7.5% 5.0% 15.0%
Arrogant 8 9 5 20.0% 22.5% 12.5%
Rude 3 3 4 7.5% 7.5% 10.0%
Unfriendly 4 3 7 10.0% 7.5% 17.5%
Positive Attribute (Sum) 200.0% 252.5% 40.0%
Negative Attribute (Sum) 45.0% 42.5% 55.0%
Positive Attribute (Sum)/4 50.00% 63.13% 10.00%
Negative Attribute (Sum)/4 11.25% 10.63% 13.75%
Weightage 30.00% 37.88% 6.00%
PBM Term Project Page 18
Weightage 6.75% 6.38% 8.25%
Positive-Negative 23.25% 31.50% -2.25%
Relevance Measurement:
Attribute Rating (on a 5 point scale, 1 being lowest)
We asked the respondents to rate the attributes on a 5 point scale and based on the responses
then we found the average rating for each attribute and how each brand scored on the overall.
Good
Flavor
Bitterness Strength Aroma
Color of
the Brew
Froth Avg
Weighted
Avg
(%-age*
0.50)
Bru 3.58 2.90 3.63 3.80 3.63 3.28 3.47 34.67%
Nescafé 4.23 3.15 4.05 4.25 3.93 3.88 3.91 39.13%
Tata Café 0.63 0.48 0.70 0.75 0.75 0.60 0.65 6.50%
Attribute Association
We asked the respondents to associate a set of attributes to the brands given. Respondents
had the option of selecting more than one brand
Attributes
Has
great
taste
Great
aroma
Great
with
company
Is easily
available
Has
good
variety
Has
better
VFM
Avg
Weighted
Avg
(Avg*0.5)
Bru 60.0% 65.0% 37.5% 55.0% 40.0% 47.5% 50.83% 25.42%
Nescafé 85.0% 70.0% 80.0% 92.5% 75.0% 75.0% 79.58% 39.79%
Tata Café 2.5% 0.0% 7.5% 2.5% 2.5% 2.5% 2.92% 1.46%
Differentiation Measurement:
Color Identification
Brand Red Green Yellow Blue Brown Weighted Avg(%-age*0.5)
Bru 3 31 1 1 4 38.8%
Nescafé 21 0 3 1 15 26.3%
Tata Café 0 4 1 1 2 2.5%
Pack Identification
PBM Term Project Page 19
Brand Correct Weighted Avg (Avg*0.5)
Bru 40 50.0%
Nescafé 38 47.5%
Tata Café 8 10.0%
 BAV ANALYSIS
Finally, after finding the values for the different pillars of BAV, we plot the different brands on
the various pillars.
Nescafé scores high on Knowledge which means that it has high awareness. It scores relatively
lower on Esteem which means it has lost the respect & regard over time. It still scores well on
Relevance & Differentiation.
Knowledge Esteem Relevance Differentiation
94%
66%
79%
74%
Nescafe
PBM Term Project Page 20
Bru scores high on Knowledge indicating high awareness. It fares very less in Esteem and
indicates that people do not hold this brand in very high regard. Its Relevance score is also low,
when compared to Nescafé, which means that Bru has not been able to understand the
consumer needs well. But it fares very high on Differentiation which means that people perceive
Bru as a highly differentiated brand.
TATA Café fares lowest on Knowledge and Esteem which indicates that the brand has very low
awareness and respect amongst customers. It fares lower than Bru & Nescafé on Relevance &
Differentiation which means that people do not perceive their product as a differentiated one
and they also feel that it doesn‘t understand their requirements well. This might also be a result
of the fact that it is not so prevalent in the Northern & Eastern regions of India.
Knowledge Esteem Relevance Differentiation
94%
29%
60%
89%
Bru
Knowledge Esteem Relevance Differentiation
9%
-2%
8%
13%
Tata Cafe
PBM Term Project Page 21
QUALITATIVE RESEARCH METHODOLOGY
(Using Zaltman‟s Metaphor Elicitation Technique or ZMET)
 ZMET HISTORY
ZMET is a qualitative research technique used to discover a person‘s conscious & unconscious
thoughts about a brand. It is conducted by asking the respondent to select pictures which
form a mental representation of the brand for him. Using the pictures as an entry point
or a metaphor for his feelings, the research is conducted to understand the softer aspects of
the brand. Pictures are an important tool because at times words can miss out certain feelings
which a picture can express better.
ZMET was founded in 1990 by Dr. Olson Zaltman while he was on vacation in Nepal. He asked
the residents of the village to click pictures to explain ―What life was like in their village‖.
After developing the pictures he went back and asked the villagers to explain the meaning of
each picture and the significance of each in their life.
PBM Term Project Page 22
 ZMET METHODOLOGY
o Type of Research: Primary research involving Qualitative techniques
o Sample Size: 10
o Target Group: instant coffee consumers in the age group of 21-30
Steps followed in ZMET were:
1. Select 10 pictures which would define the meaning of Nescafé for them
2. The respondent is then queried on the reasons for selecting the different pictures
3. Then the respondents were asked to select 5 pictures which were the best
representation of their feelings
4. Then the respondent was asked to explain the reasons for selecting the 5 pictures
and rejecting the remaining
5. Then they were asked to create a mental map by collating the pictures into one
image
 PICTORIAL ANALYSIS
The various pictures selected by the respondent are shown below along with the final analysis:
Respondent 1 Respondent 2
PBM Term Project Page 23
Respondent 3 Respondent 4
Respondent 5 Respondent 6
Respondent 7 Respondent 8
PBM Term Project Page 24
The following pictures/themes were found to be a common theme:
Respondent 9
Respondent 10
PBM Term Project Page 25
Friends, Friendship & F.R.I.E.N.D.S (10)
Coffee in the Morning & feeling of Refreshment (6)
PBM Term Project Page 26
Apart from these themes, a few common & recurring themes were: (each had 4 responses
each)
Sugar & Sweet Coffee (5)
Coffee Beans
PBM Term Project Page 27
Couples & Dating
Winter
NESCAFE- The Brand
PBM Term Project Page 28
From the above pictures, we can conclude that:
―Coffee is generally preferred with friends rather than family. Be it at CCD or any other
coffee shop, coffee is the preferred drink for people when it comes to sitting together, chatting
and other such types of gatherings and amongst different brands, Nescafé is the most preferred
brand when it comes to such occasions (especially at family gatherings)
People generally start off their day with a cup of coffee as they feel it‘s the best way to
refresh oneself. People also prefer coffee more in winters rather than summers, which can be a
function of the Indian climate. For summers they prefer cold coffee or any other cool drink such
as aerated soft drinks or lemon juice or even Ice-Tea. Coffee is also considered a great drink for
removing drowsiness, headache and helps students and working professionals alike concentrate
better on work or studies especially during exams or late night work.
When it comes to strength, people usually prefer medium strength coffee which is a bit
sweeter than the average cup of tea, though the preference changes according to regions as in
South India, people like stronger coffees.‖
For positioning their brand in India, Nescafé can make use of the following value propositions
which have been a central theme for all our ZMET respondents:
1. Company of friends or family
2. Feeling of happiness
3. Respect for family members
4. Feeling of achievement
5. Relaxing, either alone or with someone special
PBM Term Project Page 29
Brand Equity: A Definition
Brands represent enormously valuable pieces of legal property, capable of influencing consumer
behavior, being bought and sold, and providing the security of sustained future revenues to
their owner. The value directly or indirectly accrued by these various benefits is often called
brand equity (Kapferer, 2005; Keller, 2003)
In simpler terms it can be defined as the value premium that a company realizes from a
product with a recognizable name as compared to its generic equivalent.
Companies can create brand equity for their products by making them memorable, easily
recognizable and superior in quality and reliability. Mass marketing campaigns can also
help to create brand equity.
Brand equity is strategically crucial, but usually difficult to quantify. Many experts have
developed tools to analyze this asset, but there is no universally accepted way to measure it. As
one of the serial challenges that marketing professionals and academics find with the concept of
brand equity, the disconnect between quantitative and qualitative equity values is difficult
to reconcile.
Quantitative brand equity includes numerical values such as profit margins and market
share, but fails to capture qualitative elements such as prestige and associations of
interest.
PBM Term Project Page 30
Measuring Brand Equity: The Logic?
The value of a brand – and thus its equity – is ultimately derived in the marketplace from the
words and actions of consumers. Consumers decide with their purchases, based on whatever
factors they deem important, which brands have more equity than other brands. Although the
details of different approaches to conceptualize brand equity differ, they tend to share a
common core: All definitions typically either implicitly or explicitly rely on brand knowledge
structures in the minds of consumers – individuals or organizations – as the source or
foundation of brand equity. In other words, the real power of a brand is in the thoughts,
feelings, images, beliefs, attitudes, experiences and so on that exist in the minds of consumers.
This brand knowledge affects how consumers respond to products, prices, communications,
channels and other marketing activity – increasing or decreasing brand value in the process.
Along these lines, formally, customer-based brand equity has been defined as the differential
effect that consumer brand knowledge has on their response to brand marketing activity
(Keller, 2003).
Reasons to measure Brand Equity:
Understand drivers of brand strength in order to support strategic decision making
To evaluate performance of brand management in increasing equity over time
To evaluate efficacy of brand building programs
To assess the value of the brand for purposes of licensing or sale
The metrics derived from the brand equity measurement process, are important tools in each
stage of the brand strategy.
PBM Term Project Page 31
Brand Equity versus Brand Value:
Though at times the terms are used interchangeably, the term Brand Value actually refers to
the financial measure or value of the brand in question. It gives an idea to an outsider of the
value of the brand, where it been sold in the market (useful at times of M&A‘s). Brand Equity
is more to do with how the brand‘s image, perception, positioning etc. in the market impacts
the business side of the brand and how it ensures future cash flows for the company.
PBM Term Project Page 32
Techniques of Brand Equity measurement:
The techniques employed to measure brand equity make use of three metrics. They are:
Measure of Brand Loyalty
Measure of Price Premia
Measure of Brand Leveragability
Brand Loyalty:
Brand loyalty, in marketing, consists of a consumer's commitment to repurchase or
otherwise continue using the brand and can be demonstrated by repeated buying of a
product or service, or other positive behaviors such as word of mouth advocacy.
Brand loyalty is more than simple repurchasing, however. Customers may repurchase a brand
due to situational constraints (such as vendor lock-in), a lack of viable alternatives, or out of
convenience. Such loyalty is referred to as "spurious loyalty". True brand loyalty exists when
customers have a high relative attitude toward the brand which is then exhibited through
repurchase behavior. This type of loyalty can be a great asset to the firm: customers are willing
to pay higher prices, they may cost less to serve, and can bring new customers to the firm.
There are two dimensions in play when we discuss about brand loyalty. They are:
Usage Rate, i.e. the amount of usage subjected to a brand by the user. The
most common segmentation strategy of consumers, as per usage rates is into
―HEAVY‖, ―MEDIUM‖ and ―LIGHT‖ users of a brand
Commitment to the Brand, i.e. how ―committed‖ is the consumer towards
using his/her brand. Based on commitment the consumers are segmented as
―HARD CORE LOYALS (who buy the brand all the time)‖, ―SPLIT LOYALS (loyal to
two or three brands)‖, ―SHIFTING LOYALS (keeps moving from one brand to
another)‖ and ―SWITCHERS (no particular loyalty and keep looking for bargains
or value for money)‖.
The most common techniques employed to check brand loyalty whilst measuring brand equity
are the Colombo Morrison Model and the Shared Tier Model.
We discuss each measure in detail below:
PBM Term Project Page 33
COLOMBO MORRISON MODEL:
The Colombo Morrison model of brand loyalty measure makes use of two questions.
These are:
1. Which brand do you prefer?
2. Out of the last 3 (or 5) purchases, how many times have you purchased the
brand in question?
This model works best for products and brands wherein the level of loyalty is medium
to high.
The output of this model is represented as a 2X2 matrix as shown:
Preferred
Brand
Last Purchases
.. .. .. .. Row Total =
SHARE OF
PREFERENCES.. .. .. ..
Column Total =MARKET SHARES
This model makes use of two ratios viz. Gravity (given by Purchase/Preference) and
Focus (given by Preference/Purchase)
SHARED TIER MODEL:
The Shared Tier model makes use of four quality standards viz.
1. Q1= SUPERIOR
2. Q2= GOOD
3. Q3= ACCEPTABLE
4. Q4= POOR
The model also uses four price standards viz.
1. P1= PRICE IS NOT A BARRIER
2. P2= PRICE IS A MINOR BARRIER
3. P3= PRICE IS A MAJOR BARRIER
4. P4= PRICE IS AN ABSOLUTE BARRIER
These standards are used to map a brand into different price-quality segments and
based on the responses from consumers understand which segment is best suited for
the brand. An example would be if Nescafe and Bru both occupy the segment P1Q1 for
PBM Term Project Page 34
a consumer, then he is more likely to switch between brands, as he sees both brands as
the same, i.e. he is ―indifferent‖ to the brands.
Conversely, if a consumer has Nescafe as a P2Q1 brand and Bru as a P2Q2 brand,
then the makers of Nescafe can target this customer with price offers as he feels the
brand is superior but is probably not using it owing to price constraints.
Both these models when used together, give a clearer picture of the loyalty position of the
brand and also an idea of the means to be employed to retain the existing users of a brand.
For our study, we have combined the findings of both these models and painted a picture of the
loyalty levels for Nescafe and competitors.
Price Premia:
Brand equity is also what enables branded products or services to charge premium prices.
Many major brands are positioned as quality products, and many people are willing to pay more
for a quality product they are familiar with, particularly if the brand has an image with which
they would like to be associated. The challenge is to find the point where the premium price is
still acceptable in exchange for the confidence embedded in the brand. (Keegan – Moriarty –
Duncan 1995)
The price premium due to brand equity provides the additional price the firm is able to
charge currently for the brand, while holding the market share fixed. The market share and
price premiums constitute meaningful summary measures of brand equity because they closely
relate to brand profitability.
Primarily two models are used to gauge price premia. They are viz. the Van Westendorp
Price Sensitivity Meter & the Brand Price Trade-Off (BPTO) Model.
(http://lta.hse.fi/1999/1/lta_1999_01_a4.pdf)
VAN WESTENDORP PRICE SENSITIVITY METER (PSM):
This model is a market technique for determining consumer price preferences. It was
introduced in 1976 by Dutch economist Peter van Westendorp. The technique has
been used by a wide variety of researchers in the market research industry.
The assumption underlying PSM is that respondents are capable of envisioning a pricing
landscape and that price is an intrinsic measure of value or utility. Participants in a PSM
exercise are asked to identify price points at which they can infer a particular value to
the product or service under study.
PBM Term Project Page 35
The traditional model of PSM makes use of four price-related questions, which are then
evaluated as a series of four cumulative distributions, one distribution for each question.
The standard question formats can vary, but generally take the following form:
1. At what price would you consider the product to be so expensive that you would
not consider buying it? (Too expensive)
2. At what price would you consider the product to be priced so low that you would
feel the quality couldn‘t be very good? (Too cheap)
3. At what price would you consider the product starting to get expensive, so that it
is not out of the question, but you would have to give some thought to buying it?
(Expensive/High Side)
4. At what price would you consider the product to be a bargain—a great buy for the
money? (Cheap/Good Value)
(http://en.wikipedia.org/wiki/Van_Westendorp's_Price_Sensitivity_Meter)
BRAND PRICE TRADE-OFF (BPTO) MODEL:
Brand Price Trade-Off (BPTO) is a technique used to gain insight into expected
purchase behavior at various price points for competitive products.
Within the scope of the technique, the price ―attribute‖ is isolated and traded-off by the
respondents against all other fixed properties of the competitive products. Thus, during
the interview, the respondent is confronted with a limited number of products or
concepts. Each product is given a price and the respondent is asked which product
he/she would buy. Then the price of the product the respondent has chosen is raised
by a pre-determined increment, and the procedure is repeated several times.
The products remain unchanged and only the prices vary.
On the basis of the BPTO technique, conclusions can be drawn concerning expected
behavior in a competitive environment. It is also possible to estimate market shares,
given any combination of price levels.
(http://www.marketresponse.com/mmt-04-brandpricetradeoff.html)
For our study, we have used the Van Westendorp PSM model to test Nescafe for price premia
and price sensitivity. We have used a variation of the standard questions of the PSM model.
PBM Term Project Page 36
Brand Leveragability:
Brand leveragability is also known as brand elasticity and it represents the brand‘s ability to
stretch from one offering to another. (e.g., Apple's expansion from Computers—iMac to MP3
players—iPod to telecommunications—iPhone)
(http://www.blackcoffee.com/brand-related/brand-terms/E/elasticity)
Brand extensions are popular among brands wanting to leverage their position in the existing
category/market into other category/markets. Consumers tend to respond more favorably to
extensions that fit with their perceptions of the parent brand. Perceived fit is usually
higher for
Extensions in product categories close to the parent brand (Boush and Loken
1991)
Extensions in product categories in which an appealing attribute can be
supplied by the parent brand (Broniarczyk and Alba 1994)
Extensions that can be used with other products sold by the parent brand
(Aaker and Keller 1990)
Characteristics of the parent brand dictate the brand‘s elastic nature. Of particular importance is
the nature of the brand concept associated with the parent brand—prestige versus
functional (Park, Milberg, and Lawson 1991).
Brands positioned on the basis of prestige, such as Rolex, have abstract brand concepts
that are more elastic and can successfully expand into a variety of product categories, such as
clothing and accessories. In contrast, brands positioned on functional attributes, such as
Timex (reliability), are less elastic and are more successful if they extend to offerings that
conform to the functional nature of the brand.
(http://www.carlsonschool.umn.edu/assets/164421.pdf)
To gauge a brand‘s elastic ability, the most commonly used model is the Brand Optimor
Model of Millward Brown (brand name BrandZ™). Here the brand is tested across
different product categories on three variables:
APPROPRIATENESS
LIKELY LEADERSHIP
CONSIDERATION
The product categories selected are grouped into three classes, viz. Similar (Juice &Soft
Drinks), Associated (Laptops & Speakers) and No Relation (Jeans & Cars). If a brand
scores high in associated and no relation classes, it is considered to be a highly elastic
category.
PBM Term Project Page 37
For our study, we have made use of this model and classified the brands into associated and no
relation product categories for analysis purposes.
Tool employed for Brand Equity Measurement:
To measure the brand equity of Nescafe on the parameters stated above, we made use of a
structured questionnaire which tested the consumer‘s outlook towards the brand on the
parameters decided. The questionnaire is reproduced herewith:
GENERAL QUESTIONS:
Q.1.Which brands come to your mind when you think of
“Instant Coffee”?
Q.2. Which brands do you associate with the following
attributes?
Attribute BRU Nescafé TATA Café
Has great
taste
Great aroma
Great with
company
Is easily
available
Has good
variety
Has better
VFM
Q.3 Rank these instant coffee brand as per your overall
preference. (1 to best , 3 to last)
Brand Rank
BRU
Nescafé
TATA Café
PBM Term Project Page 38
Q.5 If you were to recommend a brand of coffee to
somebody, which brand would it be?
Brand Code
BRU 1
Nescafé 2
TATA Café 3
LOYALTY MEASURE–
COLOMBO MORRISON MODEL
1. What is your preferred brand of instant coffee?
Brand
BRU
Nescafé
TATA Café
2. Out of your last 3 purchases of instant coffee how
many times have you purchased the following brands?
Brand Purchase 1 Purchase 2 Purchase 3
BRU
Nescafé
TATA Café
Other
SHARE TIER MODEL
Q1 How would you rate the following brands on the basis
of quality (SUPERIOR = Q1, GOOD = Q2, ACCEPTABLE = Q3,
PBM Term Project Page 39
POOR = Q4) and price (PRICE NOT A BARRIER = P1, PRICE IS A
MINOR BARRIER = P2, PRICE IS A MAJOR BARRIER = P3, PRICE
IS AN ABSOLUTE BARRIER = P4)
Brand Quality Price
BRU
Nescafé
TATA Café
PRICE PREMIA MEASURE-
VAN WESTENDORP METHOD
3. Now I would like you to think about the price of
different brands of instant coffee. Kindly tell us which
of the following statements best describes how likely
you would be to buy your brand of instant coffee.
1. I would buy whatever it costs
2. I would buy even if it costs a lot
more than the cheapest brand
3. Even if it costs more than any
other brand
4. Even if it costs a bit more than the
cheapest brand I wouldn’t buy it at
all
5. Only if it costs the same as the
cheapest brand
Brand 1 2 3 4 5
BRU
Nescafé
TATA Café
PBM Term Project Page 40
LEVERAGABILITY –
BrandZ™ (MILLWARD BROWN OPTIMOR MODEL)
4. If the following brands enter into the following
categories, how would you rate your acceptance of the
brands? (5 being the highest and 1 being the lowest)
Bran
d
Sof
t
Drin
ks
Pe
ns
Edib
le
Oil
Biscu
its
Soa
ps
Chewi
ng
Gum
Lapt
op
Pota
to
Wafe
rs
BRU
Nesc
afé
TATA
Café
Analysis of Brand Equity Measurement Exercise:
Given below are the different findings from the brand equity measurement exercise undertaken
for our brand Nescafe.
Attribute Analysis:
We checked the brands for different attributes as given below, by asking respondents to select
the best suited brand:
Has great taste
Great aroma
Great with company
Is easily available
Has good variety
ASSOCIATED CATEGORIES
NO RELATION CATEGORIES
PBM Term Project Page 41
VFM
The importance of the different factors was found as shown in the table below:
Attribute Has great
taste
Great
aroma
Great with
company
Is easily
available
Has good
variety
VFM Total
BRU 20 14 8 12 9 14
Nescafé 31 30 29 35 31 30
TATA Café 2 3 5 1 1 4
Sum of responses 53 47 42 48 41 48 279
Importance of
factors 19.00% 16.85% 15.05% 17.20% 14.70% 17.20%
The different brands including Nescafe were tested across the different attributes and the
performance of the brands is as shown
Has great
taste
Great aroma Great with
company
Is easily
available
Has good
variety
VFM
19.00%
16.85%
15.05%
17.20%
14.70%
17.20%
Importance of Factors
Brands Has
great
taste
Great
aroma
Great with
company
Is easily
available
Has good
variety
VFM
BRU 3.80 2.36 1.20 2.06 1.32 2.41
Nescafé 5.89 5.05 4.37 6.02 4.56 5.16
TATA Café 0.38 0.51 0.75 0.17 0.15 0.69
PBM Term Project Page 42
Here also we can see that Nescafe scores highest in all attributes while TATA Café fares the
lowest, which can be attributed to the fact that it is not widely available.
Loyalty Analysis:
To measure the loyalty of the brands we used a combination of the Colombo Morrison model
and the Share Tier model. The findings of the research are as shown:
BrandFrequency of
purchase
Purchase 3 Purchase 2 Purchase 1 Did not Purchase Total
BRU 5 5 10 20
160
Nescafé 15 13 7 5
TATA Café 0 0 1 39
Other 0 1 2 37
3.80
2.36
1.20
2.06
1.32
2.41
5.89
5.05
4.37
6.02
4.56
5.16
0.38 0.51
0.75
0.17 0.15
0.69
Has great taste Great aroma Great with
company
Is easily available Has good variety VFM
BRU Nescafé TATA Café
PBM Term Project Page 43
Then we assigned weights to each of the purchases in the order of 3, 2, 1, and 0 respectively.
Then we found loyalty score for each brand. This is shown as follows:
Weighted 3 2 1 0 Sum Loyalty
BRU 15 10 10 0 35
21.88%
Nescafé 45 26 7 0 78 48.75%
TATA Café 0 0 1 0 1
0.63%
Other 0 2 2 0 4
2.50%
Using the Share Tier model we have calculated the loyalty as follows:
Total P1 P2 P3 P4
Q1 23 11 2 0
Q2 21 17 2 0
Q3 5 3 0 2
Q4 0 0 0 0
Bru P1 P2 P3 P4
Q1 3 5 1 0
Q2 12 12 0 0
Q3 3 0 0 0
Q4 0 0 0 0
Bru P1 P2 P3 P4
Q1 13.04% 45.45% 50.00% n/a
Q2 57.14% 70.59% 0.00% n/a
Q3 60.00% 0.00% n/a 0.00%
Q4 n/a n/a n/a n/a
Nescafe P1 P2 P3 P4
Q1 20 6 1 0
Q2 6 5 2 0
PBM Term Project Page 44
Q3 0 0 0 0
Q4 0 0 0 0
Nescafe P1 P2 P3 P4
Q1 86.96% 54.55% 50.00% n/a
Q2 28.57% 29.41% 100.00% n/a
Q3 0.00% 0.00% n/a 0.00%
Q4 n/a n/a n/a n/a
TataCafe P1 P2 P3 P4
Q1 0 0 0 0
Q2 3 0 0 0
Q3 2 3 0 2
Q4 0 0 0 0
TataCafe P1 P2 P3 P4
Q1 0.00% 0.00% 0.00% n/a
Q2 14.29% 0.00% 0.00% n/a
Q3 40.00% 100.00% n/a 100.00%
Q4 n/a n/a n/a n/a
(n/a represents columns with undefined values)
From analyzing the data from above, we can see that Nescafe‘s customers are primarily
centered around the Q1P1 & Q1P2 segment, who feel the quality of the brand is superior
and for them price is not a barrier or at best a minor barrier.
For customers in the Q1P3 segment we suggest price offers, as Bru also has equal
percentage of customers in this segment and if they enter into a price discount, customers
would shift to Bru seeing that they presume both brands to be of equivalent quality.
Nescafe has a large chunk of customers in the Q2P3 segment who feel even after Nescafe‘s
good quality the price of the brand is a major barrier. For these customers we suggest price
discounts which are not too extreme, so as to shift those to Q3/Q4 segments (quality suspect)
but bring them to P1/P2 segment.
PBM Term Project Page 45
Price Premia Analysis:
We checked the brands for ability to charge price premium using the Van Westendorp model.
We used the following statements to test the price sensitivity of the consumer‘s w.r.t Nescafe
and its competitors:
A. Whatever it costs
B. Even if it costs lot more than the cheapest brand
C. Even if it costs more than any other brand
D. Even if it costs a bit more than the cheapest brand I wouldn‘t buy it at all
E. Only if it costs the same as the cheapest brand
The performance of the different brands in this module is:
The ability to charge price premia is explained by the price premia index given below:
Brand Price Premia
BRU 0.89
Nescafé 1.29
TATA Café 0.66
Leveragability Analysis:
We checked the elasticity of Nescafe, Bru and TATA Café across the following product
categories:
0
2
4
6
8
10
12
14
16
18
A B C D E
4
8
10
7
11
16
10
9
3
2
0
4
5
17
14
BRU
Nescafé
TATA Café
PBM Term Project Page 46
Soft Drinks
Biscuits
Chewing Gum
Potato Wafers
Pens
Edible Oil
Soaps
Laptop
The categories have been further sub divided into two classes, viz. Associated & No
Relation. The product categories under each class are:
Associated:
Soft Drinks
Biscuits
Chewing Gum
Potato Wafers
No Relation:
Pens
Edible Oil
Soaps
Laptop
The scores for the brands across categories for elasticity and category vulnerability are as
shown below:
Brands
Associated No Relation Brand
Elasticity
Score
Soft
Drinks
Biscuits
Chewing
Gum
Potato
Wafers
Pens
Edible
Oil
Soaps Laptop
Bru 3.05 2.925 1.975 2.2 1.65 1.775 1.5 1.4 2.06
Nescafe 3.525 3.5 2.35 2.5 1.8 1.875 1.675 1.575 2.35
Tata Café 2.35 2.125 1.625 1.95 1.825 1.85 1.55 1.675 1.87
Mean(category
wise)
2.98 2.85 1.98 2.22 1.76 1.83 1.58 1.55
Mean(class-
wise)
2.36 1.68
(We have tabulated the mean score of each category w.r.t the different brands)
PBM Term Project Page 47
Going by the contents of the table, we can make the following conclusions:
Nescafe with a score of 2.35 is the most elastic brand when compared to Bru (2.06)
and TATA Café (1.87). But when we compare to standard value of 5 (indicating
most elastic brand) we can see that none of the brands are elastic enough to enter
different categories. TATA Café is the most inelastic brand.
Among categories, soft drinks (with a score of 2.98) is the most vulnerable followed
by biscuits (with a score of 2.85) while laptops are the most inelastic (with a score
of 1.55) followed by soaps (with a score of 1.58).
For the brands we studied associated categories is the best segment to enter since it
has a score 2.36.
On checking for elasticity across brands, we can see that not a single category is vulnerable
enough to be easily entered because the score should be nearer to 5 for the category to be
vulnerable. For all categories the highest score is 2.98 which is a fairly low score.
Checking the brands across classes we see:
Brands Associated No Relation
Bru 2.54 1.58
Nescafe 2.97 1.73
Tata Café 2.01 1.73
Here again we see Nescafe scores the highest with a score of 2.97 followed by Bru with a score
2.54 which is consistent with the previous findings.
We can conclude that Nescafe is the most elastic amongst the different instant coffee
brands and has the advantage of its brand name and trust generated amongst consumers. If it
wants to enter into some other category, then soft drink (with 3.525) and biscuits (with 3.5) is
the best sector to expand into.
WINNING B®ANDS™
To measure the brand equity index we made use of the model called WINNING B®ANDS™.
WINNING B®ANDS™ is the brand management service from The Nielsen Company that
measures the effect that ALL your marketing activity has on brand equity.
The issues that WINNING B®ANDS™ covers are comprehensive - from understanding the
category that brand competes in from the consumers perspective, through detailed brand
PBM Term Project Page 48
measurement, to an understanding of how the whole range of marketing activity has influenced
consumer perception of the brand.
Nielsen Winning Brands tracks the underlying strength of the relationship between the customer
and the brand, and uses this to create effective strategies to enhance that relationship. At the
same time, it provides monitoring to protect and improve the brand‘s health as often as is
required.
As per the data collected in the different segments we calculated a brand equity index as
shown:
Brand BRU Nescafé TATA Café
Recommended brand 9 29 2
Favorite brand 5 34 1
Recommended brand 0.225 0.725 0.05
Favorite brand 0.125 0.85 0.025
Loyalty 0.21875 0.4875 0.00625
Weights BRU Nescafé TATA Café
0.3 Weighted recommended brand 0.0675 0.2175 0.015
0.3 Weighted favorite brand 0.0375 0.255 0.0075
0.4 Weighted loyalty value 0.0875 0.195 0.0025
Net Loyalty 0.1925 0.6675 0.025
According to Winning Brands
Weights BRU Nescafé TATA Café
0.5 Net Loyalty 0.1925 0.6675 0.025
0.5 Ability to charge price premia 0.89 1.29 0.66
Brand Equity Index(BEI) 0.542 0.980 0.342
We assigned 30% importance to recommended brand & favorite brand of the respondent.
The overall loyalty score generated from purchases was given a weightage of 40% since that
reflects the actual buying behavior of the consumer and is a more durable measure of
consumer loyalty in the long run.
Based on the values we have calculated a BEI of 0.980 for our brand Nescafe.
PBM Term Project Page 49
BRAND VALUATION:
What are Brands?
―A distinguishing symbol, mark, logo, name, word, sentence or a combination of these items
that companies use to distinguish their product from others in the market.‖
That is how Investopedia™ describes a brand. A brand is a product, service, or concept that
is publicly distinguished from other products, services, or concepts so that it can be easily
communicated and usually marketed. A brand name is the name of the distinctive product,
service, or concept. Branding is the process of creating and disseminating the brand
name. Branding can be applied to the entire corporate identity as well as to individual product
and service names.
Brands are usually protected from use by others by securing a trademark or service mark
from an authorized agency, usually a government agency.
Why measure Brand Value?
A brand is an asset for the company and like all assets, it too is bound by the definition of an
asset i.e. a resource with economic value that an individual, corporation or country owns or
controls with the expectation that it will provide future benefit.
Brands are intangible assets which actually are the most important asset for some
companies. This is because of the economic impact that brands have. They influence the
choices of customers, employees, investors and government authorities. In a world of abundant
choices, such influence is crucial for commercial success and creation of shareholder value.
Competition in the marketplace has made the brand as the single most important factor when it
comes to differentiating between companies.
Strong brands enhance business performance primarily through their influence on three key
stakeholder groups:
Customers (current and prospective)
Employees
Investors
They influence customer choice and create loyalty; attract, retain, and motivate talent; and
lower the cost of financing. The influence of brands on current and prospective customers is a
particularly significant driver of economic value. By expressing their proposition
PBM Term Project Page 50
consistently brands help shape perceptions and, therefore, purchase behavior, making
products and services less substitutable. In this way, brands create demand, allowing their
owners to enjoy higher returns. Strong brands also create continuity of demand into the future,
thus making expected returns more likely – or less risky. Brands, therefore, create
economic value by generating higher returns and growth, and by mitigating risk.
Do Brands appear in the Balance Sheet?
Surprisingly, brands, even after being such important assets, do not appear in a company‘s
balance sheet. Only acquired brands are shown in the balance sheet (from the 1980‘s) which
was also the result of the fact that companies started to question the high premiums paid to
acquire companies during merger & acquisitions. This revealed that companies acquiring
companies with strong brands had to pay a hefty price and so these acquired brands were
allowed to appear on the acquiring company‘s balance sheet. But the company‘s own brands
can‟t be shown on the balance sheet.
What are the methods to measure Brand Value?
Financial values have to some extent always been attached to brands and to other intangible
assets, but it was only in the late 1980s that valuation approaches were established that could
fairly claim to understand and assess the specific value of brands.
Unlike other assets such as stocks, bonds, commodities and real estate, there is no active
market in brands that would provide comparable values. So to arrive at a value, primarily two
methods are employed
• Research-based brand equity evaluations
There are numerous brand equity models that use consumer research to assess the
relative performance of brands. They measure consumer behavior and attitudes
that have an impact on the economic performance of brands. They all try to explain,
interpret and measure consumers‟ perceptions that influence purchase
behavior. They include a wide range of perceptive measures such as different levels of
awareness (spontaneous & aided), knowledge, familiarity, relevance, specific image
attributes, purchase consideration, preference, satisfaction and recommendation. Some
models add behavioral measures such as market share and relative price.
PBM Term Project Page 51
• Financially driven brand equity evaluations
The financial models are subdivided into the following categories:
Cost based approach takes all costs incurred in building the brand into account and all
costs are added to arrive at the brand value. These measures are not quite successful as
there is no direct relation between brand value and the financial investments made into
the brand.
Book to Market approach is ideal for single brand companies (e.g. McD). Here book
value of the company is subtracted from the market capitalization to arrive at the
brand‘s value. The intrinsic flaw in this method is that it assumes that the brand‘s value
is only the excess of the book value and ignores the strength of the brand which also
adds a premium.
Discounted Cash Flow (DCF) approach is the method where the Net Present Value
(NPV) of the brand (arrived at by discounting the estimated cash flows) is taken to be
the brand and firm‘s value.
Price Premia approach the value is calculated as the net present value of future price
premiums that a branded product would command over an unbranded or generic
equivalent. However, the primary purpose of many brands is not necessarily to obtain a
price premium but rather to secure the highest level of future demand and herein lies
the flaw in this technique.
Economic Use approach combines brand equity and financial measures, and has
become the most widely recognized and accepted methodology for brand valuation. It
has been used in more than 3,500 brand valuations worldwide.
What are the uses of Brand Value measurement?
Brand value measurement is required in the following scenarios:
a) To assess the value of the company and its brands at the time of M&A
b) To decide on business investments and to benchmark performance by comparing brands
to other assets in the conventional fashion
c) To decide on investment decisions subject to a brand (like channel investments,
diversification etc.)
d) To arrive at the cost of licensing while interacting with third parties
e) To acquire funds from the market, by keeping brand as collateral
PBM Term Project Page 52
Now for our study, we shall discuss the InterBrand model of Brand Valuation which the model
we have used to measure our brand Nescafe.
INTERBRAND MODEL OF BRAND VALUATION
The value of a brand lies in its economic benefit – brand value is therefore defined as the
net present value of future earnings generated by the brand alone. InterBrand approach is
based on the following three economic functions:
1) The brand‘s function to create cost synergies
2) The brand‘s function to generate demand for the products and services
3) The brand‗s function to secure future demand and thus reduce operative and
financial risks.
The method employed to evaluate brands comprises five steps: segmentation, financial
analysis, demand analysis, brand strength analysis, and, finally, the calculation of the net
present value of brand earnings. This can be shown in a diagram as follows:
The different steps in the InterBrand model are explained as follows:
PBM Term Project Page 53
Segmentation: Consumers‘ purchasing behavior and attitudes towards brands differ
from one market sector to another, depending largely on product-, market- and distribution-
related factors. For this reason, the value of a brand can only be determined precisely through
the separate assessment of individual segments that represent a homogenous customer group.
Apart from this, brand management can only obtain the insights it needs to increase the brand‘s
value systematically if the brand has been evaluated in all its segments.
Financial Analysis: InterBrand brand valuation begins with an assessment of the
company's value and then determines the value contributed by the brand. The first step
towards isolating brand earnings from other forms of income is to determine the Economic
Value Added (EVA) which tells whether a company is able to generate returns that exceed
the costs of capital employed. As both value creation and its counterpart, risk, lie in the future,
the analysis is based on a five-year forecast of future revenues generated in the brand segment
being assessed.
Demand Analysis: In this step, InterBrand analyzes the brand‘s value chain and
identifies the position of the brand in the minds of customers. To determine the brand‘s share
of EVA, InterBrand examines what factors influence demand and motivate customers to
purchase. These factors are weighted in terms of their bearing on demand and for each; the
contributions of the specific associations with the brand are statistically calculated. The sum of
these brand contributions on the demand drivers is expressed as the Role of Brand
Index (RBI) which, multiplied with the EVA, yields the brand earnings.
Brand Strength Analysis: The stronger a brand, the lower is its risk, and thus the
more certain are future brand earnings. InterBrand assesses this risk by analyzing the strength
of a brand compared with its competitors on the basis of seven factors (i.e. market, stability,
brand leadership trend, brand support, diversification, and protection). In fact, a broad range of
measured attributes explains the seven factors and facilitates an all-round diagnosis of a
brand‘s competitive position. This step results in the Brand Strength Score (BSS).
Net Present Value Calculation: The economic value of future brand earnings is
inversely correlated with the brand‘s estimated risk and this risk is directly linked to brand
strength. The transformation of brand strength into brand risk (or into discount rate,)
is completed using an S-curve. The procedure reflects the dynamism of the market, where
brands at the extreme ends of the scale react differently from brands in the middle range as
regards changes in their strength. The strongest brands are discounted with the risk-free rate of
the total market while average-strength brands are discounted with the industry WACC (cost of
equity in the financial service industry). Discounting the forecast period (present value) and the
calculation of an annuity (terminal value) results in the total value of the brand.
PBM Term Project Page 54
This conversion using an S-Curve is shown below:
The InterBrand model measures a brand across the following components:
1. CLARITY: The brand's values, positioning and proposition must be clearly articulated
and shared across the organization, along with a clear view of its target audiences,
customer insights and drivers. It is vital that those within the organization know and
understand all of these elements, because everything that follows hinges on them.
Weightage assigned: 15%
2. COMMITMENT: A measure of an organization‘s internal commitment to/or belief in its
brand. Commitment is the extent to which the brand receives support in terms of time,
influence and investment.
Weightage assigned: 10%
3. PROTECTION: This component examines how secure a brand is across a number of
dimensions – from legal protection and proprietary ingredients to design, scale or
geographic spread.
Weightage assigned: 10%
4. AUTHENCITY: This component is about how soundly a brand is based on an internal
capability. Authenticity asks if a brand has a defined heritage and a well-grounded value
set, as well as if it can deliver against customers' expectations.
PBM Term Project Page 55
Weightage assigned: 10%
5. RESPONSIVENESS: This component looks at a brand‘s ability to adapt to market
changes, challenges and opportunities. The brand should have a desire and ability to
constantly evolve and renew itself.
Weightage assigned: 10%
6. RELEVANCE: This component estimates how well a brand fits with customer needs,
desires and decision criteria across all appropriate demographics and geographies.
Weightage assigned: 12%
7. DIFFERENTIATION: This is the degree to which customers perceive the brand to have
a positioning that is distinct from the competition.
Weightage assigned: 8%
8. CONSISTENCY: This measures the degree to which a brand is experienced without fail
across all touch-points and formats.
Weightage assigned: 5%
9. PRESENCE: This measures the degree to which a brand feels omnipresent and how
positively consumers, customers and opinion formers discuss it in both traditional and
social media.
Weightage assigned: 5%
10. UNDERSTANDING: Not only must customers recognize the brand, but there must also
be an in-depth understanding of its distinctive qualities and characteristics, as well as
those of the brand owner.
Weightage assigned: 15%
PBM Term Project Page 56
ANALYSIS OF NESCAFE USING InterBrand MODEL
How to get Role of Branding Index (RBI)?
We checked the brands (Nescafe, Bru, and TATA Café) across the components in the
InterBrand model (Clarity, Commitment, Protection etc.) on a 5-point scale. The average
value of each component for each brand is calculated. This score is then added for each brand
across each component. The sum is divided by the maximum value achievable by any brand 50
(score of maximum 5*10 components). The weights assigned to each component are not
applicable in this case. Based on these calculations, the Role of Branding Index (RBI) of
Nescafe and competitors is as shown:
Role of Branding Index
Nescafe Bru Tata Café
Sum 43.58 37.26 30.32
RBI 87.16% 74.52% 60.65%
How to get Brand Strength Score (BSS)?
The average values for each component per brand, is then multiplied by their respective
weights which have been assigned based on their relative importance from a brand‘s
perspective. Hence relevance has a weight of 12% while clarity has a weight of 15%. The
values after multiplication are then summed for each brand and divided by the maximum score
for any component i.e. 5. Based on these calculations, the Brand Strength Score (BSS) of
Nescafe and competitors is as shown:
0.00%
20.00%
40.00%
60.00%
80.00%
100.00%
Nescafe Bru Tata Café
Role of Branding Index
PBM Term Project Page 57
Brand Strength Score
Nescafe Bru Tata Café
Sum 4.35 3.71 3.03
BSS 86.97% 74.10% 60.70%
Taking the values calculated in each of these phases we then calculate the Economic Value
Added (EVA) for Nescafe which gives the value of the brand in the market.
How to arrive at EVA?
2013 2014 2015 2016 2017
Revenue (Nestle) 101,588.97 111,951.05 123,370.05 135,953.80 149,821.09
Revenue (Nescafe) 12,190.68 13,434.13 14,804.41 16,314.46 17,978.53
Cost of sales 6,217.25 6,851.40 7,550.25 8,320.37 9,169.05
Gross Margin 5,973.43 6,582.72 7,254.16 7,994.08 8,809.48
Marketing Costs 2,438.14 2,686.83 2,960.88 3,262.89 3,595.71
Depreciation 271.85 299.58 330.14 363.81 400.92
Distribution expenses 1,058.15 1,166.08 1,285.02 1,416.09 1,560.54
Research and development
costs 219.43 241.81 266.48 293.66 323.61
Other trading expenses 153.60 169.27 186.54 205.56 226.53
86.97%
74.10%
60.70%
0.00%
20.00%
40.00%
60.00%
80.00%
100.00%
Nescafe Bru Tata Café
Brand Strength Score
PBM Term Project Page 58
EBITA 1,832.26 2,019.15 2,225.10 2,452.06 2,702.17
Applicable taxes 18.01% 329.99 363.65 400.74 441.62 486.66
NOPAT (Net Operating
Profit After Tax) 1,502.27 1,655.50 1,824.36 2,010.45 2,215.51
Capital Employed 10,497.12 11,756.77 13,167.59 14,747.70 16,517.42
Working capital (425.76) (476.85) (534.07) (598.16) (669.94)
Net PPE 10,071.36 11,279.92 12,633.51 14,149.54 15,847.48
Capital Charge 8% 839.77 940.54 1,053.41 1,179.82 1,321.39
Intangible Earnings 662.50 714.96 770.95 830.63 894.12
Role of Branding Index 87.16%
Brand Earnings 577.44 623.17 671.97 723.99 779.32
Brand Strength Score 86.97%
Brand Discount Rate 5.50%
Discounted Brand Earnings 547.34 559.89 572.26 584.42 596.29
NPV (Net Present Value) of
Discounted Brand Earnings
(Years 1–5)
2,860.19
Long-term growth rate 1%
NPV of terminal Brand Value
(beyond Year 5) 13,383.36
BRAND VALUE (In millions of CHF) 16,243.55
PBM Term Project Page 59
Assumptions: (basic, rest in excel file)
Considering the fact that coffee has achieved a healthy value of penetration in global
markets, we have assumed a long term growth rate of 1% (to check for maturity in
the product category)
The capital charge is equal to the WACC value of 8%
The discount rate is taken as 5.5% which is the highest value of the risk-free
government bonds of the Switzerland bonds (since the balance sheet details have been
taken from the parent company which are in Swiss Franc (CHF))
Based on these assumptions, the brand value of Nescafe has been found to be CHF 16243.55
million which translates to US$17485.04 million (US$17.48 billion). This
value is in line with the valuation undertaken by Thomson Reuters Fundamentals and
Worldscope via FactSet Research Systems; Forbes.
(http://www.forbes.com/companies/nescafe/)
INFERENCES & RECOMMENDATIONS
1. Nescafe scored low on Understanding in comparison to other factors which means
that consumers feel that it might not be getting the perceptions of the consumers
correctly. We recommend that Nescafe work on this attribute.
2. The brand value of Nescafe was fairly high and in global indices it is ranked higher than
the parent company Nestle which shows the strength of the brand.
3. Bru is a close second in many aspects and Nescafe needs to work in this aspect. Being
the oldest instant coffee brand it needs to maintain its position.
4. Seeing the current status of Nescafe we can suggest that it should maintain it‘s hold
over the coffee market (i.e. DO NOTHING!).
PBM Term Project Page 60
REFERENCES AND BIBLIOGRAPHY
The Story - NESCAFÉ MY
NESCAFÉ | Life Without Compromise.
Nescafé Brand | Coffee and Beverage Industry | brandchannel.com
1938 Nescafé - The first drinkable instant coffee | Nestlé Global
Nescafé - Wikipedia, the free encyclopedia
Nescafé's early-bird advantage | Business Standard

More Related Content

What's hot

Chateau Margaux case study
Chateau Margaux case studyChateau Margaux case study
Chateau Margaux case studyMila Ioffe
 
Nescafe 2014 ad stp analysis
Nescafe 2014 ad stp analysisNescafe 2014 ad stp analysis
Nescafe 2014 ad stp analysisGomini Gupta
 
207043126 ikea-case-study-solution
207043126 ikea-case-study-solution207043126 ikea-case-study-solution
207043126 ikea-case-study-solutionhomeworkping7
 
H & M COMPANY PROFILE SUPPLY CHAIN MANAGEMENT H&M: Organization of Supply Cha...
H & M COMPANY PROFILE SUPPLY CHAIN MANAGEMENT H&M: Organization of Supply Cha...H & M COMPANY PROFILE SUPPLY CHAIN MANAGEMENT H&M: Organization of Supply Cha...
H & M COMPANY PROFILE SUPPLY CHAIN MANAGEMENT H&M: Organization of Supply Cha...Ajeenkya D Y Patil
 
Brand audit of Nestle
Brand audit of NestleBrand audit of Nestle
Brand audit of NestleAkasha Shafiq
 
H&M Strategic Recommendations in Depth
H&M Strategic Recommendations in DepthH&M Strategic Recommendations in Depth
H&M Strategic Recommendations in DepthVasiliki Evangelou
 
Tesco - Marketing Case Study
Tesco - Marketing Case StudyTesco - Marketing Case Study
Tesco - Marketing Case StudyChirag Mehta
 
How I have reached brand resonance with Nescafe
How I have reached brand resonance with NescafeHow I have reached brand resonance with Nescafe
How I have reached brand resonance with NescafeMrittika Mirza
 
Nescafe Blend 43 - Advertising, Media & Creative Brief
Nescafe Blend 43 - Advertising, Media & Creative BriefNescafe Blend 43 - Advertising, Media & Creative Brief
Nescafe Blend 43 - Advertising, Media & Creative BriefJaddan Bruhn
 
Brand,nestle
Brand,nestleBrand,nestle
Brand,nestleB.k. Das
 
BCG Matrix of Nestle
BCG Matrix of NestleBCG Matrix of Nestle
BCG Matrix of NestleMutahir Bilal
 
Nestlé Manage it Company
Nestlé Manage it CompanyNestlé Manage it Company
Nestlé Manage it CompanyTuyen moz2x
 
Value chain nestle analysis
Value chain nestle analysisValue chain nestle analysis
Value chain nestle analysisMohammad Alfian
 
Louis Vuitton in Japan
Louis Vuitton in JapanLouis Vuitton in Japan
Louis Vuitton in JapanRohan Bharaj
 
Beechtree Retail Marketing Strategy
Beechtree Retail Marketing StrategyBeechtree Retail Marketing Strategy
Beechtree Retail Marketing StrategyAffanRasheed4
 
Marketing plan of PUMA
Marketing plan of PUMAMarketing plan of PUMA
Marketing plan of PUMAvitusmaren
 

What's hot (20)

Cabo San Viejo
Cabo San ViejoCabo San Viejo
Cabo San Viejo
 
Chateau Margaux case study
Chateau Margaux case studyChateau Margaux case study
Chateau Margaux case study
 
Nescafe 2014 ad stp analysis
Nescafe 2014 ad stp analysisNescafe 2014 ad stp analysis
Nescafe 2014 ad stp analysis
 
207043126 ikea-case-study-solution
207043126 ikea-case-study-solution207043126 ikea-case-study-solution
207043126 ikea-case-study-solution
 
H & M COMPANY PROFILE SUPPLY CHAIN MANAGEMENT H&M: Organization of Supply Cha...
H & M COMPANY PROFILE SUPPLY CHAIN MANAGEMENT H&M: Organization of Supply Cha...H & M COMPANY PROFILE SUPPLY CHAIN MANAGEMENT H&M: Organization of Supply Cha...
H & M COMPANY PROFILE SUPPLY CHAIN MANAGEMENT H&M: Organization of Supply Cha...
 
Brand audit of Nestle
Brand audit of NestleBrand audit of Nestle
Brand audit of Nestle
 
H&M Strategic Recommendations in Depth
H&M Strategic Recommendations in DepthH&M Strategic Recommendations in Depth
H&M Strategic Recommendations in Depth
 
Tesco - Marketing Case Study
Tesco - Marketing Case StudyTesco - Marketing Case Study
Tesco - Marketing Case Study
 
Nescafe
NescafeNescafe
Nescafe
 
How I have reached brand resonance with Nescafe
How I have reached brand resonance with NescafeHow I have reached brand resonance with Nescafe
How I have reached brand resonance with Nescafe
 
Nescafe IMC
Nescafe IMCNescafe IMC
Nescafe IMC
 
Nescafe Blend 43 - Advertising, Media & Creative Brief
Nescafe Blend 43 - Advertising, Media & Creative BriefNescafe Blend 43 - Advertising, Media & Creative Brief
Nescafe Blend 43 - Advertising, Media & Creative Brief
 
Brand,nestle
Brand,nestleBrand,nestle
Brand,nestle
 
Fabindia
FabindiaFabindia
Fabindia
 
BCG Matrix of Nestle
BCG Matrix of NestleBCG Matrix of Nestle
BCG Matrix of Nestle
 
Nestlé Manage it Company
Nestlé Manage it CompanyNestlé Manage it Company
Nestlé Manage it Company
 
Value chain nestle analysis
Value chain nestle analysisValue chain nestle analysis
Value chain nestle analysis
 
Louis Vuitton in Japan
Louis Vuitton in JapanLouis Vuitton in Japan
Louis Vuitton in Japan
 
Beechtree Retail Marketing Strategy
Beechtree Retail Marketing StrategyBeechtree Retail Marketing Strategy
Beechtree Retail Marketing Strategy
 
Marketing plan of PUMA
Marketing plan of PUMAMarketing plan of PUMA
Marketing plan of PUMA
 

Viewers also liked

NESCAFÉ: Case Study
NESCAFÉ: Case StudyNESCAFÉ: Case Study
NESCAFÉ: Case StudyNewsworks
 
Coffee drinking: Nescafe Coffee
Coffee drinking: Nescafe CoffeeCoffee drinking: Nescafe Coffee
Coffee drinking: Nescafe CoffeeLena Argosino
 
MarketingCommunciationsFinal
MarketingCommunciationsFinalMarketingCommunciationsFinal
MarketingCommunciationsFinalZachary Lynch
 
Challenges and perspectives of the Arabica and Robusta value chains in Vietna...
Challenges and perspectives of the Arabica and Robusta value chains in Vietna...Challenges and perspectives of the Arabica and Robusta value chains in Vietna...
Challenges and perspectives of the Arabica and Robusta value chains in Vietna...World Agroforestry (ICRAF)
 
Project Coffee and 4C: Expanding an Inclusive Coffee Value Chain
Project Coffee and 4C: Expanding an Inclusive Coffee Value ChainProject Coffee and 4C: Expanding an Inclusive Coffee Value Chain
Project Coffee and 4C: Expanding an Inclusive Coffee Value ChainAgricultural Training Institute
 
Nescafe Gold
Nescafe GoldNescafe Gold
Nescafe Goldglenferry
 
Nescafe SWOT
Nescafe SWOTNescafe SWOT
Nescafe SWOTminie747
 
Rice Crop Manager: Innovative ICT Approach for Food Security
Rice Crop Manager: Innovative ICT Approach for Food SecurityRice Crop Manager: Innovative ICT Approach for Food Security
Rice Crop Manager: Innovative ICT Approach for Food SecurityAgricultural Training Institute
 
Supply Chain Analysis of Nestle
Supply Chain Analysis of NestleSupply Chain Analysis of Nestle
Supply Chain Analysis of Nestlealok kumar
 
Porter's Five Forces Model and Porter's Value Chain of Nestle
Porter's Five Forces Model and Porter's Value Chain of NestlePorter's Five Forces Model and Porter's Value Chain of Nestle
Porter's Five Forces Model and Porter's Value Chain of NestleSubrienna Othman
 
Essence of Marketing - BRU Coffee
Essence of Marketing - BRU CoffeeEssence of Marketing - BRU Coffee
Essence of Marketing - BRU CoffeeSheikh_Rehmat
 
Case Study - Apple Inc.
Case Study - Apple Inc.Case Study - Apple Inc.
Case Study - Apple Inc.SofiaDZ
 
Apple inc. Strategic Case Analysis
Apple inc. Strategic Case AnalysisApple inc. Strategic Case Analysis
Apple inc. Strategic Case AnalysisMahy Helal
 
Apple inc. Strategic Case Analysis Presentation
Apple inc. Strategic Case Analysis PresentationApple inc. Strategic Case Analysis Presentation
Apple inc. Strategic Case Analysis PresentationMahy Helal
 

Viewers also liked (20)

NESCAFÉ: Case Study
NESCAFÉ: Case StudyNESCAFÉ: Case Study
NESCAFÉ: Case Study
 
Nescafe entrepreneur
Nescafe entrepreneurNescafe entrepreneur
Nescafe entrepreneur
 
Group 7
Group 7Group 7
Group 7
 
Coffee drinking: Nescafe Coffee
Coffee drinking: Nescafe CoffeeCoffee drinking: Nescafe Coffee
Coffee drinking: Nescafe Coffee
 
MarketingCommunciationsFinal
MarketingCommunciationsFinalMarketingCommunciationsFinal
MarketingCommunciationsFinal
 
Challenges and perspectives of the Arabica and Robusta value chains in Vietna...
Challenges and perspectives of the Arabica and Robusta value chains in Vietna...Challenges and perspectives of the Arabica and Robusta value chains in Vietna...
Challenges and perspectives of the Arabica and Robusta value chains in Vietna...
 
Project Coffee and 4C: Expanding an Inclusive Coffee Value Chain
Project Coffee and 4C: Expanding an Inclusive Coffee Value ChainProject Coffee and 4C: Expanding an Inclusive Coffee Value Chain
Project Coffee and 4C: Expanding an Inclusive Coffee Value Chain
 
Nescafe
NescafeNescafe
Nescafe
 
Akansha sareennescafe
Akansha sareennescafeAkansha sareennescafe
Akansha sareennescafe
 
Nescafe Gold
Nescafe GoldNescafe Gold
Nescafe Gold
 
Nescafe SWOT
Nescafe SWOTNescafe SWOT
Nescafe SWOT
 
Rice Crop Manager: Innovative ICT Approach for Food Security
Rice Crop Manager: Innovative ICT Approach for Food SecurityRice Crop Manager: Innovative ICT Approach for Food Security
Rice Crop Manager: Innovative ICT Approach for Food Security
 
Supply Chain Analysis of Nestle
Supply Chain Analysis of NestleSupply Chain Analysis of Nestle
Supply Chain Analysis of Nestle
 
Apple supply chain analysis
Apple supply chain analysisApple supply chain analysis
Apple supply chain analysis
 
Porter's Five Forces Model and Porter's Value Chain of Nestle
Porter's Five Forces Model and Porter's Value Chain of NestlePorter's Five Forces Model and Porter's Value Chain of Nestle
Porter's Five Forces Model and Porter's Value Chain of Nestle
 
Essence of Marketing - BRU Coffee
Essence of Marketing - BRU CoffeeEssence of Marketing - BRU Coffee
Essence of Marketing - BRU Coffee
 
Nescafe
NescafeNescafe
Nescafe
 
Case Study - Apple Inc.
Case Study - Apple Inc.Case Study - Apple Inc.
Case Study - Apple Inc.
 
Apple inc. Strategic Case Analysis
Apple inc. Strategic Case AnalysisApple inc. Strategic Case Analysis
Apple inc. Strategic Case Analysis
 
Apple inc. Strategic Case Analysis Presentation
Apple inc. Strategic Case Analysis PresentationApple inc. Strategic Case Analysis Presentation
Apple inc. Strategic Case Analysis Presentation
 

Similar to Pbm term project

report on consumer preference w.r.t to coffee
report on consumer preference w.r.t to coffeereport on consumer preference w.r.t to coffee
report on consumer preference w.r.t to coffeegauravishah90
 
Brand Driven CEO - Embedding Brand into Business Strategy_Dec 2016_ PRINT FINAL
Brand Driven CEO - Embedding Brand into Business Strategy_Dec 2016_ PRINT FINALBrand Driven CEO - Embedding Brand into Business Strategy_Dec 2016_ PRINT FINAL
Brand Driven CEO - Embedding Brand into Business Strategy_Dec 2016_ PRINT FINALMatthew Kelly
 
Medha Dairy Rebranding Case Study
Medha Dairy Rebranding Case StudyMedha Dairy Rebranding Case Study
Medha Dairy Rebranding Case StudySocial Samosa
 
Class Slides_ Brand Strategy & Planning.pdf
Class Slides_ Brand Strategy & Planning.pdfClass Slides_ Brand Strategy & Planning.pdf
Class Slides_ Brand Strategy & Planning.pdfAnand1963
 
Marketing Mix of Nestel
Marketing Mix of NestelMarketing Mix of Nestel
Marketing Mix of NestelSujan Sarker
 
Market Research on \'Nescafe MIld brand\'
Market Research on \'Nescafe MIld brand\'Market Research on \'Nescafe MIld brand\'
Market Research on \'Nescafe MIld brand\'depika
 
Situation AnalysisPrepared forTasty Baking CompanyFlower.docx
Situation AnalysisPrepared forTasty Baking CompanyFlower.docxSituation AnalysisPrepared forTasty Baking CompanyFlower.docx
Situation AnalysisPrepared forTasty Baking CompanyFlower.docxjennifer822
 
Wendell hall v 2.0 9-2011
Wendell hall v 2.0  9-2011Wendell hall v 2.0  9-2011
Wendell hall v 2.0 9-2011Wendell Hall
 
Nescafe 4 Ps of marketing mix and consumer research
Nescafe 4 Ps of marketing mix and consumer researchNescafe 4 Ps of marketing mix and consumer research
Nescafe 4 Ps of marketing mix and consumer researchDevansh Tiwari
 
premiumcollectible
premiumcollectiblepremiumcollectible
premiumcollectiblePMI Inc
 

Similar to Pbm term project (20)

Report
ReportReport
Report
 
Nescafe
NescafeNescafe
Nescafe
 
report on consumer preference w.r.t to coffee
report on consumer preference w.r.t to coffeereport on consumer preference w.r.t to coffee
report on consumer preference w.r.t to coffee
 
Brand Driven CEO - Embedding Brand into Business Strategy_Dec 2016_ PRINT FINAL
Brand Driven CEO - Embedding Brand into Business Strategy_Dec 2016_ PRINT FINALBrand Driven CEO - Embedding Brand into Business Strategy_Dec 2016_ PRINT FINAL
Brand Driven CEO - Embedding Brand into Business Strategy_Dec 2016_ PRINT FINAL
 
AllisonCupillariCV_2014_12
AllisonCupillariCV_2014_12AllisonCupillariCV_2014_12
AllisonCupillariCV_2014_12
 
Medha Dairy Rebranding Case Study
Medha Dairy Rebranding Case StudyMedha Dairy Rebranding Case Study
Medha Dairy Rebranding Case Study
 
Class Slides_ Brand Strategy & Planning.pdf
Class Slides_ Brand Strategy & Planning.pdfClass Slides_ Brand Strategy & Planning.pdf
Class Slides_ Brand Strategy & Planning.pdf
 
AllisonCupillariCV_2014_11
AllisonCupillariCV_2014_11AllisonCupillariCV_2014_11
AllisonCupillariCV_2014_11
 
Marketing Mix of Nestel
Marketing Mix of NestelMarketing Mix of Nestel
Marketing Mix of Nestel
 
Market Research on \'Nescafe MIld brand\'
Market Research on \'Nescafe MIld brand\'Market Research on \'Nescafe MIld brand\'
Market Research on \'Nescafe MIld brand\'
 
Marketing Mix of Nestle Company
Marketing Mix of Nestle Company Marketing Mix of Nestle Company
Marketing Mix of Nestle Company
 
Nestle India Ltd
Nestle India LtdNestle India Ltd
Nestle India Ltd
 
Situation AnalysisPrepared forTasty Baking CompanyFlower.docx
Situation AnalysisPrepared forTasty Baking CompanyFlower.docxSituation AnalysisPrepared forTasty Baking CompanyFlower.docx
Situation AnalysisPrepared forTasty Baking CompanyFlower.docx
 
Wendell hall v 2.0 9-2011
Wendell hall v 2.0  9-2011Wendell hall v 2.0  9-2011
Wendell hall v 2.0 9-2011
 
Nespresso case study
Nespresso case studyNespresso case study
Nespresso case study
 
Nescafe 4 Ps of marketing mix and consumer research
Nescafe 4 Ps of marketing mix and consumer researchNescafe 4 Ps of marketing mix and consumer research
Nescafe 4 Ps of marketing mix and consumer research
 
Fabtek
FabtekFabtek
Fabtek
 
Ray+Keshavan | The Brand Union – Manufacturing
Ray+Keshavan | The Brand Union – ManufacturingRay+Keshavan | The Brand Union – Manufacturing
Ray+Keshavan | The Brand Union – Manufacturing
 
premiumcollectible
premiumcollectiblepremiumcollectible
premiumcollectible
 
Marketing management total 2017
Marketing management total 2017Marketing management total 2017
Marketing management total 2017
 

More from Sunil Manchandia

More from Sunil Manchandia (6)

Ketchup brand extensiom
Ketchup brand extensiomKetchup brand extensiom
Ketchup brand extensiom
 
Brand dossier
Brand dossierBrand dossier
Brand dossier
 
Rem term project
Rem term projectRem term project
Rem term project
 
Microsoft excel
Microsoft excelMicrosoft excel
Microsoft excel
 
How india is managing its population
How india is managing its populationHow india is managing its population
How india is managing its population
 
Fdi in retail
Fdi in retailFdi in retail
Fdi in retail
 

Recently uploaded

Vip Dewas Call Girls #9907093804 Contact Number Escorts Service Dewas
Vip Dewas Call Girls #9907093804 Contact Number Escorts Service DewasVip Dewas Call Girls #9907093804 Contact Number Escorts Service Dewas
Vip Dewas Call Girls #9907093804 Contact Number Escorts Service Dewasmakika9823
 
Call Girls Navi Mumbai Just Call 9907093804 Top Class Call Girl Service Avail...
Call Girls Navi Mumbai Just Call 9907093804 Top Class Call Girl Service Avail...Call Girls Navi Mumbai Just Call 9907093804 Top Class Call Girl Service Avail...
Call Girls Navi Mumbai Just Call 9907093804 Top Class Call Girl Service Avail...Dipal Arora
 
Lowrate Call Girls In Sector 18 Noida ❤️8860477959 Escorts 100% Genuine Servi...
Lowrate Call Girls In Sector 18 Noida ❤️8860477959 Escorts 100% Genuine Servi...Lowrate Call Girls In Sector 18 Noida ❤️8860477959 Escorts 100% Genuine Servi...
Lowrate Call Girls In Sector 18 Noida ❤️8860477959 Escorts 100% Genuine Servi...lizamodels9
 
GD Birla and his contribution in management
GD Birla and his contribution in managementGD Birla and his contribution in management
GD Birla and his contribution in managementchhavia330
 
RE Capital's Visionary Leadership under Newman Leech
RE Capital's Visionary Leadership under Newman LeechRE Capital's Visionary Leadership under Newman Leech
RE Capital's Visionary Leadership under Newman LeechNewman George Leech
 
Non Text Magic Studio Magic Design for Presentations L&P.pptx
Non Text Magic Studio Magic Design for Presentations L&P.pptxNon Text Magic Studio Magic Design for Presentations L&P.pptx
Non Text Magic Studio Magic Design for Presentations L&P.pptxAbhayThakur200703
 
0183760ssssssssssssssssssssssssssss00101011 (27).pdf
0183760ssssssssssssssssssssssssssss00101011 (27).pdf0183760ssssssssssssssssssssssssssss00101011 (27).pdf
0183760ssssssssssssssssssssssssssss00101011 (27).pdfRenandantas16
 
Lowrate Call Girls In Laxmi Nagar Delhi ❤️8860477959 Escorts 100% Genuine Ser...
Lowrate Call Girls In Laxmi Nagar Delhi ❤️8860477959 Escorts 100% Genuine Ser...Lowrate Call Girls In Laxmi Nagar Delhi ❤️8860477959 Escorts 100% Genuine Ser...
Lowrate Call Girls In Laxmi Nagar Delhi ❤️8860477959 Escorts 100% Genuine Ser...lizamodels9
 
Pharma Works Profile of Karan Communications
Pharma Works Profile of Karan CommunicationsPharma Works Profile of Karan Communications
Pharma Works Profile of Karan Communicationskarancommunications
 
Catalogue ONG NUOC PPR DE NHAT .pdf
Catalogue ONG NUOC PPR DE NHAT      .pdfCatalogue ONG NUOC PPR DE NHAT      .pdf
Catalogue ONG NUOC PPR DE NHAT .pdfOrient Homes
 
A DAY IN THE LIFE OF A SALESMAN / WOMAN
A DAY IN THE LIFE OF A  SALESMAN / WOMANA DAY IN THE LIFE OF A  SALESMAN / WOMAN
A DAY IN THE LIFE OF A SALESMAN / WOMANIlamathiKannappan
 
Russian Faridabad Call Girls(Badarpur) : ☎ 8168257667, @4999
Russian Faridabad Call Girls(Badarpur) : ☎ 8168257667, @4999Russian Faridabad Call Girls(Badarpur) : ☎ 8168257667, @4999
Russian Faridabad Call Girls(Badarpur) : ☎ 8168257667, @4999Tina Ji
 
Insurers' journeys to build a mastery in the IoT usage
Insurers' journeys to build a mastery in the IoT usageInsurers' journeys to build a mastery in the IoT usage
Insurers' journeys to build a mastery in the IoT usageMatteo Carbone
 
Sales & Marketing Alignment: How to Synergize for Success
Sales & Marketing Alignment: How to Synergize for SuccessSales & Marketing Alignment: How to Synergize for Success
Sales & Marketing Alignment: How to Synergize for SuccessAggregage
 
Mondelez State of Snacking and Future Trends 2023
Mondelez State of Snacking and Future Trends 2023Mondelez State of Snacking and Future Trends 2023
Mondelez State of Snacking and Future Trends 2023Neil Kimberley
 
Progress Report - Oracle Database Analyst Summit
Progress  Report - Oracle Database Analyst SummitProgress  Report - Oracle Database Analyst Summit
Progress Report - Oracle Database Analyst SummitHolger Mueller
 
Call Girls In Connaught Place Delhi ❤️88604**77959_Russian 100% Genuine Escor...
Call Girls In Connaught Place Delhi ❤️88604**77959_Russian 100% Genuine Escor...Call Girls In Connaught Place Delhi ❤️88604**77959_Russian 100% Genuine Escor...
Call Girls In Connaught Place Delhi ❤️88604**77959_Russian 100% Genuine Escor...lizamodels9
 
Cash Payment 9602870969 Escort Service in Udaipur Call Girls
Cash Payment 9602870969 Escort Service in Udaipur Call GirlsCash Payment 9602870969 Escort Service in Udaipur Call Girls
Cash Payment 9602870969 Escort Service in Udaipur Call GirlsApsara Of India
 
Keppel Ltd. 1Q 2024 Business Update Presentation Slides
Keppel Ltd. 1Q 2024 Business Update  Presentation SlidesKeppel Ltd. 1Q 2024 Business Update  Presentation Slides
Keppel Ltd. 1Q 2024 Business Update Presentation SlidesKeppelCorporation
 

Recently uploaded (20)

Vip Dewas Call Girls #9907093804 Contact Number Escorts Service Dewas
Vip Dewas Call Girls #9907093804 Contact Number Escorts Service DewasVip Dewas Call Girls #9907093804 Contact Number Escorts Service Dewas
Vip Dewas Call Girls #9907093804 Contact Number Escorts Service Dewas
 
Call Girls Navi Mumbai Just Call 9907093804 Top Class Call Girl Service Avail...
Call Girls Navi Mumbai Just Call 9907093804 Top Class Call Girl Service Avail...Call Girls Navi Mumbai Just Call 9907093804 Top Class Call Girl Service Avail...
Call Girls Navi Mumbai Just Call 9907093804 Top Class Call Girl Service Avail...
 
Lowrate Call Girls In Sector 18 Noida ❤️8860477959 Escorts 100% Genuine Servi...
Lowrate Call Girls In Sector 18 Noida ❤️8860477959 Escorts 100% Genuine Servi...Lowrate Call Girls In Sector 18 Noida ❤️8860477959 Escorts 100% Genuine Servi...
Lowrate Call Girls In Sector 18 Noida ❤️8860477959 Escorts 100% Genuine Servi...
 
GD Birla and his contribution in management
GD Birla and his contribution in managementGD Birla and his contribution in management
GD Birla and his contribution in management
 
RE Capital's Visionary Leadership under Newman Leech
RE Capital's Visionary Leadership under Newman LeechRE Capital's Visionary Leadership under Newman Leech
RE Capital's Visionary Leadership under Newman Leech
 
Non Text Magic Studio Magic Design for Presentations L&P.pptx
Non Text Magic Studio Magic Design for Presentations L&P.pptxNon Text Magic Studio Magic Design for Presentations L&P.pptx
Non Text Magic Studio Magic Design for Presentations L&P.pptx
 
0183760ssssssssssssssssssssssssssss00101011 (27).pdf
0183760ssssssssssssssssssssssssssss00101011 (27).pdf0183760ssssssssssssssssssssssssssss00101011 (27).pdf
0183760ssssssssssssssssssssssssssss00101011 (27).pdf
 
Best Practices for Implementing an External Recruiting Partnership
Best Practices for Implementing an External Recruiting PartnershipBest Practices for Implementing an External Recruiting Partnership
Best Practices for Implementing an External Recruiting Partnership
 
Lowrate Call Girls In Laxmi Nagar Delhi ❤️8860477959 Escorts 100% Genuine Ser...
Lowrate Call Girls In Laxmi Nagar Delhi ❤️8860477959 Escorts 100% Genuine Ser...Lowrate Call Girls In Laxmi Nagar Delhi ❤️8860477959 Escorts 100% Genuine Ser...
Lowrate Call Girls In Laxmi Nagar Delhi ❤️8860477959 Escorts 100% Genuine Ser...
 
Pharma Works Profile of Karan Communications
Pharma Works Profile of Karan CommunicationsPharma Works Profile of Karan Communications
Pharma Works Profile of Karan Communications
 
Catalogue ONG NUOC PPR DE NHAT .pdf
Catalogue ONG NUOC PPR DE NHAT      .pdfCatalogue ONG NUOC PPR DE NHAT      .pdf
Catalogue ONG NUOC PPR DE NHAT .pdf
 
A DAY IN THE LIFE OF A SALESMAN / WOMAN
A DAY IN THE LIFE OF A  SALESMAN / WOMANA DAY IN THE LIFE OF A  SALESMAN / WOMAN
A DAY IN THE LIFE OF A SALESMAN / WOMAN
 
Russian Faridabad Call Girls(Badarpur) : ☎ 8168257667, @4999
Russian Faridabad Call Girls(Badarpur) : ☎ 8168257667, @4999Russian Faridabad Call Girls(Badarpur) : ☎ 8168257667, @4999
Russian Faridabad Call Girls(Badarpur) : ☎ 8168257667, @4999
 
Insurers' journeys to build a mastery in the IoT usage
Insurers' journeys to build a mastery in the IoT usageInsurers' journeys to build a mastery in the IoT usage
Insurers' journeys to build a mastery in the IoT usage
 
Sales & Marketing Alignment: How to Synergize for Success
Sales & Marketing Alignment: How to Synergize for SuccessSales & Marketing Alignment: How to Synergize for Success
Sales & Marketing Alignment: How to Synergize for Success
 
Mondelez State of Snacking and Future Trends 2023
Mondelez State of Snacking and Future Trends 2023Mondelez State of Snacking and Future Trends 2023
Mondelez State of Snacking and Future Trends 2023
 
Progress Report - Oracle Database Analyst Summit
Progress  Report - Oracle Database Analyst SummitProgress  Report - Oracle Database Analyst Summit
Progress Report - Oracle Database Analyst Summit
 
Call Girls In Connaught Place Delhi ❤️88604**77959_Russian 100% Genuine Escor...
Call Girls In Connaught Place Delhi ❤️88604**77959_Russian 100% Genuine Escor...Call Girls In Connaught Place Delhi ❤️88604**77959_Russian 100% Genuine Escor...
Call Girls In Connaught Place Delhi ❤️88604**77959_Russian 100% Genuine Escor...
 
Cash Payment 9602870969 Escort Service in Udaipur Call Girls
Cash Payment 9602870969 Escort Service in Udaipur Call GirlsCash Payment 9602870969 Escort Service in Udaipur Call Girls
Cash Payment 9602870969 Escort Service in Udaipur Call Girls
 
Keppel Ltd. 1Q 2024 Business Update Presentation Slides
Keppel Ltd. 1Q 2024 Business Update  Presentation SlidesKeppel Ltd. 1Q 2024 Business Update  Presentation Slides
Keppel Ltd. 1Q 2024 Business Update Presentation Slides
 

Pbm term project

  • 1. PBM Term Project Page 1 Praxis Business School Project 1: Brand Tracker A report submitted to Prof. Srinivas Govindrajan In partial fulfillment of the requirements of the course Product & Brand Management On 15/09/2013 By Ankan Jyoti Bhattacharyya (B12010) Lakshman Singh (B12021) Subhra Dutta (B12050) Sunil Manchandia (B12051)
  • 2. PBM Term Project Page 2 S_No Table of Contents Page No. 1 Executive Summary 3 2 Brief History of the Brand 6 3 Quantative Research (BAV) 12 4 Qualitative Research (ZMET) 21 5 Brand Equity: A Definition 27 6 Brand Equity Measurement: the Logic 28 10 Brand Equity v/s Brand Value 30 11 Techniques of Brand Equity Measurement (BEM) 31 12 Tool employed for BEM 36 13 Analysis of Data Collected 39 15 Brand Valuation Basics 47 16 InterBrand Model 50 17 Analysis of the Data (finding RBI, BSS, Brand Value) 55 18 Inferences and Recommendations 58 19 References 59
  • 3. PBM Term Project Page 3 EXECUTIVE SUMMARY Nescafé, launched first in 1938, is among the oldest and most reputed brands when it comes to instant coffee. Since its inception, it has enjoyed a stable position in the market and is among the market leaders when it comes to instant coffee. In terms of market share, Nescafé is a clear winner and even after facing stiff competition from brands like Bru, it has managed to stand its ground in India and abroad. Young & Rubicam‟s Brand Asset Valuator model This model helps one measure the strength (stature) and vitality of the brand w.r.t four parameters, viz. knowledge, esteem, relevance, differentiation. The scores for Nescafé across the four parameters are: Bru Nescafé Tata Café Knowledge 94% 94% 9% Esteem 29% 66% -2% Relevance 60% 79% 8% Differentiation 89% 74% 13% ZMET This qualitative model gives the consumers‘ mindset and inner values w.r.t the brand in question. From the analysis, we found that ―Nescafé is a clear favorite amongst the people and the positioning followed by Nestle for Nescafé is in line with what the consumers want‖ Hence we can conclude that, Nescafé should continue as market leader in the coming years. Next we calculated brand equity of Nescafe. Brand Equity is as the value premium that a company realizes from a product with a recognizable name as compared to its generic equivalent. For each brand, brand equity is very important. For measuring brand equity we have made use of three metrics, viz. Loyalty Metric Price Premia Metric Leveragability Metric We also found that brand equity is an important factor because of the following factors:
  • 4. PBM Term Project Page 4 Understand drivers of brand strength in order to support strategic decision making To evaluate performance of brand management in increasing equity over time To evaluate efficacy of brand building programs To assess the value of the brand for purposes of licensing or sale We used a structured questionnaire to understand the consumer‘s perception towards Nescafe and other competing brands. To measure loyalty we used the Colombo Morrison model and the Shared Tier model. The first model revealed that Nescafe has a loyalty value of 48.75% while the second model revealed that the majority of consumers of Nescafe lie in the Q1P1 and Q1P2 segment which means that the loyalty for Nescafe is more sustainable in the long run. To measure price premia we used the Van Westendorp PSM and it measured the price sensitivity for different brands and generated a price premia index of 1.29. Also among different brands Nescafe was the most selected as the brand for which customers were willing to pay ―whatever it costs‖. To measure leveragability we used the Millward Brown Brand Optimor model (BrandZ™). This model measured the elasticity of the brands across categories and here also Nescafe scored the highest 2.35 (across categories) and 2.97 (in associated categories) & 1.73 (in no related categories). From the data collected in the different segments we calculated a Brand Equity Index (BEI) using the WINNING B®ANDS™ model of The Nielsen Company. The BEI for Nescafe was found to be 0.980. Next step was valuing the brand Nescafe. The 1980‘s saw a rise in M&A‘s wherein companies were paying a premium for acquiring companies. This premium was at times far greater than the actual book value of the company. To understand this research was conducted and it was found that this premium was more due to the brands in the company which hiked the price paid. This led to the concept of brand valuation and companies started looking more closely at this method. There are many techniques to brand valuation which are roughly categorized as research based approach and financial based approach. Of the different methods under each approach, InterBrand‘s valuation technique is the closest to measuring the actual value of the brand. The InterBrand method makes use of three pillars to arrive at brand value. These are viz. financial performance of the organization, role of the brand in the purchase decision and strength of the brand to ensure continued and certain cash flows. For the purpose of our research we used this method with minor variations. We have assigned different weights to the components of the model as per the importance of the component in the brand‘s lifecycle.
  • 5. PBM Term Project Page 5 The balance sheet of Nescafe was analyzed to predict profits for the brand in the future. The growth rate for the future has been taken as the percentage contribution of Nescafe towards the sales of Nestle (equal to 12%). The sales of Nestle have been projected as per the estimated values given (10.2%). For calculating the RBI and BSS we took a sample to test the brands on the components of the InterBrand model, we used a structured questionnaire to collect data on a sample size of 31 individuals. Calculating the economic profit and discounting it subsequently by the discount rate we arrived at the brand value of US$ 17.48 billion. The RBI was found to be 87.16% and BSS was found to be 86.97%. Our recommendation for the brand is that Nescafe should keep its present status and try to understand its consumers better.
  • 6. PBM Term Project Page 6 BRIEF HISTORY OF THE BRAND  HISTORY & PRODUCT RANGE “A Nestlé brand that started as an idea to solve the problem of what to do with unsold coffee” Nescafé is a brand of instant coffee made by Nestlé. It comes in many different product forms. The name is a portmanteau of the words "Nestlé" and "café‖. (First print ad of Nescafé) (Initial Ads of Nescafé)
  • 7. PBM Term Project Page 7 In 1929, Louis Dapples, the Nestle Chairman at the time, was presented with and interesting task by his former employer, the Banque Française et Italienne pour l‘Amérique du Sud. Following the Wall Street Crash and the collapse of coffee prices, the bank had a lot of coffee sitting unsold in warehouses in Brazil and Nestle was asked to turn this stock into ―soluble coffee cubes‖ to be sold to consumers. A chemist Dr Max Morgenthaler joined the company to help its researchers find a solution. After three years of research they discovered that café au lait – coffee mixed with milk and sugar- converted into powder kept its flavor for longer. But this powder was not easily soluble, and the milk and sugar caused production challenges. Dr Morgenthaler concluded that the secret of preserving the coffee aroma lay in creating a soluble coffee with enough carbohydrates. This was anew thought and went against the conventional way. A year later he used a specific technique to produce a powder that did this, and presented it to the Nestlé Executive Board and technical directors as drinkable soluble coffee samples. Two years later on April 1, 1938, the soluble coffee product, named Nescafé, was launched in Switzerland. Nestlé set up a large-scale production line of coffee extraction and „spray drying‟ coffee beans to produce Nescafé at its factory in the Swiss town of Orbe. The brand was then rolled out in the United Kingdom two months later and by 1939, Nescafé had reached the United States of America. By April 1940, Nescafé was present in 30 countries worldwide. During the Second World War, three quarters of consumption of Nescafé came from Switzerland, UK and the USA. The primary reason for this was Nescafé‘s shelf life which was longer than fresh coffee and this made Nescafé a hot favorite. Its sales figures doubled and bulk of its production was provided to the US Troops as ration. To meet this growing demand, in 1943, Nestle set up two factories in the US In 1952, the Nescafé factory at St. Menet, France produced another innovation in the form of a coffee powder that didn‘t require any carbohydrates. During 1960‘s it was re-launched in Europe and Japan in glass containers to help preserve the freshness. This is the present Nescafé Classic variant.
  • 8. PBM Term Project Page 8 Later, Nestlé introduced a new brand in the US called "Taster's Choice", which supplanted Nescafé for many years. Taster's Choice was also introduced into Canada at the same time, and continues to be sold as a separate product, branded as superior to Nescafé, and is higher priced.
  • 9. PBM Term Project Page 9 In 1965, the brand launched another new product Nescafé Gold which was a freeze dried soluble coffee. Over the decades, Nescafé has expanded the portfolio of soluble coffee recipes by creating an array of varieties viz. Nescafé Decaffeinated, Nescafé Gold Espresso, Nescafé Frappé, Nescafé Cappuccino and Nescafé Ready-to-Drink. In the 1990‘s the researchers developed a proprietary self foaming solution to improve the texture of the milk froth and this formulation is now being used in Nescafé Cappuccino. Nescafé also entered the coffee machine market in 2006 with the introduction of Nescafé Dolce Gusto in Switzerland, Germany and UK. By 2007, they had also entered the Spanish market. The ―coffee shop-at-home‖ machine can switch from hot to cold. Nescafé, Nestea and Nesquik capsules are available for the five machine ranges including Melody, Circolo, Piccolo, Fontana, and Creativa. (Seen in the figure below)
  • 10. PBM Term Project Page 10 Two years later Nescafé Barista, which is available exclusively in Japan, was developed as the only ―at-home coffee by the cup‖ system of its kind that uses soluble coffee.  ADVERTISEMENTS & POSTIONING Nescafé has always positioned itself as the first instant coffee brand and its advertisements have always portrayed relationships and creativity as the major themes. The initial advertisements always emphasized on the benefits of using instant coffee over the conventional fresh coffee. The first Nescafé television ad featured Margaret Draper and portrayed how instant coffee makes the life of a housewife simpler, came on air in the 1960s. In the United Kingdom, a television advertisement campaign, the Gold blend ad starring Anthony Head and Sharon Maughan ran in 12 installments between 1987 and 1993. ―The coffee with life in it. Made in just 5 seconds‖. That‘s how Nescafé announced its entry into India in 1963. Before the ad campaign hit bill- boards across the country, Indian coffee lovers were stuck with the idea that coffee is something that takes minute attention to prepare and cannot be instant.  COMPETITION The main challenge for Nescafé in India is Hindustan Unilever‟s Bru, which is also been sold in small sachets and packs to woo customers. Bru has in fact been given Nescafé a run for its money and is banking on an old marketing mantra – straddling the pyramid. In simpler parlance, offering a product at each price point. And Bru is fighting Nescafé everywhere.
  • 11. PBM Term Project Page 11 So when Nescafé roped in Bollywood actor Deepika Padukone, Bru brought in its own brand ambassadors, Shahid Kapoor and Priyanka Chopra. But industry experts say both can co-exist for some time because of the low-level of penetration of the drink. Compared to tea penetration at 96 per cent, coffee penetration is as low as 16 per cent. (As per Business Standard report dated January 7, 2013 http://www.business- standard.com/article/management/Nescafé-s-early-bird-advantage-113010700056_1.html)
  • 12. PBM Term Project Page 12 QUANTITATIVE RESEARCH METHODOLOGY (Using a variant of the Young &Rubicam‟s BRAND ASSET VALUATOR Model)  THE BAV MODEL: AN INTRODUCTION The BAV model is used to measure the position of the company in question vis-à-vis its competitors. It is a proprietary tool of Young & Rubicam‟s and measures the consumer perception across 4 pillars viz. Brand Knowledge, Brand Esteem (which together give the brand‘s stature) and Brand Relevance, Brand Differentiation (which together give the brand‘s vitality).
  • 13. PBM Term Project Page 13 The various pillars of the BAV model can be defined as: DIFFERENTIATION: the brand‘s unique identity w.r.t competition in the market RELEVANCE: measure of how appropriate is the brand‘s offerings for the consumer ESTEEM: measures how much respect and regard is given to the brand by consumers KNOWLEDGE: measures the extent of information or knowledge consumers have regarding the brand Each pillar is assigned a weightage of 100% and the weightage is distributed across the questions pertaining to each pillar. So if brand esteem is measured using 2 questions then the weightage of 100% would be divided amongst the questions either evenly or as per the importance of the question in the overall framework.  RESEARCH METHODOLOGY o Type of Research: Primary research involving Quantitative techniques o Sample Size: 40 o Target Group: instant coffee consumers in the age group of 21-30 o Sampling Technique: convenience sampling o Interview Technique: CAPI (Computer Aided Personal Interviewing) o Brands Selected: Nescafé, BRU, TATA Café  QUESTIONNAIRE DESIGN
  • 14. PBM Term Project Page 14 The following questionnaire was used for data collection: (Brand knowledge) 1. Which brand comes to your mind when I say “refreshing beverage”? (40%) 2. Identify the brands associated with these logos (35%) (DURING ANALYSIS, WE MERGED Q1 & Q2, AND TOOK THE WEIGHTAGE AS 40+35=75%, TO AVOID DOUBLE CALCULATION) 3. Are you aware of the following brands? (25%) Brand Code BRU Cappucino 1 Nescafé Classic 2 BRU Exotica 3 Nescafé Sunrise 4 Nescafé Gold 5 BRU Gold 6 Mr. Bean 7 TATA Kaapi 8 (Brand Esteem) 4. When a friend comes over, which brand of coffee do you usually prefer? (40%) a. BRU b. Nescafé c. TATA Café 5. Which factors do you associate with the following brands of coffee? (60%) Attribute BRU Nescafé TATA Café Prestigious Optimistic Confident Humble Dishonest Arrogant Rude
  • 15. PBM Term Project Page 15 Unfriendly (Brand Relevance) 6. For each brand, rate the attributes given on a 1-5 scale (1 being lowest, 5 being highest) (50%) Good Flavo r Bitternes s Strengt h Arom a Colo r of the Brew Frot h BRU Nescaf é TATA Cafe 7. Given below is a list of attributes. Select the brand that best describes the attribute: (50%) Attribute BRU Nescafé TATA Café Has great taste Great aroma Great with company Is easily available Has good variety Has better vfm (Brand Differentiation) 8. What color are the packs of the following brands? (50%) Brands RED GREEN YELLOW BLUE BROWN BRU Nescafé TATA Cafe
  • 16. PBM Term Project Page 16 9. Identify the packs: (50%) Brands CORRECT INCORRECT BRU Nescafé TATA Cafe  BAV METHODOLOGY o Q1 to Q2 were brand awareness questions while Q3 was a question to test the respondent‘s knowledge of the different variants. We assigned 40% to Q1, 35% to Q2, 25% to Q3 thus making the cumulative total of brand knowledge 100% o Q4 & Q5 were brand esteem questions and we assigned weightage of 40% to Q4 as it only gives an idea of which brand is preferred by the respondent. For Q5 we assigned a weightage of 60% as by selecting the various personality attributes the respondent gives us an idea of which brand he relates to o Q6 & Q7 were brand relevance questions and we assigned 50% weightage to both questions. Q6 measures ratings (in a 1-5 scale, 1 being lowest) given to various attributes of coffee brand-wise and Q7 asks the respondent to match attributes to brands (multiple choice allowed) o Q8 & Q9 were brand differentiation questions and we assigned 50% weightage to both the questions. We measured the extent of differentiation by asking the respondent to select the color of the pack and identify the pack shots Knowledge Measurement: Brand Wise Awareness Awareness Measure Bru Nescafé Tata Café Others Tom 23% 78% 0% 0% Spont 68% 23% 0% 13% Aided 10% 0% 5% 0% Total 100% 100% 5% 13%
  • 17. PBM Term Project Page 17 Variant Wise Awareness Brands BRU Cappuccino Nescafé Classic BRU Exotica Nescafé Sunrise Nescafé Gold BRU Gold Mr. Bean TATA Kaapi # Respondents 40 38 22 29 25 28 11 6 %-age 100% 95% 55% 73% 63% 70% 28% 15% Esteem Measurement: Preference of Brands Brand Name #Respondents Weighted %-age (%-age * 0.4) Bru 6 6.00% Nescafé 34 34.00% Tata Café 0 0.00% Personality Trait Association We selected both positive and negative personality traits (4 traits each) to get a clearer picture of how the respondent feels w.r.t different brands. At the time of analysis, we found the percentage of responses (out of 40) for each attribute. Then we added the positive and negative attribute percentages separately and divided by 4. Then we multiplied by the weight (60%) to the values and subtracted negative attribute percentages from positive attributes. Attribute Bru Nescafé Tata Café Bru Nescafé Tata Café Positive Prestigious 18 33 3 45.0% 82.5% 7.5% Optimistic 20 27 4 50.0% 67.5% 10.0% Confident 20 27 2 50.0% 67.5% 5.0% Humble 22 14 7 55.0% 35.0% 17.5% Negative Dishonest 3 2 6 7.5% 5.0% 15.0% Arrogant 8 9 5 20.0% 22.5% 12.5% Rude 3 3 4 7.5% 7.5% 10.0% Unfriendly 4 3 7 10.0% 7.5% 17.5% Positive Attribute (Sum) 200.0% 252.5% 40.0% Negative Attribute (Sum) 45.0% 42.5% 55.0% Positive Attribute (Sum)/4 50.00% 63.13% 10.00% Negative Attribute (Sum)/4 11.25% 10.63% 13.75% Weightage 30.00% 37.88% 6.00%
  • 18. PBM Term Project Page 18 Weightage 6.75% 6.38% 8.25% Positive-Negative 23.25% 31.50% -2.25% Relevance Measurement: Attribute Rating (on a 5 point scale, 1 being lowest) We asked the respondents to rate the attributes on a 5 point scale and based on the responses then we found the average rating for each attribute and how each brand scored on the overall. Good Flavor Bitterness Strength Aroma Color of the Brew Froth Avg Weighted Avg (%-age* 0.50) Bru 3.58 2.90 3.63 3.80 3.63 3.28 3.47 34.67% Nescafé 4.23 3.15 4.05 4.25 3.93 3.88 3.91 39.13% Tata Café 0.63 0.48 0.70 0.75 0.75 0.60 0.65 6.50% Attribute Association We asked the respondents to associate a set of attributes to the brands given. Respondents had the option of selecting more than one brand Attributes Has great taste Great aroma Great with company Is easily available Has good variety Has better VFM Avg Weighted Avg (Avg*0.5) Bru 60.0% 65.0% 37.5% 55.0% 40.0% 47.5% 50.83% 25.42% Nescafé 85.0% 70.0% 80.0% 92.5% 75.0% 75.0% 79.58% 39.79% Tata Café 2.5% 0.0% 7.5% 2.5% 2.5% 2.5% 2.92% 1.46% Differentiation Measurement: Color Identification Brand Red Green Yellow Blue Brown Weighted Avg(%-age*0.5) Bru 3 31 1 1 4 38.8% Nescafé 21 0 3 1 15 26.3% Tata Café 0 4 1 1 2 2.5% Pack Identification
  • 19. PBM Term Project Page 19 Brand Correct Weighted Avg (Avg*0.5) Bru 40 50.0% Nescafé 38 47.5% Tata Café 8 10.0%  BAV ANALYSIS Finally, after finding the values for the different pillars of BAV, we plot the different brands on the various pillars. Nescafé scores high on Knowledge which means that it has high awareness. It scores relatively lower on Esteem which means it has lost the respect & regard over time. It still scores well on Relevance & Differentiation. Knowledge Esteem Relevance Differentiation 94% 66% 79% 74% Nescafe
  • 20. PBM Term Project Page 20 Bru scores high on Knowledge indicating high awareness. It fares very less in Esteem and indicates that people do not hold this brand in very high regard. Its Relevance score is also low, when compared to Nescafé, which means that Bru has not been able to understand the consumer needs well. But it fares very high on Differentiation which means that people perceive Bru as a highly differentiated brand. TATA Café fares lowest on Knowledge and Esteem which indicates that the brand has very low awareness and respect amongst customers. It fares lower than Bru & Nescafé on Relevance & Differentiation which means that people do not perceive their product as a differentiated one and they also feel that it doesn‘t understand their requirements well. This might also be a result of the fact that it is not so prevalent in the Northern & Eastern regions of India. Knowledge Esteem Relevance Differentiation 94% 29% 60% 89% Bru Knowledge Esteem Relevance Differentiation 9% -2% 8% 13% Tata Cafe
  • 21. PBM Term Project Page 21 QUALITATIVE RESEARCH METHODOLOGY (Using Zaltman‟s Metaphor Elicitation Technique or ZMET)  ZMET HISTORY ZMET is a qualitative research technique used to discover a person‘s conscious & unconscious thoughts about a brand. It is conducted by asking the respondent to select pictures which form a mental representation of the brand for him. Using the pictures as an entry point or a metaphor for his feelings, the research is conducted to understand the softer aspects of the brand. Pictures are an important tool because at times words can miss out certain feelings which a picture can express better. ZMET was founded in 1990 by Dr. Olson Zaltman while he was on vacation in Nepal. He asked the residents of the village to click pictures to explain ―What life was like in their village‖. After developing the pictures he went back and asked the villagers to explain the meaning of each picture and the significance of each in their life.
  • 22. PBM Term Project Page 22  ZMET METHODOLOGY o Type of Research: Primary research involving Qualitative techniques o Sample Size: 10 o Target Group: instant coffee consumers in the age group of 21-30 Steps followed in ZMET were: 1. Select 10 pictures which would define the meaning of Nescafé for them 2. The respondent is then queried on the reasons for selecting the different pictures 3. Then the respondents were asked to select 5 pictures which were the best representation of their feelings 4. Then the respondent was asked to explain the reasons for selecting the 5 pictures and rejecting the remaining 5. Then they were asked to create a mental map by collating the pictures into one image  PICTORIAL ANALYSIS The various pictures selected by the respondent are shown below along with the final analysis: Respondent 1 Respondent 2
  • 23. PBM Term Project Page 23 Respondent 3 Respondent 4 Respondent 5 Respondent 6 Respondent 7 Respondent 8
  • 24. PBM Term Project Page 24 The following pictures/themes were found to be a common theme: Respondent 9 Respondent 10
  • 25. PBM Term Project Page 25 Friends, Friendship & F.R.I.E.N.D.S (10) Coffee in the Morning & feeling of Refreshment (6)
  • 26. PBM Term Project Page 26 Apart from these themes, a few common & recurring themes were: (each had 4 responses each) Sugar & Sweet Coffee (5) Coffee Beans
  • 27. PBM Term Project Page 27 Couples & Dating Winter NESCAFE- The Brand
  • 28. PBM Term Project Page 28 From the above pictures, we can conclude that: ―Coffee is generally preferred with friends rather than family. Be it at CCD or any other coffee shop, coffee is the preferred drink for people when it comes to sitting together, chatting and other such types of gatherings and amongst different brands, Nescafé is the most preferred brand when it comes to such occasions (especially at family gatherings) People generally start off their day with a cup of coffee as they feel it‘s the best way to refresh oneself. People also prefer coffee more in winters rather than summers, which can be a function of the Indian climate. For summers they prefer cold coffee or any other cool drink such as aerated soft drinks or lemon juice or even Ice-Tea. Coffee is also considered a great drink for removing drowsiness, headache and helps students and working professionals alike concentrate better on work or studies especially during exams or late night work. When it comes to strength, people usually prefer medium strength coffee which is a bit sweeter than the average cup of tea, though the preference changes according to regions as in South India, people like stronger coffees.‖ For positioning their brand in India, Nescafé can make use of the following value propositions which have been a central theme for all our ZMET respondents: 1. Company of friends or family 2. Feeling of happiness 3. Respect for family members 4. Feeling of achievement 5. Relaxing, either alone or with someone special
  • 29. PBM Term Project Page 29 Brand Equity: A Definition Brands represent enormously valuable pieces of legal property, capable of influencing consumer behavior, being bought and sold, and providing the security of sustained future revenues to their owner. The value directly or indirectly accrued by these various benefits is often called brand equity (Kapferer, 2005; Keller, 2003) In simpler terms it can be defined as the value premium that a company realizes from a product with a recognizable name as compared to its generic equivalent. Companies can create brand equity for their products by making them memorable, easily recognizable and superior in quality and reliability. Mass marketing campaigns can also help to create brand equity. Brand equity is strategically crucial, but usually difficult to quantify. Many experts have developed tools to analyze this asset, but there is no universally accepted way to measure it. As one of the serial challenges that marketing professionals and academics find with the concept of brand equity, the disconnect between quantitative and qualitative equity values is difficult to reconcile. Quantitative brand equity includes numerical values such as profit margins and market share, but fails to capture qualitative elements such as prestige and associations of interest.
  • 30. PBM Term Project Page 30 Measuring Brand Equity: The Logic? The value of a brand – and thus its equity – is ultimately derived in the marketplace from the words and actions of consumers. Consumers decide with their purchases, based on whatever factors they deem important, which brands have more equity than other brands. Although the details of different approaches to conceptualize brand equity differ, they tend to share a common core: All definitions typically either implicitly or explicitly rely on brand knowledge structures in the minds of consumers – individuals or organizations – as the source or foundation of brand equity. In other words, the real power of a brand is in the thoughts, feelings, images, beliefs, attitudes, experiences and so on that exist in the minds of consumers. This brand knowledge affects how consumers respond to products, prices, communications, channels and other marketing activity – increasing or decreasing brand value in the process. Along these lines, formally, customer-based brand equity has been defined as the differential effect that consumer brand knowledge has on their response to brand marketing activity (Keller, 2003). Reasons to measure Brand Equity: Understand drivers of brand strength in order to support strategic decision making To evaluate performance of brand management in increasing equity over time To evaluate efficacy of brand building programs To assess the value of the brand for purposes of licensing or sale The metrics derived from the brand equity measurement process, are important tools in each stage of the brand strategy.
  • 31. PBM Term Project Page 31 Brand Equity versus Brand Value: Though at times the terms are used interchangeably, the term Brand Value actually refers to the financial measure or value of the brand in question. It gives an idea to an outsider of the value of the brand, where it been sold in the market (useful at times of M&A‘s). Brand Equity is more to do with how the brand‘s image, perception, positioning etc. in the market impacts the business side of the brand and how it ensures future cash flows for the company.
  • 32. PBM Term Project Page 32 Techniques of Brand Equity measurement: The techniques employed to measure brand equity make use of three metrics. They are: Measure of Brand Loyalty Measure of Price Premia Measure of Brand Leveragability Brand Loyalty: Brand loyalty, in marketing, consists of a consumer's commitment to repurchase or otherwise continue using the brand and can be demonstrated by repeated buying of a product or service, or other positive behaviors such as word of mouth advocacy. Brand loyalty is more than simple repurchasing, however. Customers may repurchase a brand due to situational constraints (such as vendor lock-in), a lack of viable alternatives, or out of convenience. Such loyalty is referred to as "spurious loyalty". True brand loyalty exists when customers have a high relative attitude toward the brand which is then exhibited through repurchase behavior. This type of loyalty can be a great asset to the firm: customers are willing to pay higher prices, they may cost less to serve, and can bring new customers to the firm. There are two dimensions in play when we discuss about brand loyalty. They are: Usage Rate, i.e. the amount of usage subjected to a brand by the user. The most common segmentation strategy of consumers, as per usage rates is into ―HEAVY‖, ―MEDIUM‖ and ―LIGHT‖ users of a brand Commitment to the Brand, i.e. how ―committed‖ is the consumer towards using his/her brand. Based on commitment the consumers are segmented as ―HARD CORE LOYALS (who buy the brand all the time)‖, ―SPLIT LOYALS (loyal to two or three brands)‖, ―SHIFTING LOYALS (keeps moving from one brand to another)‖ and ―SWITCHERS (no particular loyalty and keep looking for bargains or value for money)‖. The most common techniques employed to check brand loyalty whilst measuring brand equity are the Colombo Morrison Model and the Shared Tier Model. We discuss each measure in detail below:
  • 33. PBM Term Project Page 33 COLOMBO MORRISON MODEL: The Colombo Morrison model of brand loyalty measure makes use of two questions. These are: 1. Which brand do you prefer? 2. Out of the last 3 (or 5) purchases, how many times have you purchased the brand in question? This model works best for products and brands wherein the level of loyalty is medium to high. The output of this model is represented as a 2X2 matrix as shown: Preferred Brand Last Purchases .. .. .. .. Row Total = SHARE OF PREFERENCES.. .. .. .. Column Total =MARKET SHARES This model makes use of two ratios viz. Gravity (given by Purchase/Preference) and Focus (given by Preference/Purchase) SHARED TIER MODEL: The Shared Tier model makes use of four quality standards viz. 1. Q1= SUPERIOR 2. Q2= GOOD 3. Q3= ACCEPTABLE 4. Q4= POOR The model also uses four price standards viz. 1. P1= PRICE IS NOT A BARRIER 2. P2= PRICE IS A MINOR BARRIER 3. P3= PRICE IS A MAJOR BARRIER 4. P4= PRICE IS AN ABSOLUTE BARRIER These standards are used to map a brand into different price-quality segments and based on the responses from consumers understand which segment is best suited for the brand. An example would be if Nescafe and Bru both occupy the segment P1Q1 for
  • 34. PBM Term Project Page 34 a consumer, then he is more likely to switch between brands, as he sees both brands as the same, i.e. he is ―indifferent‖ to the brands. Conversely, if a consumer has Nescafe as a P2Q1 brand and Bru as a P2Q2 brand, then the makers of Nescafe can target this customer with price offers as he feels the brand is superior but is probably not using it owing to price constraints. Both these models when used together, give a clearer picture of the loyalty position of the brand and also an idea of the means to be employed to retain the existing users of a brand. For our study, we have combined the findings of both these models and painted a picture of the loyalty levels for Nescafe and competitors. Price Premia: Brand equity is also what enables branded products or services to charge premium prices. Many major brands are positioned as quality products, and many people are willing to pay more for a quality product they are familiar with, particularly if the brand has an image with which they would like to be associated. The challenge is to find the point where the premium price is still acceptable in exchange for the confidence embedded in the brand. (Keegan – Moriarty – Duncan 1995) The price premium due to brand equity provides the additional price the firm is able to charge currently for the brand, while holding the market share fixed. The market share and price premiums constitute meaningful summary measures of brand equity because they closely relate to brand profitability. Primarily two models are used to gauge price premia. They are viz. the Van Westendorp Price Sensitivity Meter & the Brand Price Trade-Off (BPTO) Model. (http://lta.hse.fi/1999/1/lta_1999_01_a4.pdf) VAN WESTENDORP PRICE SENSITIVITY METER (PSM): This model is a market technique for determining consumer price preferences. It was introduced in 1976 by Dutch economist Peter van Westendorp. The technique has been used by a wide variety of researchers in the market research industry. The assumption underlying PSM is that respondents are capable of envisioning a pricing landscape and that price is an intrinsic measure of value or utility. Participants in a PSM exercise are asked to identify price points at which they can infer a particular value to the product or service under study.
  • 35. PBM Term Project Page 35 The traditional model of PSM makes use of four price-related questions, which are then evaluated as a series of four cumulative distributions, one distribution for each question. The standard question formats can vary, but generally take the following form: 1. At what price would you consider the product to be so expensive that you would not consider buying it? (Too expensive) 2. At what price would you consider the product to be priced so low that you would feel the quality couldn‘t be very good? (Too cheap) 3. At what price would you consider the product starting to get expensive, so that it is not out of the question, but you would have to give some thought to buying it? (Expensive/High Side) 4. At what price would you consider the product to be a bargain—a great buy for the money? (Cheap/Good Value) (http://en.wikipedia.org/wiki/Van_Westendorp's_Price_Sensitivity_Meter) BRAND PRICE TRADE-OFF (BPTO) MODEL: Brand Price Trade-Off (BPTO) is a technique used to gain insight into expected purchase behavior at various price points for competitive products. Within the scope of the technique, the price ―attribute‖ is isolated and traded-off by the respondents against all other fixed properties of the competitive products. Thus, during the interview, the respondent is confronted with a limited number of products or concepts. Each product is given a price and the respondent is asked which product he/she would buy. Then the price of the product the respondent has chosen is raised by a pre-determined increment, and the procedure is repeated several times. The products remain unchanged and only the prices vary. On the basis of the BPTO technique, conclusions can be drawn concerning expected behavior in a competitive environment. It is also possible to estimate market shares, given any combination of price levels. (http://www.marketresponse.com/mmt-04-brandpricetradeoff.html) For our study, we have used the Van Westendorp PSM model to test Nescafe for price premia and price sensitivity. We have used a variation of the standard questions of the PSM model.
  • 36. PBM Term Project Page 36 Brand Leveragability: Brand leveragability is also known as brand elasticity and it represents the brand‘s ability to stretch from one offering to another. (e.g., Apple's expansion from Computers—iMac to MP3 players—iPod to telecommunications—iPhone) (http://www.blackcoffee.com/brand-related/brand-terms/E/elasticity) Brand extensions are popular among brands wanting to leverage their position in the existing category/market into other category/markets. Consumers tend to respond more favorably to extensions that fit with their perceptions of the parent brand. Perceived fit is usually higher for Extensions in product categories close to the parent brand (Boush and Loken 1991) Extensions in product categories in which an appealing attribute can be supplied by the parent brand (Broniarczyk and Alba 1994) Extensions that can be used with other products sold by the parent brand (Aaker and Keller 1990) Characteristics of the parent brand dictate the brand‘s elastic nature. Of particular importance is the nature of the brand concept associated with the parent brand—prestige versus functional (Park, Milberg, and Lawson 1991). Brands positioned on the basis of prestige, such as Rolex, have abstract brand concepts that are more elastic and can successfully expand into a variety of product categories, such as clothing and accessories. In contrast, brands positioned on functional attributes, such as Timex (reliability), are less elastic and are more successful if they extend to offerings that conform to the functional nature of the brand. (http://www.carlsonschool.umn.edu/assets/164421.pdf) To gauge a brand‘s elastic ability, the most commonly used model is the Brand Optimor Model of Millward Brown (brand name BrandZ™). Here the brand is tested across different product categories on three variables: APPROPRIATENESS LIKELY LEADERSHIP CONSIDERATION The product categories selected are grouped into three classes, viz. Similar (Juice &Soft Drinks), Associated (Laptops & Speakers) and No Relation (Jeans & Cars). If a brand scores high in associated and no relation classes, it is considered to be a highly elastic category.
  • 37. PBM Term Project Page 37 For our study, we have made use of this model and classified the brands into associated and no relation product categories for analysis purposes. Tool employed for Brand Equity Measurement: To measure the brand equity of Nescafe on the parameters stated above, we made use of a structured questionnaire which tested the consumer‘s outlook towards the brand on the parameters decided. The questionnaire is reproduced herewith: GENERAL QUESTIONS: Q.1.Which brands come to your mind when you think of “Instant Coffee”? Q.2. Which brands do you associate with the following attributes? Attribute BRU Nescafé TATA Café Has great taste Great aroma Great with company Is easily available Has good variety Has better VFM Q.3 Rank these instant coffee brand as per your overall preference. (1 to best , 3 to last) Brand Rank BRU Nescafé TATA Café
  • 38. PBM Term Project Page 38 Q.5 If you were to recommend a brand of coffee to somebody, which brand would it be? Brand Code BRU 1 Nescafé 2 TATA Café 3 LOYALTY MEASURE– COLOMBO MORRISON MODEL 1. What is your preferred brand of instant coffee? Brand BRU Nescafé TATA Café 2. Out of your last 3 purchases of instant coffee how many times have you purchased the following brands? Brand Purchase 1 Purchase 2 Purchase 3 BRU Nescafé TATA Café Other SHARE TIER MODEL Q1 How would you rate the following brands on the basis of quality (SUPERIOR = Q1, GOOD = Q2, ACCEPTABLE = Q3,
  • 39. PBM Term Project Page 39 POOR = Q4) and price (PRICE NOT A BARRIER = P1, PRICE IS A MINOR BARRIER = P2, PRICE IS A MAJOR BARRIER = P3, PRICE IS AN ABSOLUTE BARRIER = P4) Brand Quality Price BRU Nescafé TATA Café PRICE PREMIA MEASURE- VAN WESTENDORP METHOD 3. Now I would like you to think about the price of different brands of instant coffee. Kindly tell us which of the following statements best describes how likely you would be to buy your brand of instant coffee. 1. I would buy whatever it costs 2. I would buy even if it costs a lot more than the cheapest brand 3. Even if it costs more than any other brand 4. Even if it costs a bit more than the cheapest brand I wouldn’t buy it at all 5. Only if it costs the same as the cheapest brand Brand 1 2 3 4 5 BRU Nescafé TATA Café
  • 40. PBM Term Project Page 40 LEVERAGABILITY – BrandZ™ (MILLWARD BROWN OPTIMOR MODEL) 4. If the following brands enter into the following categories, how would you rate your acceptance of the brands? (5 being the highest and 1 being the lowest) Bran d Sof t Drin ks Pe ns Edib le Oil Biscu its Soa ps Chewi ng Gum Lapt op Pota to Wafe rs BRU Nesc afé TATA Café Analysis of Brand Equity Measurement Exercise: Given below are the different findings from the brand equity measurement exercise undertaken for our brand Nescafe. Attribute Analysis: We checked the brands for different attributes as given below, by asking respondents to select the best suited brand: Has great taste Great aroma Great with company Is easily available Has good variety ASSOCIATED CATEGORIES NO RELATION CATEGORIES
  • 41. PBM Term Project Page 41 VFM The importance of the different factors was found as shown in the table below: Attribute Has great taste Great aroma Great with company Is easily available Has good variety VFM Total BRU 20 14 8 12 9 14 Nescafé 31 30 29 35 31 30 TATA Café 2 3 5 1 1 4 Sum of responses 53 47 42 48 41 48 279 Importance of factors 19.00% 16.85% 15.05% 17.20% 14.70% 17.20% The different brands including Nescafe were tested across the different attributes and the performance of the brands is as shown Has great taste Great aroma Great with company Is easily available Has good variety VFM 19.00% 16.85% 15.05% 17.20% 14.70% 17.20% Importance of Factors Brands Has great taste Great aroma Great with company Is easily available Has good variety VFM BRU 3.80 2.36 1.20 2.06 1.32 2.41 Nescafé 5.89 5.05 4.37 6.02 4.56 5.16 TATA Café 0.38 0.51 0.75 0.17 0.15 0.69
  • 42. PBM Term Project Page 42 Here also we can see that Nescafe scores highest in all attributes while TATA Café fares the lowest, which can be attributed to the fact that it is not widely available. Loyalty Analysis: To measure the loyalty of the brands we used a combination of the Colombo Morrison model and the Share Tier model. The findings of the research are as shown: BrandFrequency of purchase Purchase 3 Purchase 2 Purchase 1 Did not Purchase Total BRU 5 5 10 20 160 Nescafé 15 13 7 5 TATA Café 0 0 1 39 Other 0 1 2 37 3.80 2.36 1.20 2.06 1.32 2.41 5.89 5.05 4.37 6.02 4.56 5.16 0.38 0.51 0.75 0.17 0.15 0.69 Has great taste Great aroma Great with company Is easily available Has good variety VFM BRU Nescafé TATA Café
  • 43. PBM Term Project Page 43 Then we assigned weights to each of the purchases in the order of 3, 2, 1, and 0 respectively. Then we found loyalty score for each brand. This is shown as follows: Weighted 3 2 1 0 Sum Loyalty BRU 15 10 10 0 35 21.88% Nescafé 45 26 7 0 78 48.75% TATA Café 0 0 1 0 1 0.63% Other 0 2 2 0 4 2.50% Using the Share Tier model we have calculated the loyalty as follows: Total P1 P2 P3 P4 Q1 23 11 2 0 Q2 21 17 2 0 Q3 5 3 0 2 Q4 0 0 0 0 Bru P1 P2 P3 P4 Q1 3 5 1 0 Q2 12 12 0 0 Q3 3 0 0 0 Q4 0 0 0 0 Bru P1 P2 P3 P4 Q1 13.04% 45.45% 50.00% n/a Q2 57.14% 70.59% 0.00% n/a Q3 60.00% 0.00% n/a 0.00% Q4 n/a n/a n/a n/a Nescafe P1 P2 P3 P4 Q1 20 6 1 0 Q2 6 5 2 0
  • 44. PBM Term Project Page 44 Q3 0 0 0 0 Q4 0 0 0 0 Nescafe P1 P2 P3 P4 Q1 86.96% 54.55% 50.00% n/a Q2 28.57% 29.41% 100.00% n/a Q3 0.00% 0.00% n/a 0.00% Q4 n/a n/a n/a n/a TataCafe P1 P2 P3 P4 Q1 0 0 0 0 Q2 3 0 0 0 Q3 2 3 0 2 Q4 0 0 0 0 TataCafe P1 P2 P3 P4 Q1 0.00% 0.00% 0.00% n/a Q2 14.29% 0.00% 0.00% n/a Q3 40.00% 100.00% n/a 100.00% Q4 n/a n/a n/a n/a (n/a represents columns with undefined values) From analyzing the data from above, we can see that Nescafe‘s customers are primarily centered around the Q1P1 & Q1P2 segment, who feel the quality of the brand is superior and for them price is not a barrier or at best a minor barrier. For customers in the Q1P3 segment we suggest price offers, as Bru also has equal percentage of customers in this segment and if they enter into a price discount, customers would shift to Bru seeing that they presume both brands to be of equivalent quality. Nescafe has a large chunk of customers in the Q2P3 segment who feel even after Nescafe‘s good quality the price of the brand is a major barrier. For these customers we suggest price discounts which are not too extreme, so as to shift those to Q3/Q4 segments (quality suspect) but bring them to P1/P2 segment.
  • 45. PBM Term Project Page 45 Price Premia Analysis: We checked the brands for ability to charge price premium using the Van Westendorp model. We used the following statements to test the price sensitivity of the consumer‘s w.r.t Nescafe and its competitors: A. Whatever it costs B. Even if it costs lot more than the cheapest brand C. Even if it costs more than any other brand D. Even if it costs a bit more than the cheapest brand I wouldn‘t buy it at all E. Only if it costs the same as the cheapest brand The performance of the different brands in this module is: The ability to charge price premia is explained by the price premia index given below: Brand Price Premia BRU 0.89 Nescafé 1.29 TATA Café 0.66 Leveragability Analysis: We checked the elasticity of Nescafe, Bru and TATA Café across the following product categories: 0 2 4 6 8 10 12 14 16 18 A B C D E 4 8 10 7 11 16 10 9 3 2 0 4 5 17 14 BRU Nescafé TATA Café
  • 46. PBM Term Project Page 46 Soft Drinks Biscuits Chewing Gum Potato Wafers Pens Edible Oil Soaps Laptop The categories have been further sub divided into two classes, viz. Associated & No Relation. The product categories under each class are: Associated: Soft Drinks Biscuits Chewing Gum Potato Wafers No Relation: Pens Edible Oil Soaps Laptop The scores for the brands across categories for elasticity and category vulnerability are as shown below: Brands Associated No Relation Brand Elasticity Score Soft Drinks Biscuits Chewing Gum Potato Wafers Pens Edible Oil Soaps Laptop Bru 3.05 2.925 1.975 2.2 1.65 1.775 1.5 1.4 2.06 Nescafe 3.525 3.5 2.35 2.5 1.8 1.875 1.675 1.575 2.35 Tata Café 2.35 2.125 1.625 1.95 1.825 1.85 1.55 1.675 1.87 Mean(category wise) 2.98 2.85 1.98 2.22 1.76 1.83 1.58 1.55 Mean(class- wise) 2.36 1.68 (We have tabulated the mean score of each category w.r.t the different brands)
  • 47. PBM Term Project Page 47 Going by the contents of the table, we can make the following conclusions: Nescafe with a score of 2.35 is the most elastic brand when compared to Bru (2.06) and TATA Café (1.87). But when we compare to standard value of 5 (indicating most elastic brand) we can see that none of the brands are elastic enough to enter different categories. TATA Café is the most inelastic brand. Among categories, soft drinks (with a score of 2.98) is the most vulnerable followed by biscuits (with a score of 2.85) while laptops are the most inelastic (with a score of 1.55) followed by soaps (with a score of 1.58). For the brands we studied associated categories is the best segment to enter since it has a score 2.36. On checking for elasticity across brands, we can see that not a single category is vulnerable enough to be easily entered because the score should be nearer to 5 for the category to be vulnerable. For all categories the highest score is 2.98 which is a fairly low score. Checking the brands across classes we see: Brands Associated No Relation Bru 2.54 1.58 Nescafe 2.97 1.73 Tata Café 2.01 1.73 Here again we see Nescafe scores the highest with a score of 2.97 followed by Bru with a score 2.54 which is consistent with the previous findings. We can conclude that Nescafe is the most elastic amongst the different instant coffee brands and has the advantage of its brand name and trust generated amongst consumers. If it wants to enter into some other category, then soft drink (with 3.525) and biscuits (with 3.5) is the best sector to expand into. WINNING B®ANDS™ To measure the brand equity index we made use of the model called WINNING B®ANDS™. WINNING B®ANDS™ is the brand management service from The Nielsen Company that measures the effect that ALL your marketing activity has on brand equity. The issues that WINNING B®ANDS™ covers are comprehensive - from understanding the category that brand competes in from the consumers perspective, through detailed brand
  • 48. PBM Term Project Page 48 measurement, to an understanding of how the whole range of marketing activity has influenced consumer perception of the brand. Nielsen Winning Brands tracks the underlying strength of the relationship between the customer and the brand, and uses this to create effective strategies to enhance that relationship. At the same time, it provides monitoring to protect and improve the brand‘s health as often as is required. As per the data collected in the different segments we calculated a brand equity index as shown: Brand BRU Nescafé TATA Café Recommended brand 9 29 2 Favorite brand 5 34 1 Recommended brand 0.225 0.725 0.05 Favorite brand 0.125 0.85 0.025 Loyalty 0.21875 0.4875 0.00625 Weights BRU Nescafé TATA Café 0.3 Weighted recommended brand 0.0675 0.2175 0.015 0.3 Weighted favorite brand 0.0375 0.255 0.0075 0.4 Weighted loyalty value 0.0875 0.195 0.0025 Net Loyalty 0.1925 0.6675 0.025 According to Winning Brands Weights BRU Nescafé TATA Café 0.5 Net Loyalty 0.1925 0.6675 0.025 0.5 Ability to charge price premia 0.89 1.29 0.66 Brand Equity Index(BEI) 0.542 0.980 0.342 We assigned 30% importance to recommended brand & favorite brand of the respondent. The overall loyalty score generated from purchases was given a weightage of 40% since that reflects the actual buying behavior of the consumer and is a more durable measure of consumer loyalty in the long run. Based on the values we have calculated a BEI of 0.980 for our brand Nescafe.
  • 49. PBM Term Project Page 49 BRAND VALUATION: What are Brands? ―A distinguishing symbol, mark, logo, name, word, sentence or a combination of these items that companies use to distinguish their product from others in the market.‖ That is how Investopedia™ describes a brand. A brand is a product, service, or concept that is publicly distinguished from other products, services, or concepts so that it can be easily communicated and usually marketed. A brand name is the name of the distinctive product, service, or concept. Branding is the process of creating and disseminating the brand name. Branding can be applied to the entire corporate identity as well as to individual product and service names. Brands are usually protected from use by others by securing a trademark or service mark from an authorized agency, usually a government agency. Why measure Brand Value? A brand is an asset for the company and like all assets, it too is bound by the definition of an asset i.e. a resource with economic value that an individual, corporation or country owns or controls with the expectation that it will provide future benefit. Brands are intangible assets which actually are the most important asset for some companies. This is because of the economic impact that brands have. They influence the choices of customers, employees, investors and government authorities. In a world of abundant choices, such influence is crucial for commercial success and creation of shareholder value. Competition in the marketplace has made the brand as the single most important factor when it comes to differentiating between companies. Strong brands enhance business performance primarily through their influence on three key stakeholder groups: Customers (current and prospective) Employees Investors They influence customer choice and create loyalty; attract, retain, and motivate talent; and lower the cost of financing. The influence of brands on current and prospective customers is a particularly significant driver of economic value. By expressing their proposition
  • 50. PBM Term Project Page 50 consistently brands help shape perceptions and, therefore, purchase behavior, making products and services less substitutable. In this way, brands create demand, allowing their owners to enjoy higher returns. Strong brands also create continuity of demand into the future, thus making expected returns more likely – or less risky. Brands, therefore, create economic value by generating higher returns and growth, and by mitigating risk. Do Brands appear in the Balance Sheet? Surprisingly, brands, even after being such important assets, do not appear in a company‘s balance sheet. Only acquired brands are shown in the balance sheet (from the 1980‘s) which was also the result of the fact that companies started to question the high premiums paid to acquire companies during merger & acquisitions. This revealed that companies acquiring companies with strong brands had to pay a hefty price and so these acquired brands were allowed to appear on the acquiring company‘s balance sheet. But the company‘s own brands can‟t be shown on the balance sheet. What are the methods to measure Brand Value? Financial values have to some extent always been attached to brands and to other intangible assets, but it was only in the late 1980s that valuation approaches were established that could fairly claim to understand and assess the specific value of brands. Unlike other assets such as stocks, bonds, commodities and real estate, there is no active market in brands that would provide comparable values. So to arrive at a value, primarily two methods are employed • Research-based brand equity evaluations There are numerous brand equity models that use consumer research to assess the relative performance of brands. They measure consumer behavior and attitudes that have an impact on the economic performance of brands. They all try to explain, interpret and measure consumers‟ perceptions that influence purchase behavior. They include a wide range of perceptive measures such as different levels of awareness (spontaneous & aided), knowledge, familiarity, relevance, specific image attributes, purchase consideration, preference, satisfaction and recommendation. Some models add behavioral measures such as market share and relative price.
  • 51. PBM Term Project Page 51 • Financially driven brand equity evaluations The financial models are subdivided into the following categories: Cost based approach takes all costs incurred in building the brand into account and all costs are added to arrive at the brand value. These measures are not quite successful as there is no direct relation between brand value and the financial investments made into the brand. Book to Market approach is ideal for single brand companies (e.g. McD). Here book value of the company is subtracted from the market capitalization to arrive at the brand‘s value. The intrinsic flaw in this method is that it assumes that the brand‘s value is only the excess of the book value and ignores the strength of the brand which also adds a premium. Discounted Cash Flow (DCF) approach is the method where the Net Present Value (NPV) of the brand (arrived at by discounting the estimated cash flows) is taken to be the brand and firm‘s value. Price Premia approach the value is calculated as the net present value of future price premiums that a branded product would command over an unbranded or generic equivalent. However, the primary purpose of many brands is not necessarily to obtain a price premium but rather to secure the highest level of future demand and herein lies the flaw in this technique. Economic Use approach combines brand equity and financial measures, and has become the most widely recognized and accepted methodology for brand valuation. It has been used in more than 3,500 brand valuations worldwide. What are the uses of Brand Value measurement? Brand value measurement is required in the following scenarios: a) To assess the value of the company and its brands at the time of M&A b) To decide on business investments and to benchmark performance by comparing brands to other assets in the conventional fashion c) To decide on investment decisions subject to a brand (like channel investments, diversification etc.) d) To arrive at the cost of licensing while interacting with third parties e) To acquire funds from the market, by keeping brand as collateral
  • 52. PBM Term Project Page 52 Now for our study, we shall discuss the InterBrand model of Brand Valuation which the model we have used to measure our brand Nescafe. INTERBRAND MODEL OF BRAND VALUATION The value of a brand lies in its economic benefit – brand value is therefore defined as the net present value of future earnings generated by the brand alone. InterBrand approach is based on the following three economic functions: 1) The brand‘s function to create cost synergies 2) The brand‘s function to generate demand for the products and services 3) The brand‗s function to secure future demand and thus reduce operative and financial risks. The method employed to evaluate brands comprises five steps: segmentation, financial analysis, demand analysis, brand strength analysis, and, finally, the calculation of the net present value of brand earnings. This can be shown in a diagram as follows: The different steps in the InterBrand model are explained as follows:
  • 53. PBM Term Project Page 53 Segmentation: Consumers‘ purchasing behavior and attitudes towards brands differ from one market sector to another, depending largely on product-, market- and distribution- related factors. For this reason, the value of a brand can only be determined precisely through the separate assessment of individual segments that represent a homogenous customer group. Apart from this, brand management can only obtain the insights it needs to increase the brand‘s value systematically if the brand has been evaluated in all its segments. Financial Analysis: InterBrand brand valuation begins with an assessment of the company's value and then determines the value contributed by the brand. The first step towards isolating brand earnings from other forms of income is to determine the Economic Value Added (EVA) which tells whether a company is able to generate returns that exceed the costs of capital employed. As both value creation and its counterpart, risk, lie in the future, the analysis is based on a five-year forecast of future revenues generated in the brand segment being assessed. Demand Analysis: In this step, InterBrand analyzes the brand‘s value chain and identifies the position of the brand in the minds of customers. To determine the brand‘s share of EVA, InterBrand examines what factors influence demand and motivate customers to purchase. These factors are weighted in terms of their bearing on demand and for each; the contributions of the specific associations with the brand are statistically calculated. The sum of these brand contributions on the demand drivers is expressed as the Role of Brand Index (RBI) which, multiplied with the EVA, yields the brand earnings. Brand Strength Analysis: The stronger a brand, the lower is its risk, and thus the more certain are future brand earnings. InterBrand assesses this risk by analyzing the strength of a brand compared with its competitors on the basis of seven factors (i.e. market, stability, brand leadership trend, brand support, diversification, and protection). In fact, a broad range of measured attributes explains the seven factors and facilitates an all-round diagnosis of a brand‘s competitive position. This step results in the Brand Strength Score (BSS). Net Present Value Calculation: The economic value of future brand earnings is inversely correlated with the brand‘s estimated risk and this risk is directly linked to brand strength. The transformation of brand strength into brand risk (or into discount rate,) is completed using an S-curve. The procedure reflects the dynamism of the market, where brands at the extreme ends of the scale react differently from brands in the middle range as regards changes in their strength. The strongest brands are discounted with the risk-free rate of the total market while average-strength brands are discounted with the industry WACC (cost of equity in the financial service industry). Discounting the forecast period (present value) and the calculation of an annuity (terminal value) results in the total value of the brand.
  • 54. PBM Term Project Page 54 This conversion using an S-Curve is shown below: The InterBrand model measures a brand across the following components: 1. CLARITY: The brand's values, positioning and proposition must be clearly articulated and shared across the organization, along with a clear view of its target audiences, customer insights and drivers. It is vital that those within the organization know and understand all of these elements, because everything that follows hinges on them. Weightage assigned: 15% 2. COMMITMENT: A measure of an organization‘s internal commitment to/or belief in its brand. Commitment is the extent to which the brand receives support in terms of time, influence and investment. Weightage assigned: 10% 3. PROTECTION: This component examines how secure a brand is across a number of dimensions – from legal protection and proprietary ingredients to design, scale or geographic spread. Weightage assigned: 10% 4. AUTHENCITY: This component is about how soundly a brand is based on an internal capability. Authenticity asks if a brand has a defined heritage and a well-grounded value set, as well as if it can deliver against customers' expectations.
  • 55. PBM Term Project Page 55 Weightage assigned: 10% 5. RESPONSIVENESS: This component looks at a brand‘s ability to adapt to market changes, challenges and opportunities. The brand should have a desire and ability to constantly evolve and renew itself. Weightage assigned: 10% 6. RELEVANCE: This component estimates how well a brand fits with customer needs, desires and decision criteria across all appropriate demographics and geographies. Weightage assigned: 12% 7. DIFFERENTIATION: This is the degree to which customers perceive the brand to have a positioning that is distinct from the competition. Weightage assigned: 8% 8. CONSISTENCY: This measures the degree to which a brand is experienced without fail across all touch-points and formats. Weightage assigned: 5% 9. PRESENCE: This measures the degree to which a brand feels omnipresent and how positively consumers, customers and opinion formers discuss it in both traditional and social media. Weightage assigned: 5% 10. UNDERSTANDING: Not only must customers recognize the brand, but there must also be an in-depth understanding of its distinctive qualities and characteristics, as well as those of the brand owner. Weightage assigned: 15%
  • 56. PBM Term Project Page 56 ANALYSIS OF NESCAFE USING InterBrand MODEL How to get Role of Branding Index (RBI)? We checked the brands (Nescafe, Bru, and TATA Café) across the components in the InterBrand model (Clarity, Commitment, Protection etc.) on a 5-point scale. The average value of each component for each brand is calculated. This score is then added for each brand across each component. The sum is divided by the maximum value achievable by any brand 50 (score of maximum 5*10 components). The weights assigned to each component are not applicable in this case. Based on these calculations, the Role of Branding Index (RBI) of Nescafe and competitors is as shown: Role of Branding Index Nescafe Bru Tata Café Sum 43.58 37.26 30.32 RBI 87.16% 74.52% 60.65% How to get Brand Strength Score (BSS)? The average values for each component per brand, is then multiplied by their respective weights which have been assigned based on their relative importance from a brand‘s perspective. Hence relevance has a weight of 12% while clarity has a weight of 15%. The values after multiplication are then summed for each brand and divided by the maximum score for any component i.e. 5. Based on these calculations, the Brand Strength Score (BSS) of Nescafe and competitors is as shown: 0.00% 20.00% 40.00% 60.00% 80.00% 100.00% Nescafe Bru Tata Café Role of Branding Index
  • 57. PBM Term Project Page 57 Brand Strength Score Nescafe Bru Tata Café Sum 4.35 3.71 3.03 BSS 86.97% 74.10% 60.70% Taking the values calculated in each of these phases we then calculate the Economic Value Added (EVA) for Nescafe which gives the value of the brand in the market. How to arrive at EVA? 2013 2014 2015 2016 2017 Revenue (Nestle) 101,588.97 111,951.05 123,370.05 135,953.80 149,821.09 Revenue (Nescafe) 12,190.68 13,434.13 14,804.41 16,314.46 17,978.53 Cost of sales 6,217.25 6,851.40 7,550.25 8,320.37 9,169.05 Gross Margin 5,973.43 6,582.72 7,254.16 7,994.08 8,809.48 Marketing Costs 2,438.14 2,686.83 2,960.88 3,262.89 3,595.71 Depreciation 271.85 299.58 330.14 363.81 400.92 Distribution expenses 1,058.15 1,166.08 1,285.02 1,416.09 1,560.54 Research and development costs 219.43 241.81 266.48 293.66 323.61 Other trading expenses 153.60 169.27 186.54 205.56 226.53 86.97% 74.10% 60.70% 0.00% 20.00% 40.00% 60.00% 80.00% 100.00% Nescafe Bru Tata Café Brand Strength Score
  • 58. PBM Term Project Page 58 EBITA 1,832.26 2,019.15 2,225.10 2,452.06 2,702.17 Applicable taxes 18.01% 329.99 363.65 400.74 441.62 486.66 NOPAT (Net Operating Profit After Tax) 1,502.27 1,655.50 1,824.36 2,010.45 2,215.51 Capital Employed 10,497.12 11,756.77 13,167.59 14,747.70 16,517.42 Working capital (425.76) (476.85) (534.07) (598.16) (669.94) Net PPE 10,071.36 11,279.92 12,633.51 14,149.54 15,847.48 Capital Charge 8% 839.77 940.54 1,053.41 1,179.82 1,321.39 Intangible Earnings 662.50 714.96 770.95 830.63 894.12 Role of Branding Index 87.16% Brand Earnings 577.44 623.17 671.97 723.99 779.32 Brand Strength Score 86.97% Brand Discount Rate 5.50% Discounted Brand Earnings 547.34 559.89 572.26 584.42 596.29 NPV (Net Present Value) of Discounted Brand Earnings (Years 1–5) 2,860.19 Long-term growth rate 1% NPV of terminal Brand Value (beyond Year 5) 13,383.36 BRAND VALUE (In millions of CHF) 16,243.55
  • 59. PBM Term Project Page 59 Assumptions: (basic, rest in excel file) Considering the fact that coffee has achieved a healthy value of penetration in global markets, we have assumed a long term growth rate of 1% (to check for maturity in the product category) The capital charge is equal to the WACC value of 8% The discount rate is taken as 5.5% which is the highest value of the risk-free government bonds of the Switzerland bonds (since the balance sheet details have been taken from the parent company which are in Swiss Franc (CHF)) Based on these assumptions, the brand value of Nescafe has been found to be CHF 16243.55 million which translates to US$17485.04 million (US$17.48 billion). This value is in line with the valuation undertaken by Thomson Reuters Fundamentals and Worldscope via FactSet Research Systems; Forbes. (http://www.forbes.com/companies/nescafe/) INFERENCES & RECOMMENDATIONS 1. Nescafe scored low on Understanding in comparison to other factors which means that consumers feel that it might not be getting the perceptions of the consumers correctly. We recommend that Nescafe work on this attribute. 2. The brand value of Nescafe was fairly high and in global indices it is ranked higher than the parent company Nestle which shows the strength of the brand. 3. Bru is a close second in many aspects and Nescafe needs to work in this aspect. Being the oldest instant coffee brand it needs to maintain its position. 4. Seeing the current status of Nescafe we can suggest that it should maintain it‘s hold over the coffee market (i.e. DO NOTHING!).
  • 60. PBM Term Project Page 60 REFERENCES AND BIBLIOGRAPHY The Story - NESCAFÉ MY NESCAFÉ | Life Without Compromise. Nescafé Brand | Coffee and Beverage Industry | brandchannel.com 1938 Nescafé - The first drinkable instant coffee | Nestlé Global Nescafé - Wikipedia, the free encyclopedia Nescafé's early-bird advantage | Business Standard