Download to read offline
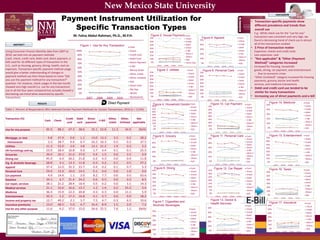

The document analyzes the trends in payment method utilization at New Mexico State University from 2007 to 2010, highlighting a decline in check usage across various transactions while exploring the prevalence of other payment methods like cash, credit, and direct payments. Specific transaction types reveal differing patterns in payment preferences, particularly in sectors such as housing, groceries, and healthcare. The findings point to an overall shift towards more direct payment options and electronic billing in response to economic factors.


![Small Steps to Health and Wealth [Prezi]- NM Conference on Aging 2013](https://cdn.slidesharecdn.com/ss_thumbnails/sshw2013-130822170441-phpapp02-thumbnail.jpg?width=640&height=640&fit=bounds)


