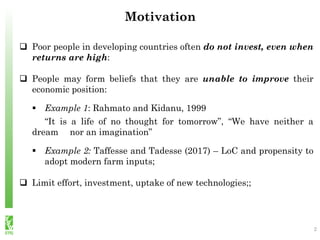
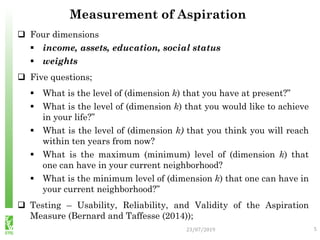
1) The document summarizes an experimental study that examined whether exposing rural Ethiopian parents to "role model" documentaries could positively impact their educational and financial aspirations, especially for girls.
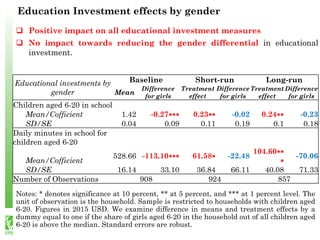
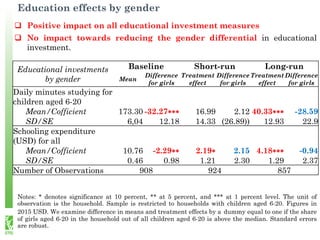
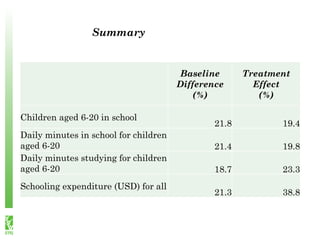
2) The study found that while the documentaries increased overall parental aspirations and investments in children's education, it did not reduce the pre-existing gender gap in aspirations and investments, which were on average lower for girls compared to boys.
3) Five years after the screenings, the positive impacts on aspirations and investments in education remained, but again the gender differences were not significantly impacted.

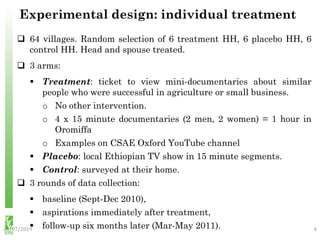

![Education Aspiration effects by gender
Baseline Short-run Long-run
Mean
Difference
for girls
Treatment
effect
Difference
for girls
Treatment
effect
Difference
for girls
Aspirations for education
(years)
Mean/Coefficient 14.08 -0.47∗∗∗ 0.27∗ -0.1 0.28∗ 0.09
SD/SE 2.42 0.11 0.15 0.27 0.16 0.29
[=1] if aspires beyond
secondary education
Mean/Coefficient 0.6 -0.09∗∗∗ 0.05∗ -0.03 0.05∗ 0.01
SD/SE 0.49 0.02 0.03 0.05 0.03 0.05
Observations 1970 1932 1780
Notes: * denotes significance at 10 percent, ** at 5 percent, and *** at 1 percent level. The unit of
observation is the individual parent. Sample is restricted to households with children aged 6-20.
Figures in 2015 USD. We examine difference in means and treatment effects if the eldest child is a
girl. Standard errors are clustered at household level.
Mean educational aspiration – about half-a-year lower for girls;
Aspirations beyond secondary education – 9 percentage points (or 15
percent) lower for girls.
Positive impact on overall educational aspirations,
No impact towards reducing the gender differential.](https://image.slidesharecdn.com/parentalaspirationsforchildrenseducationeeajuly182019-191001075905/85/Parental-aspirations-for-children-s-education-8-320.jpg)