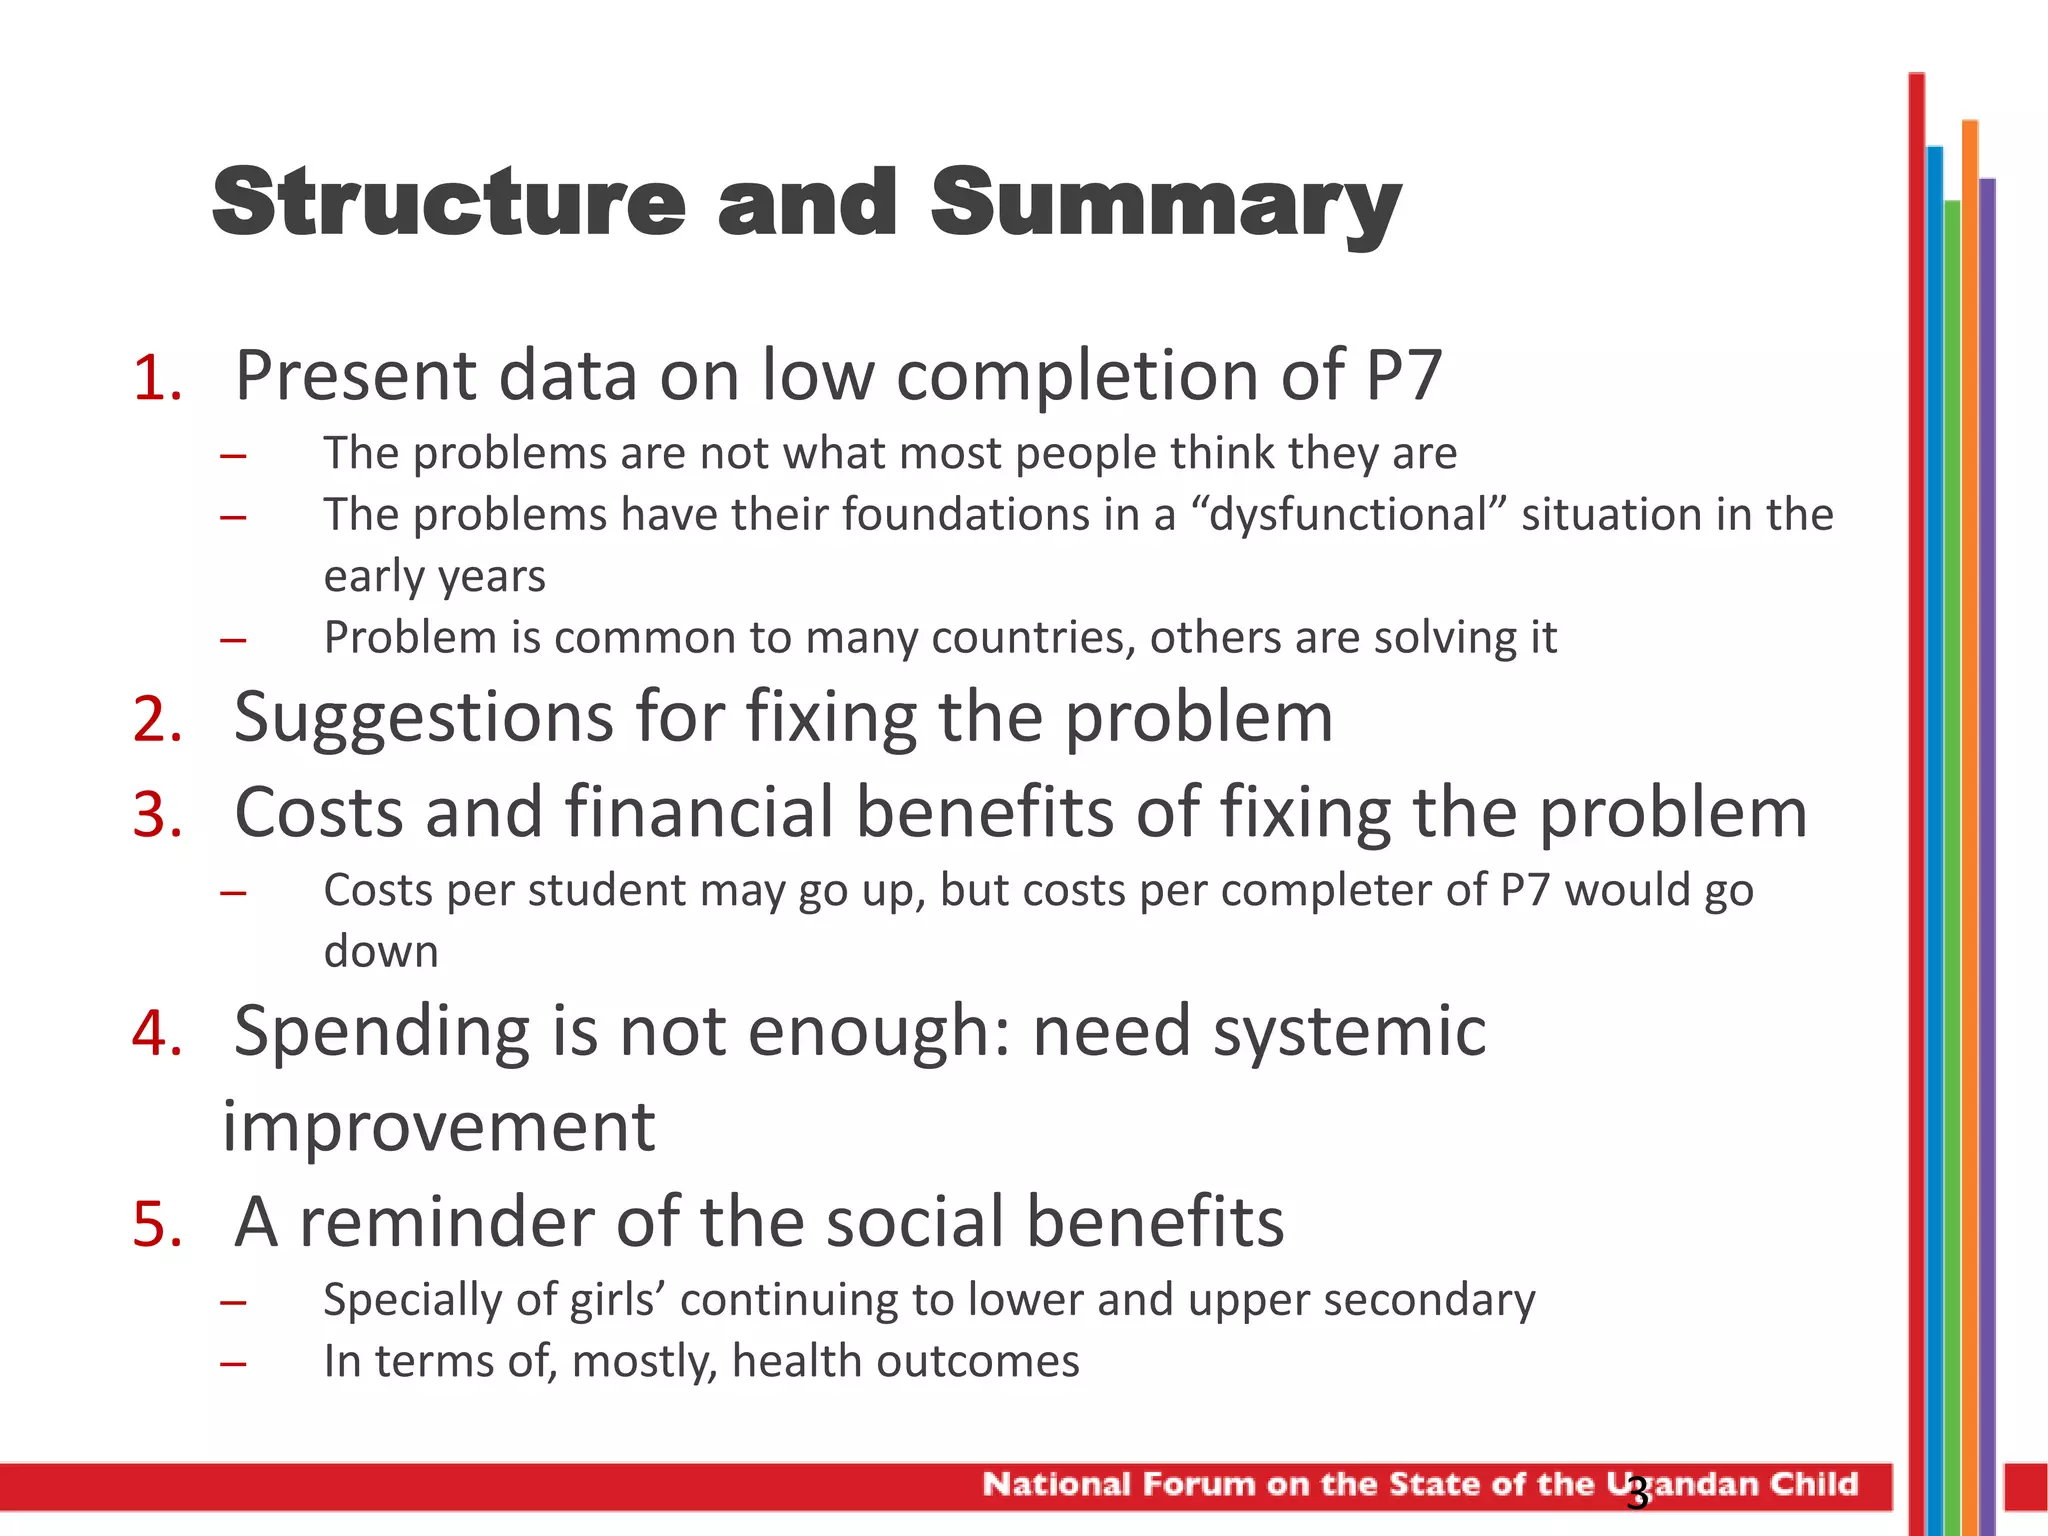
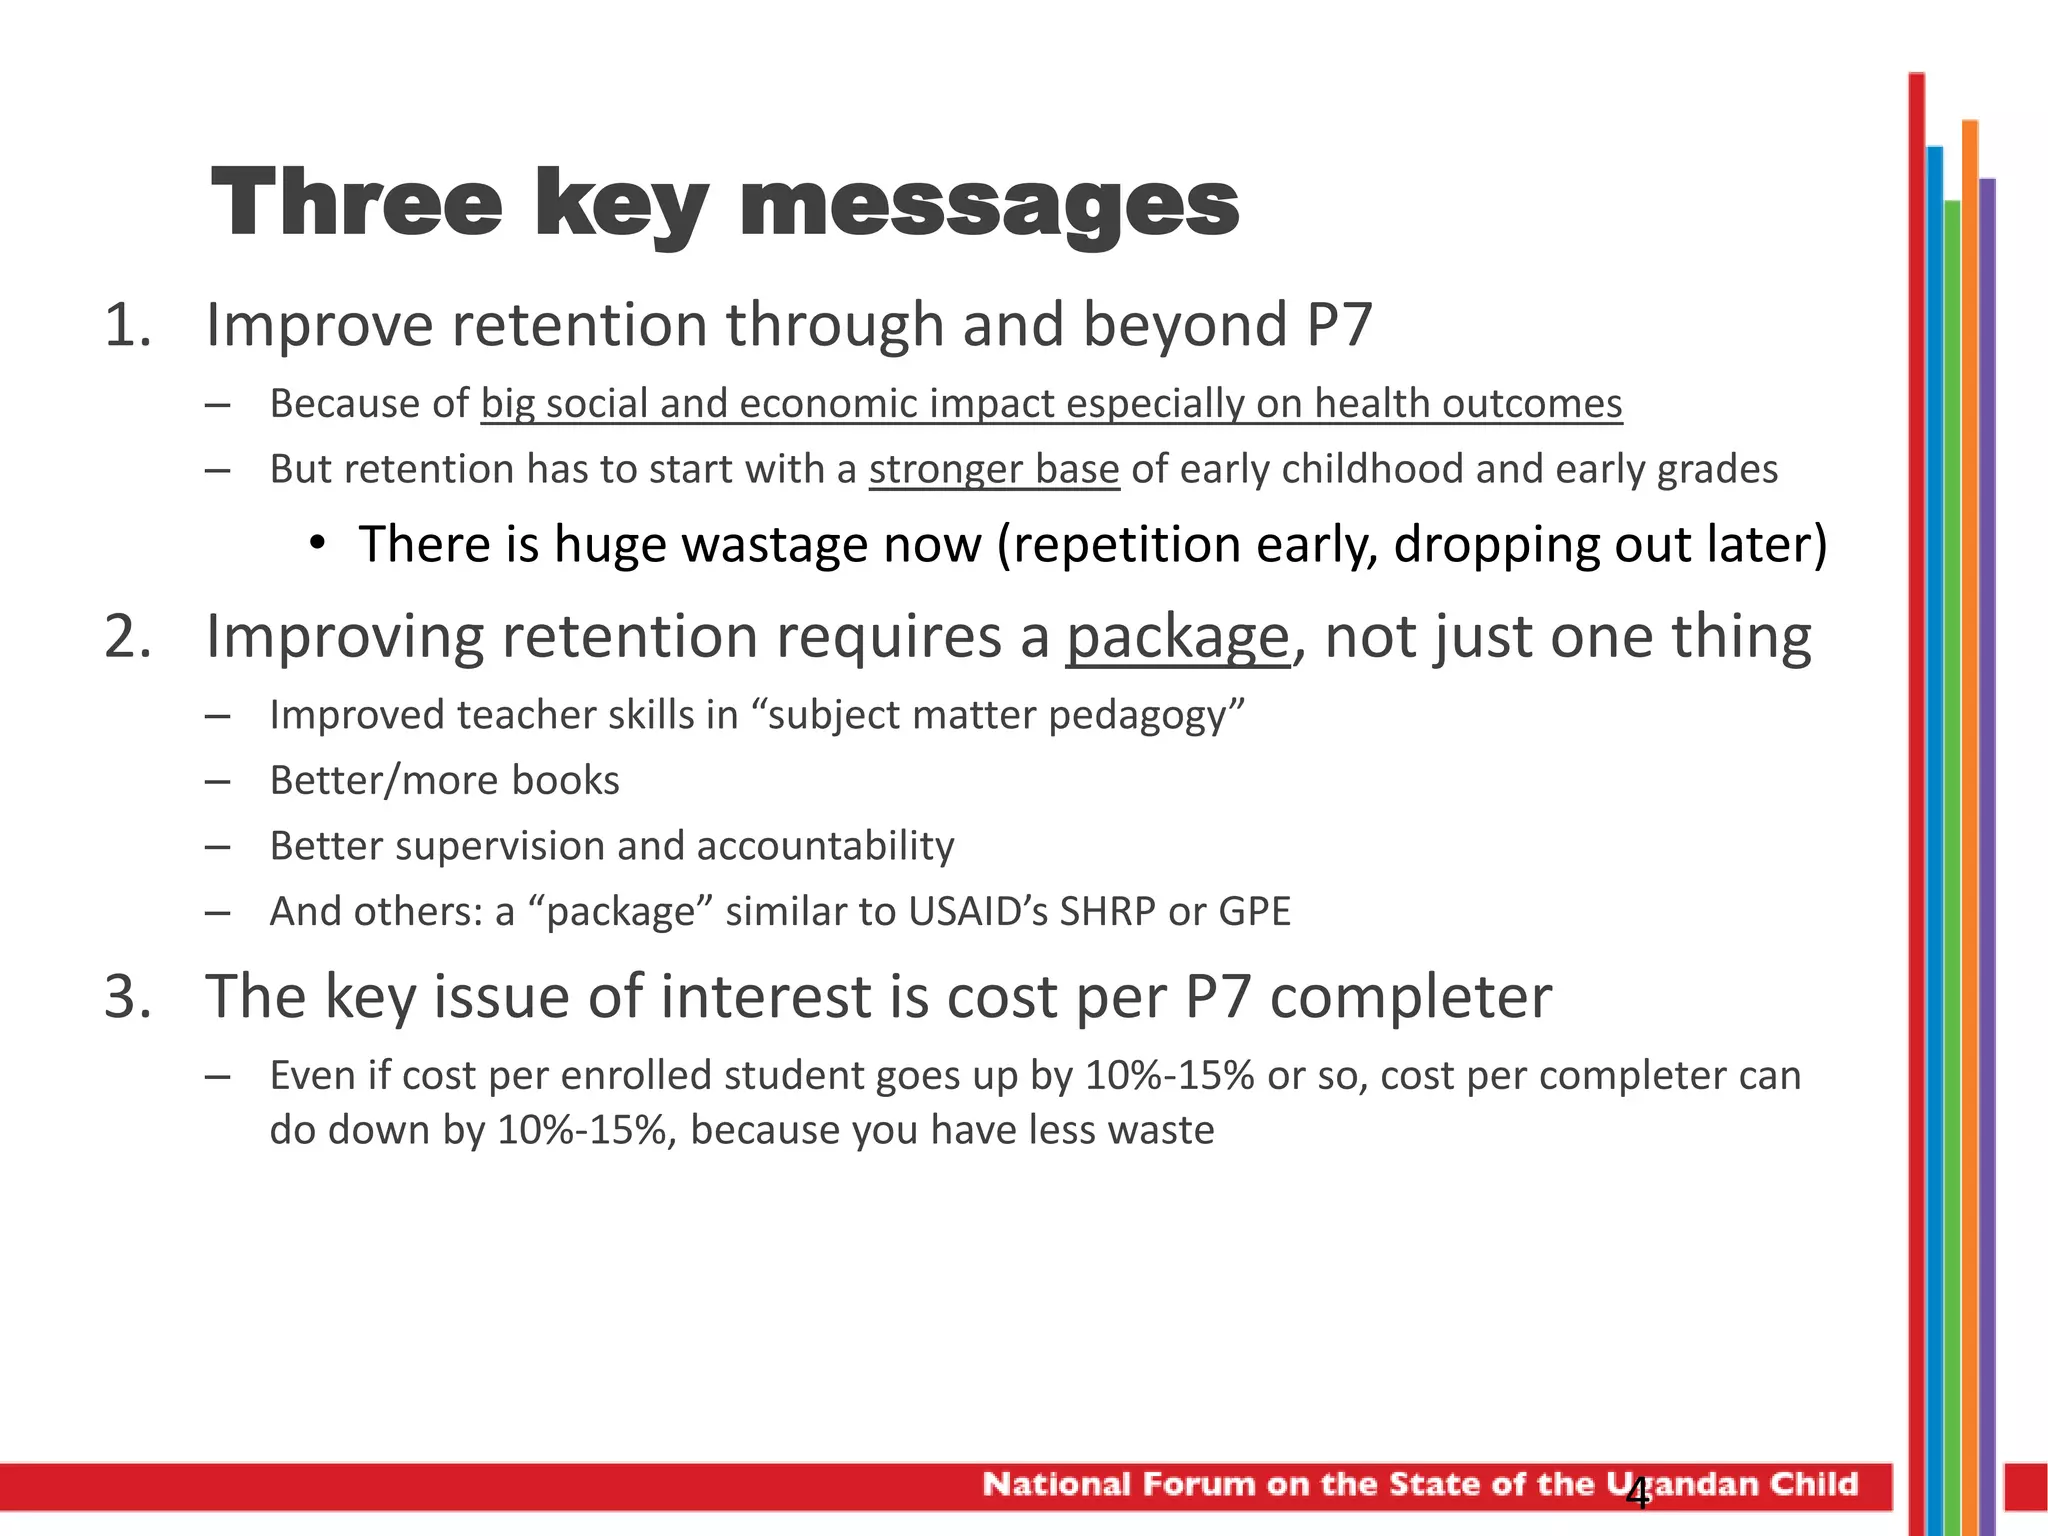
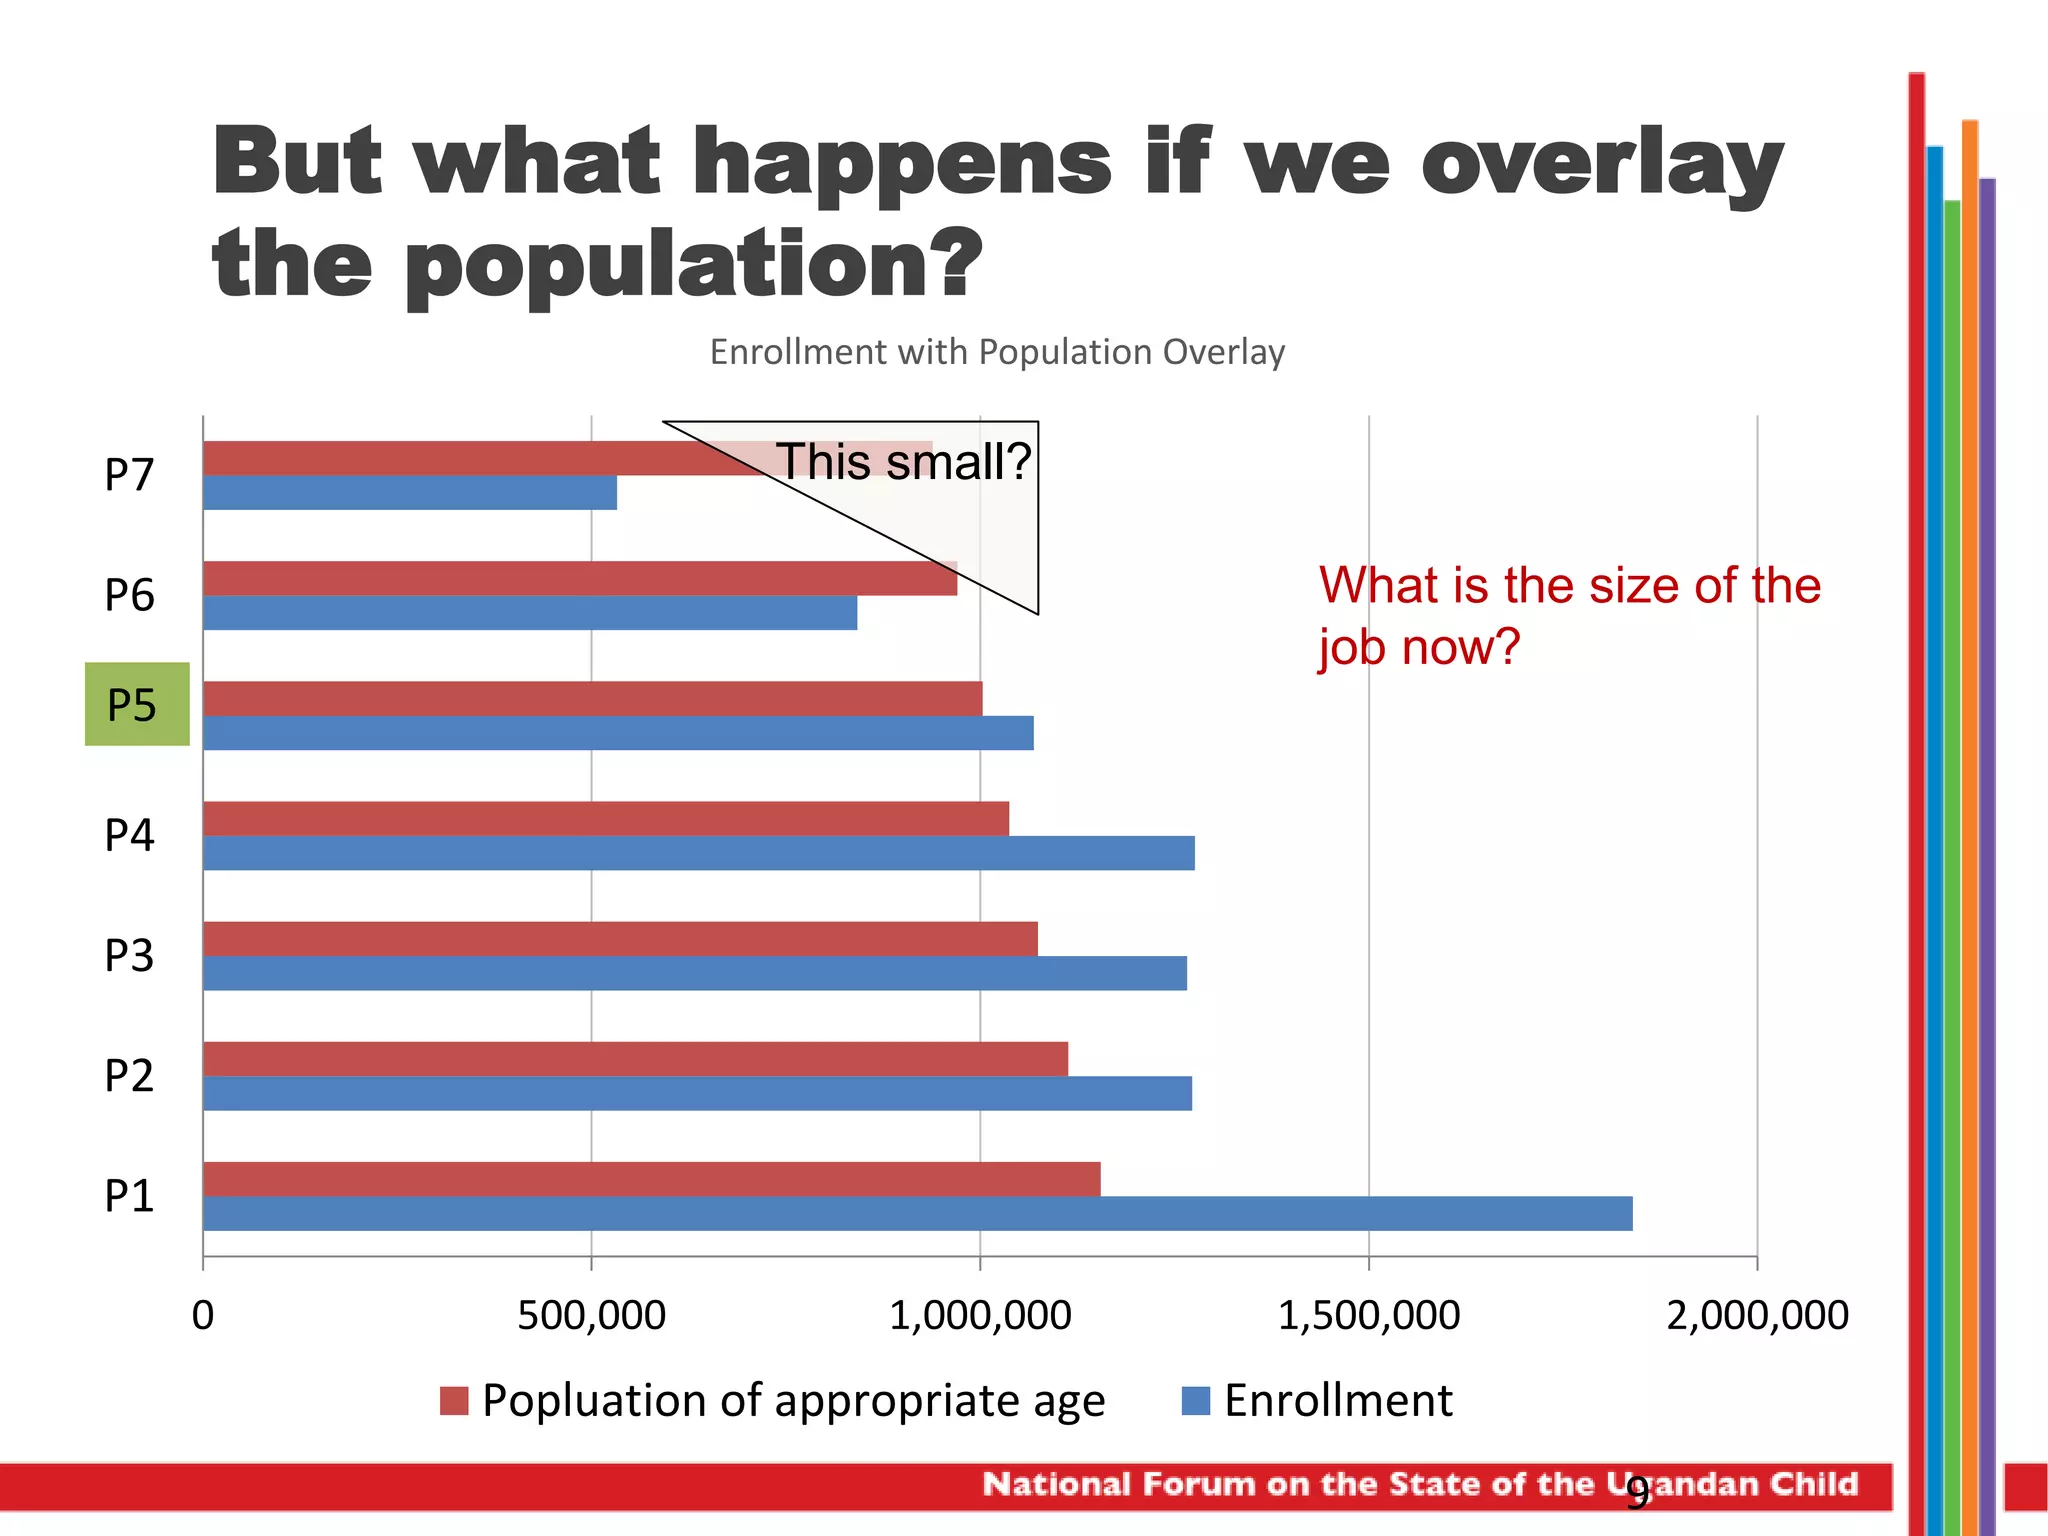
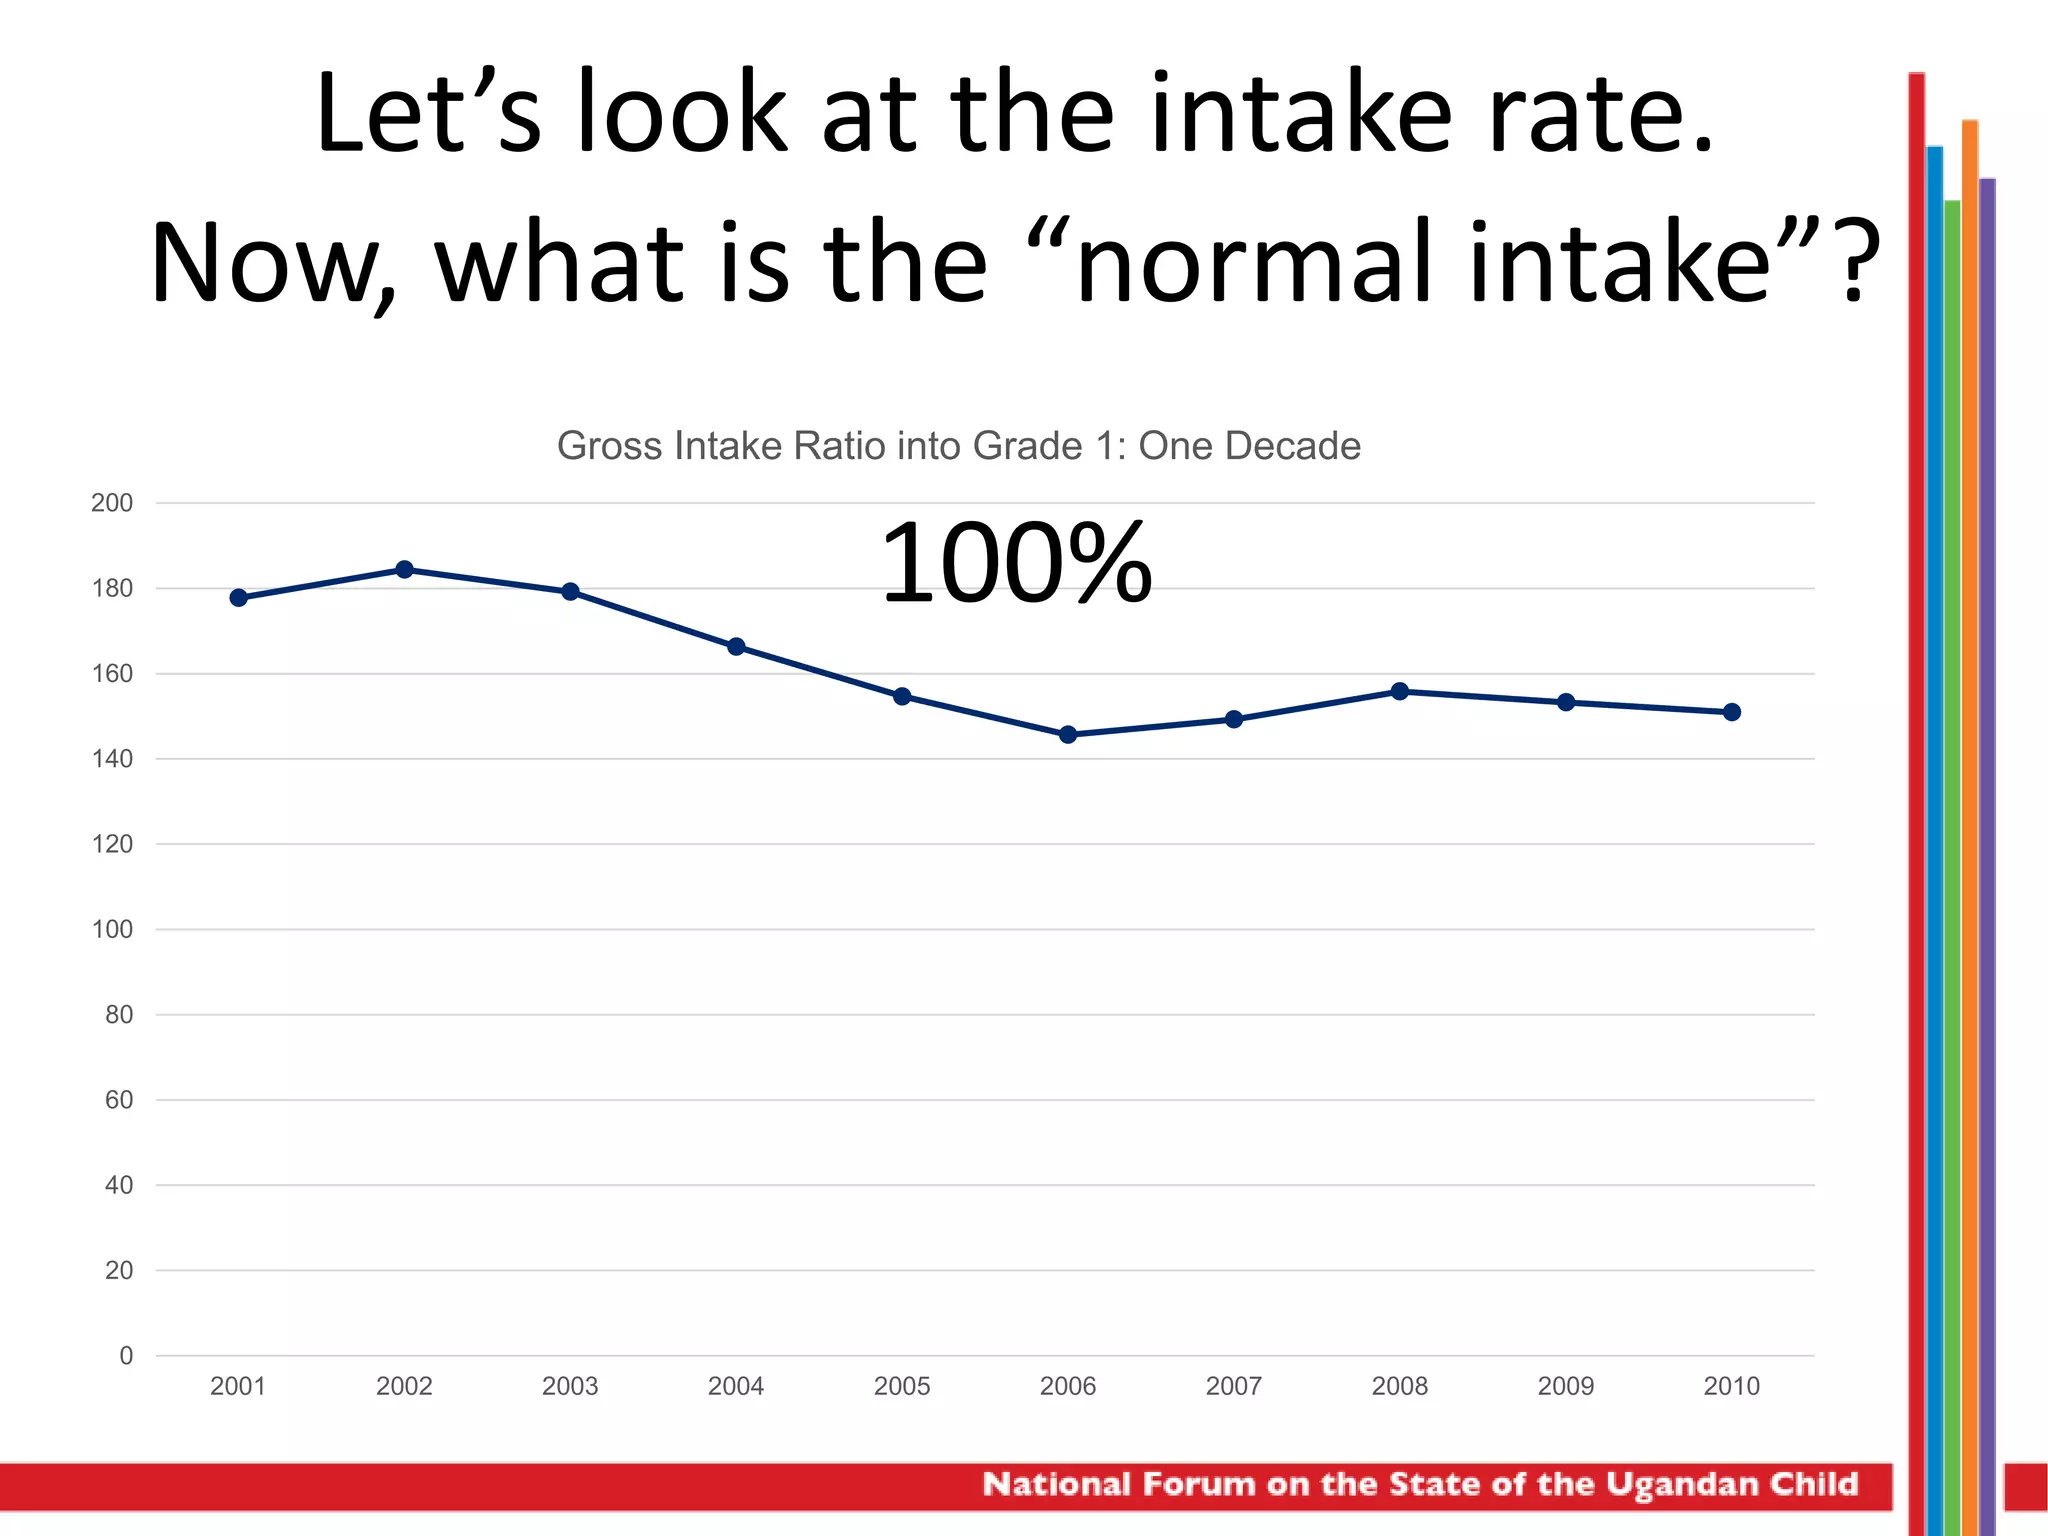
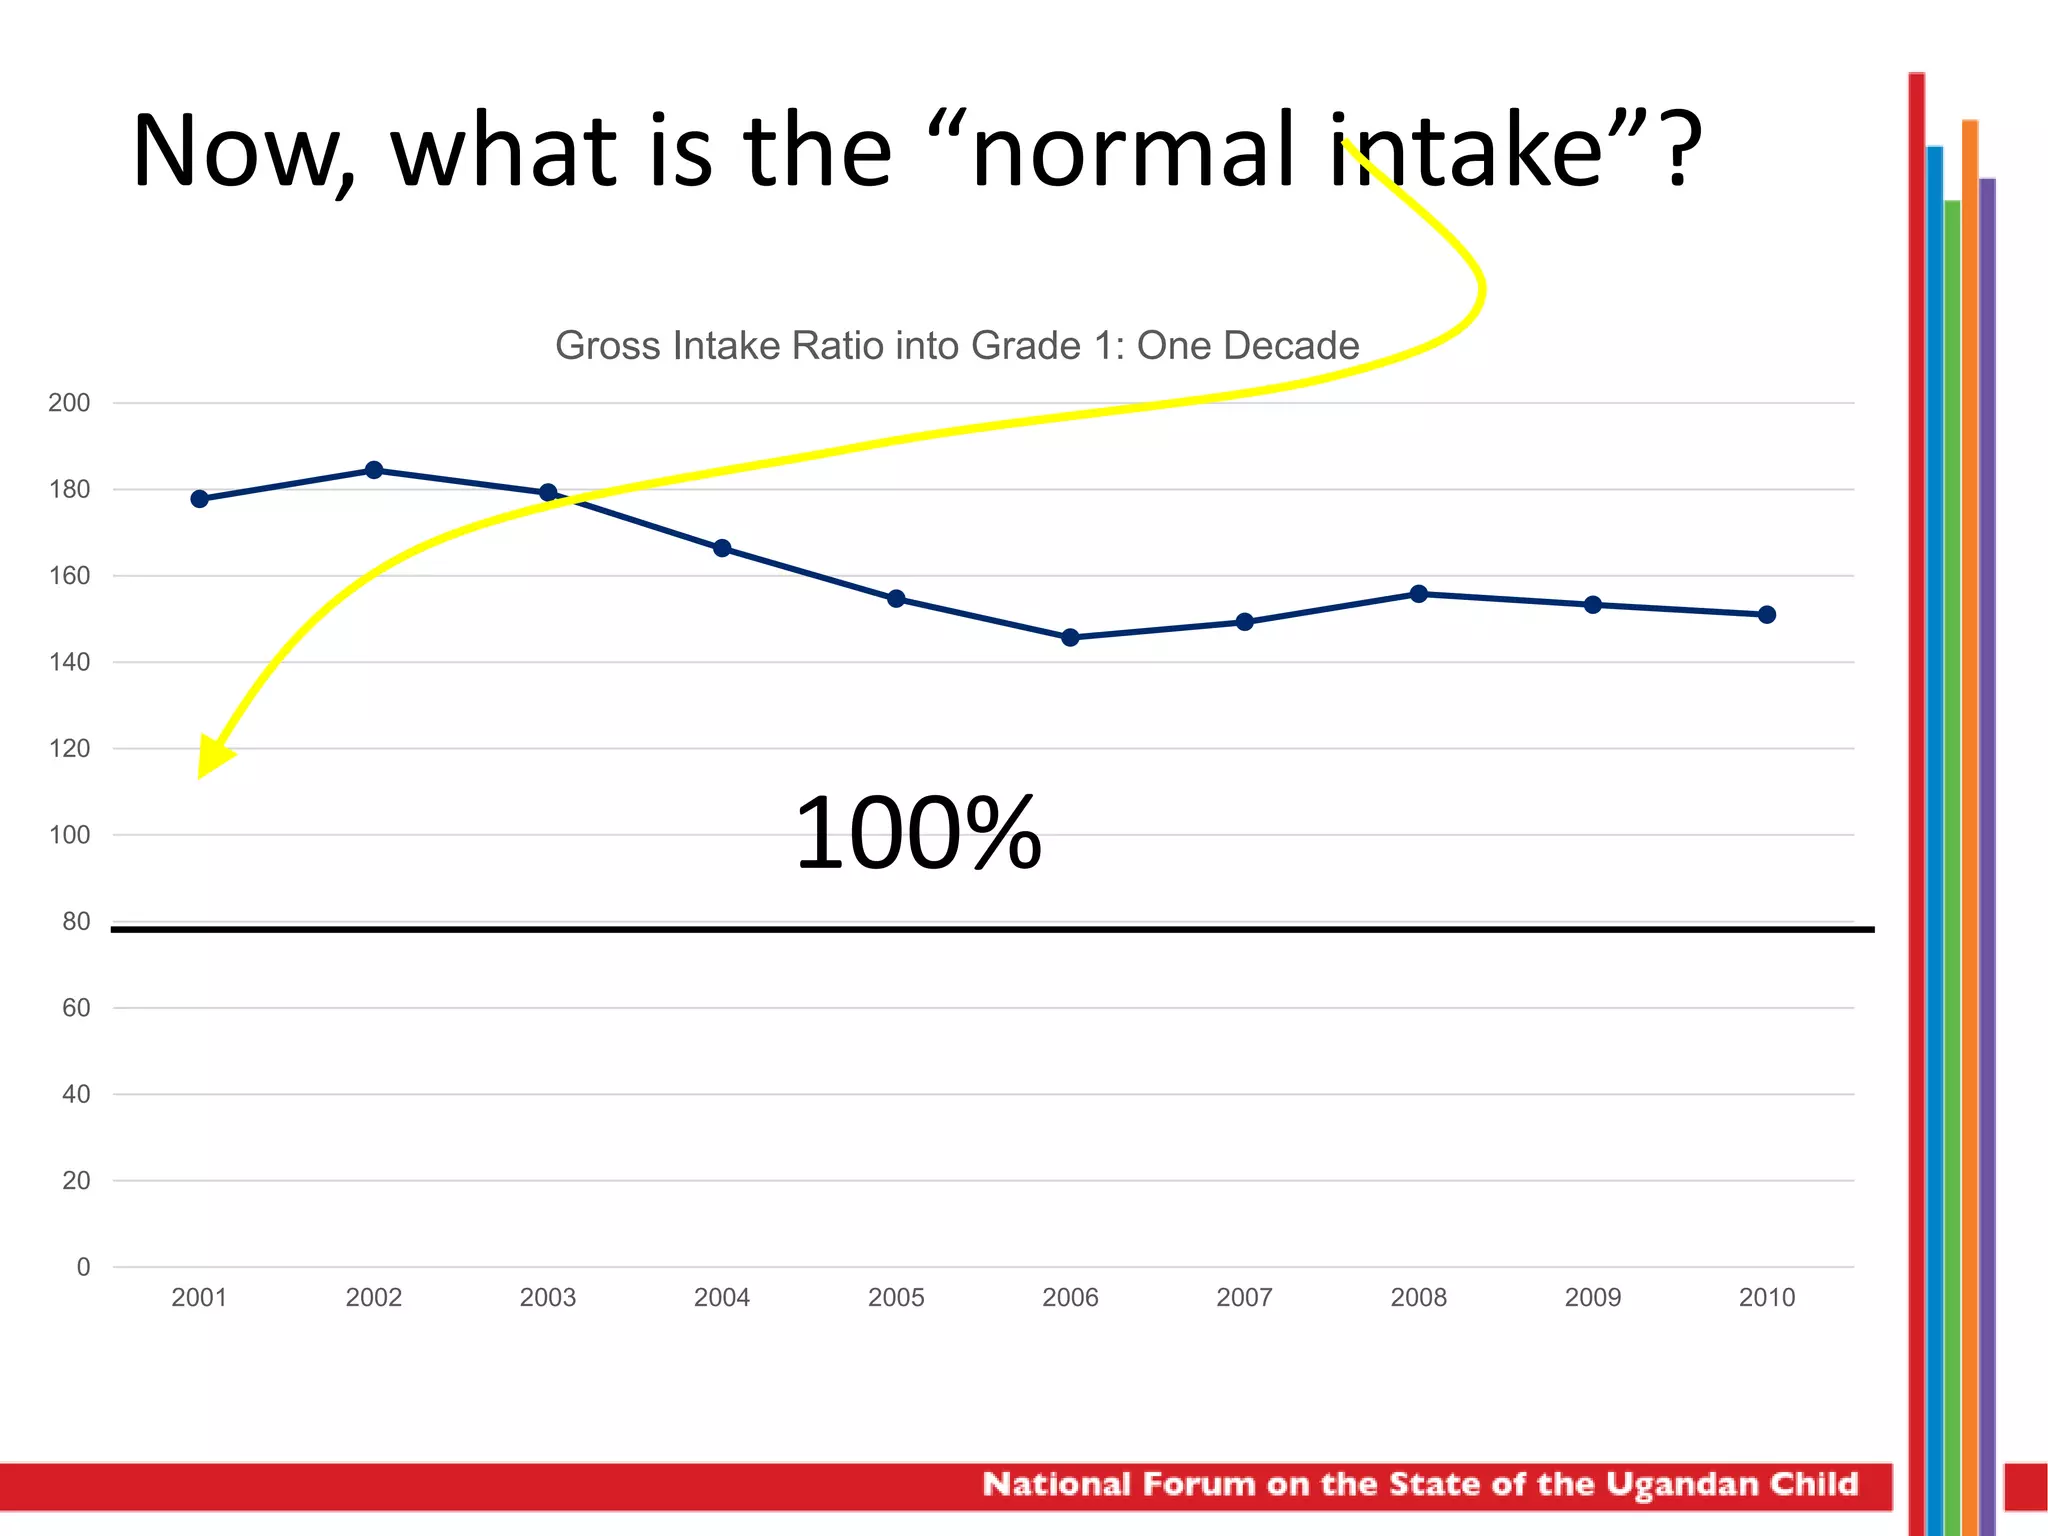
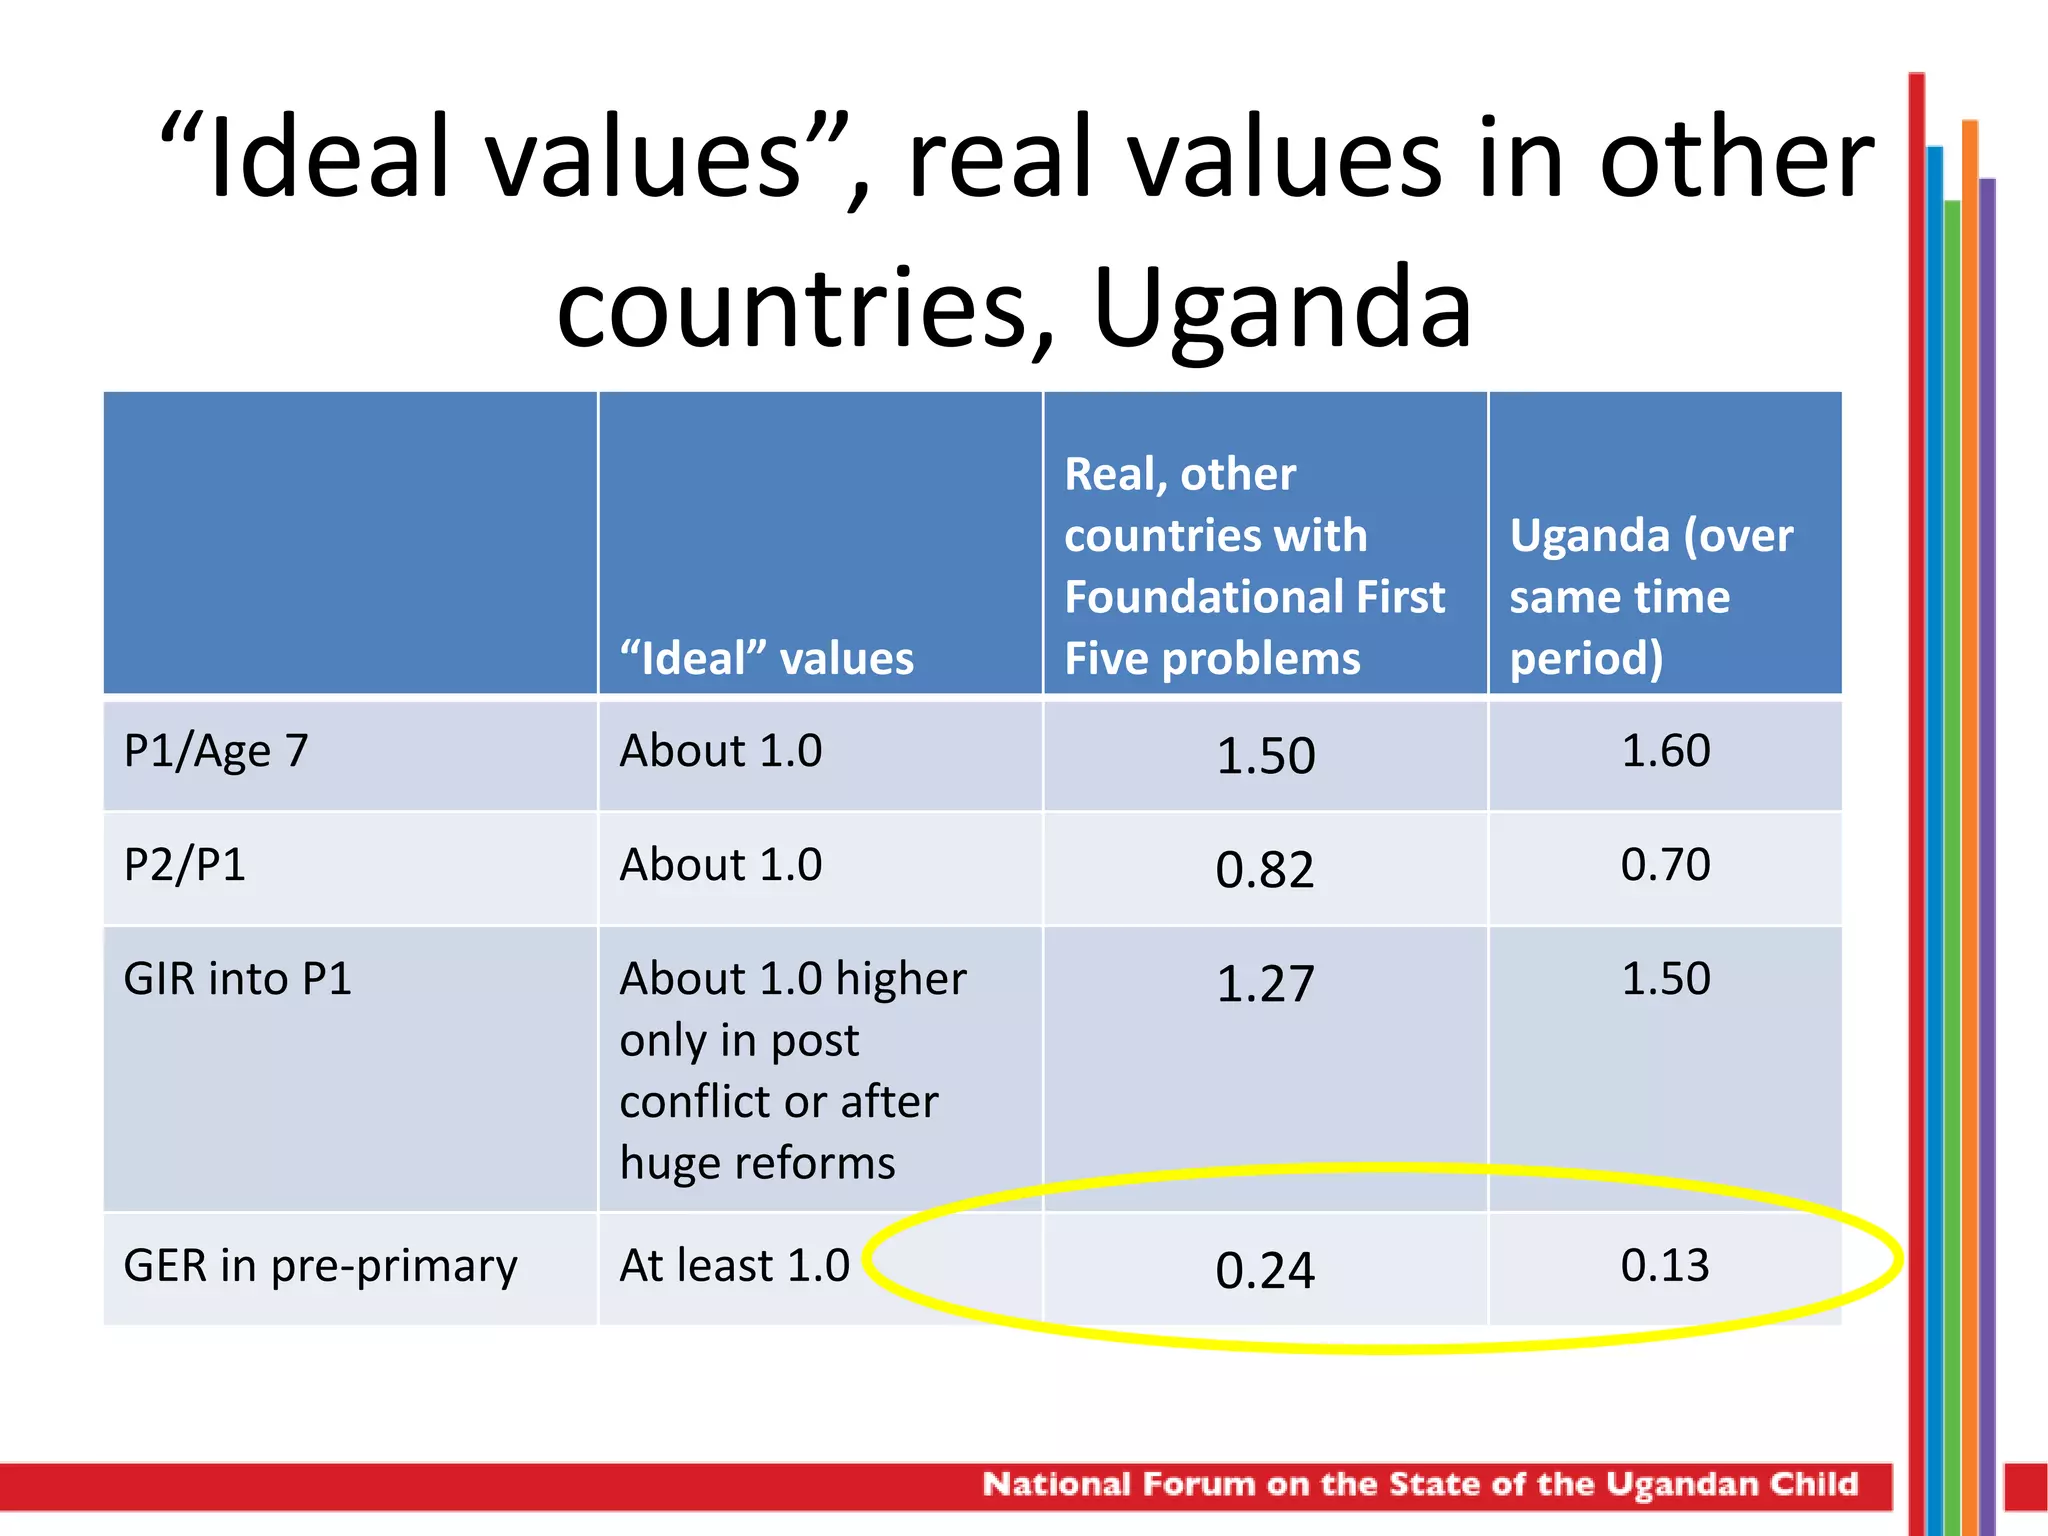
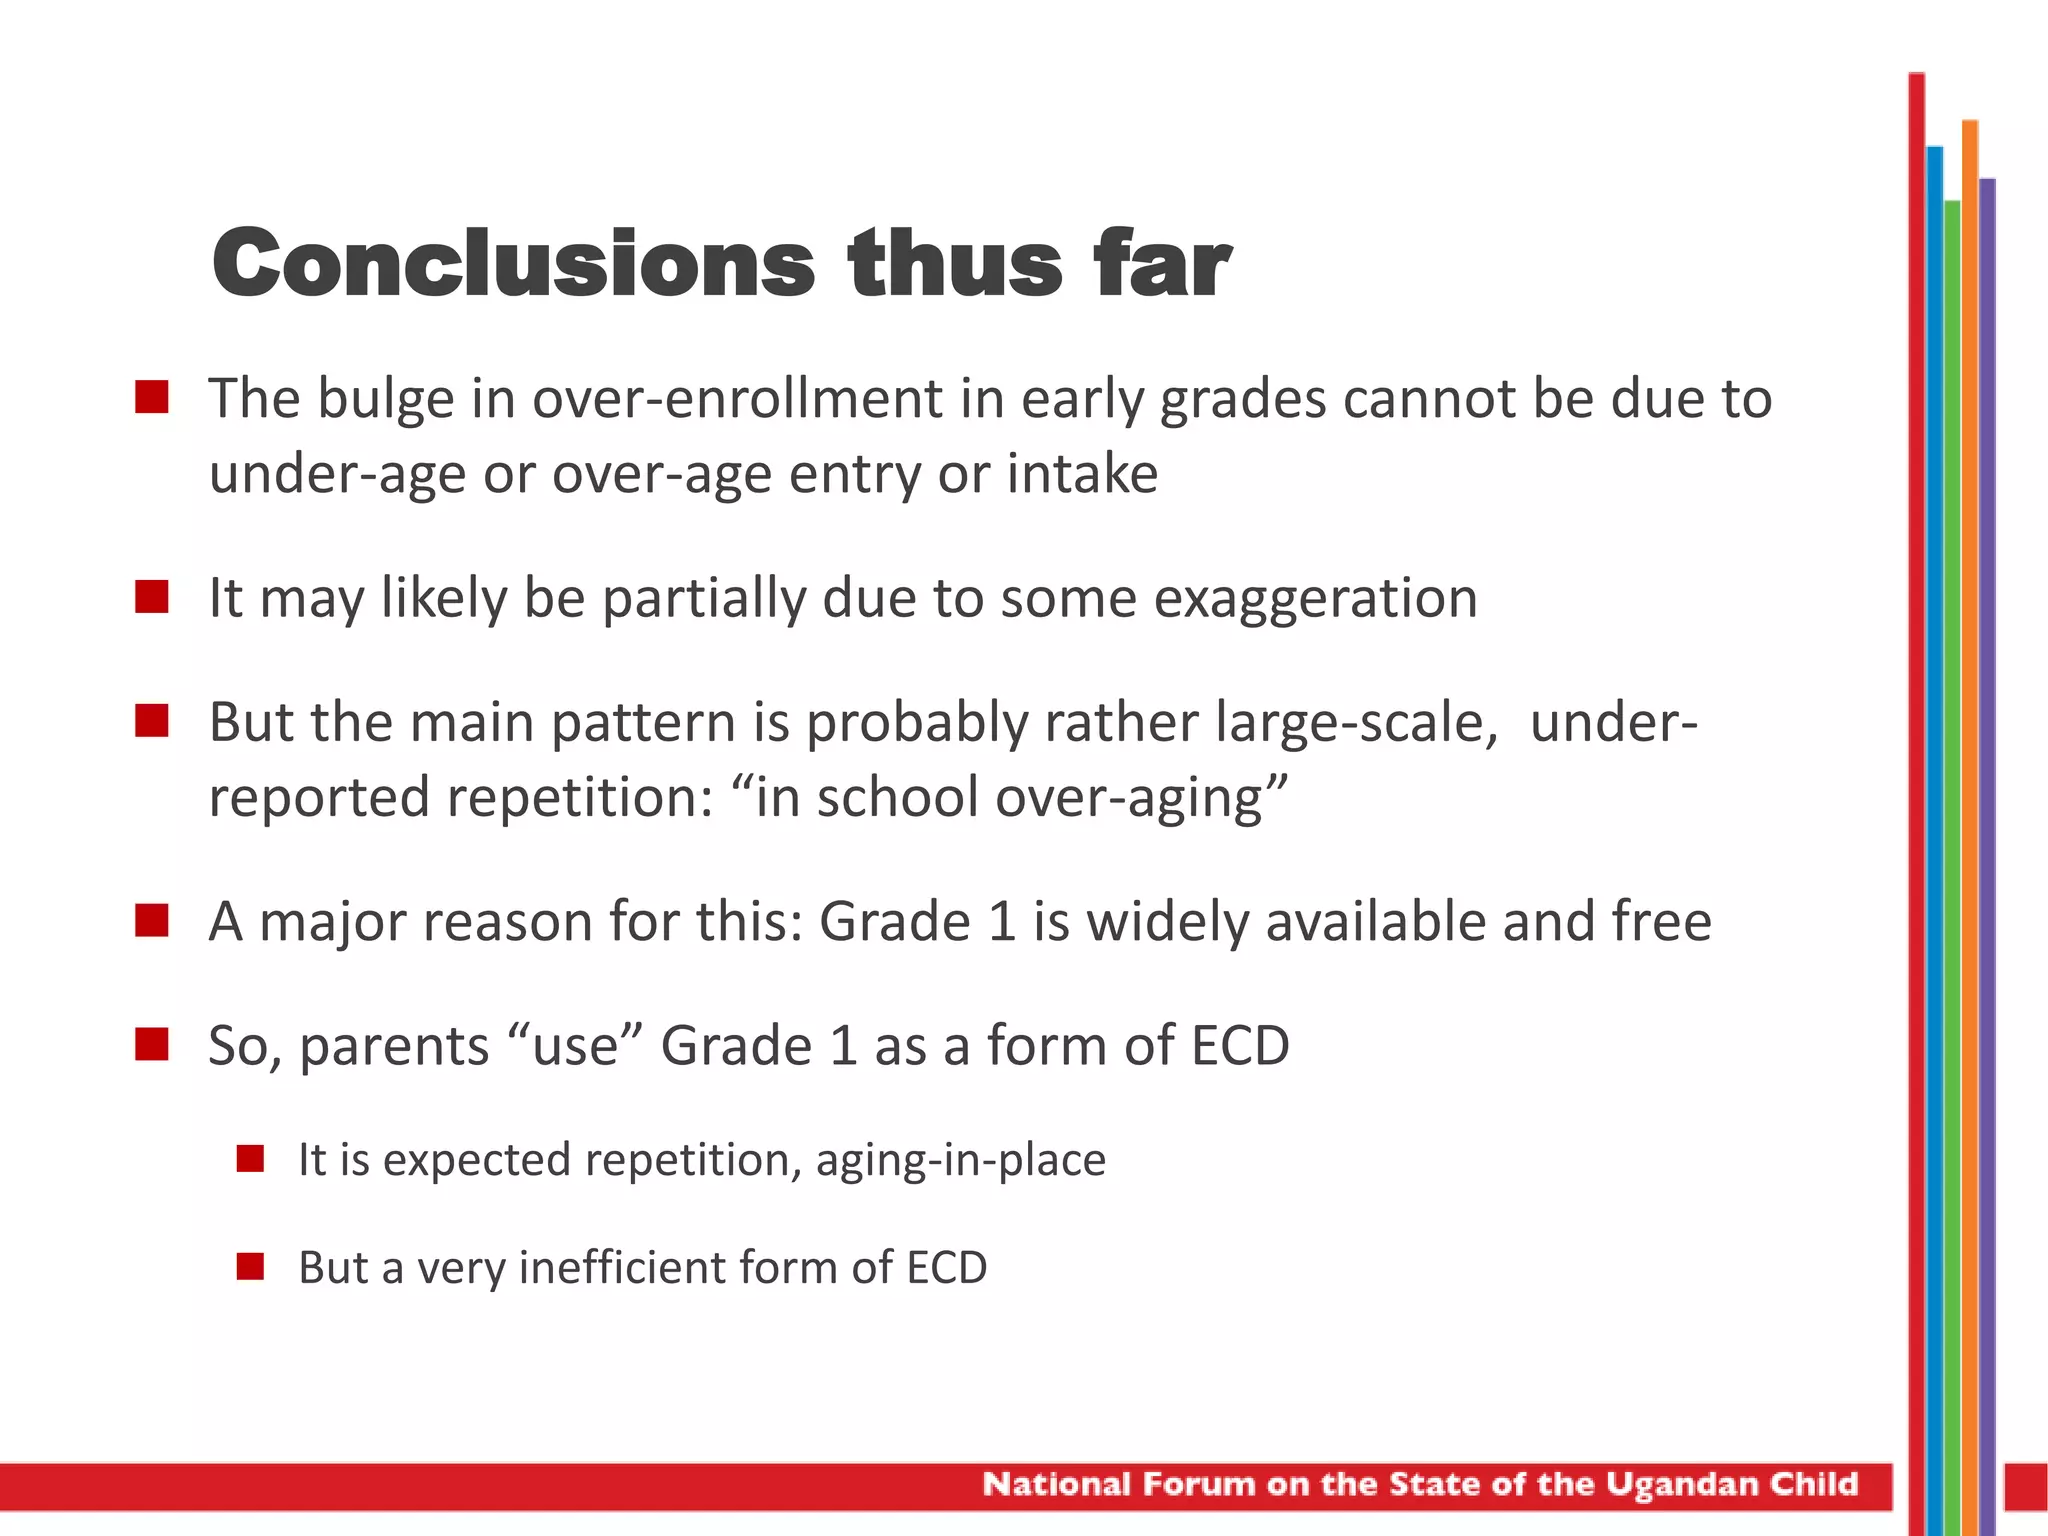
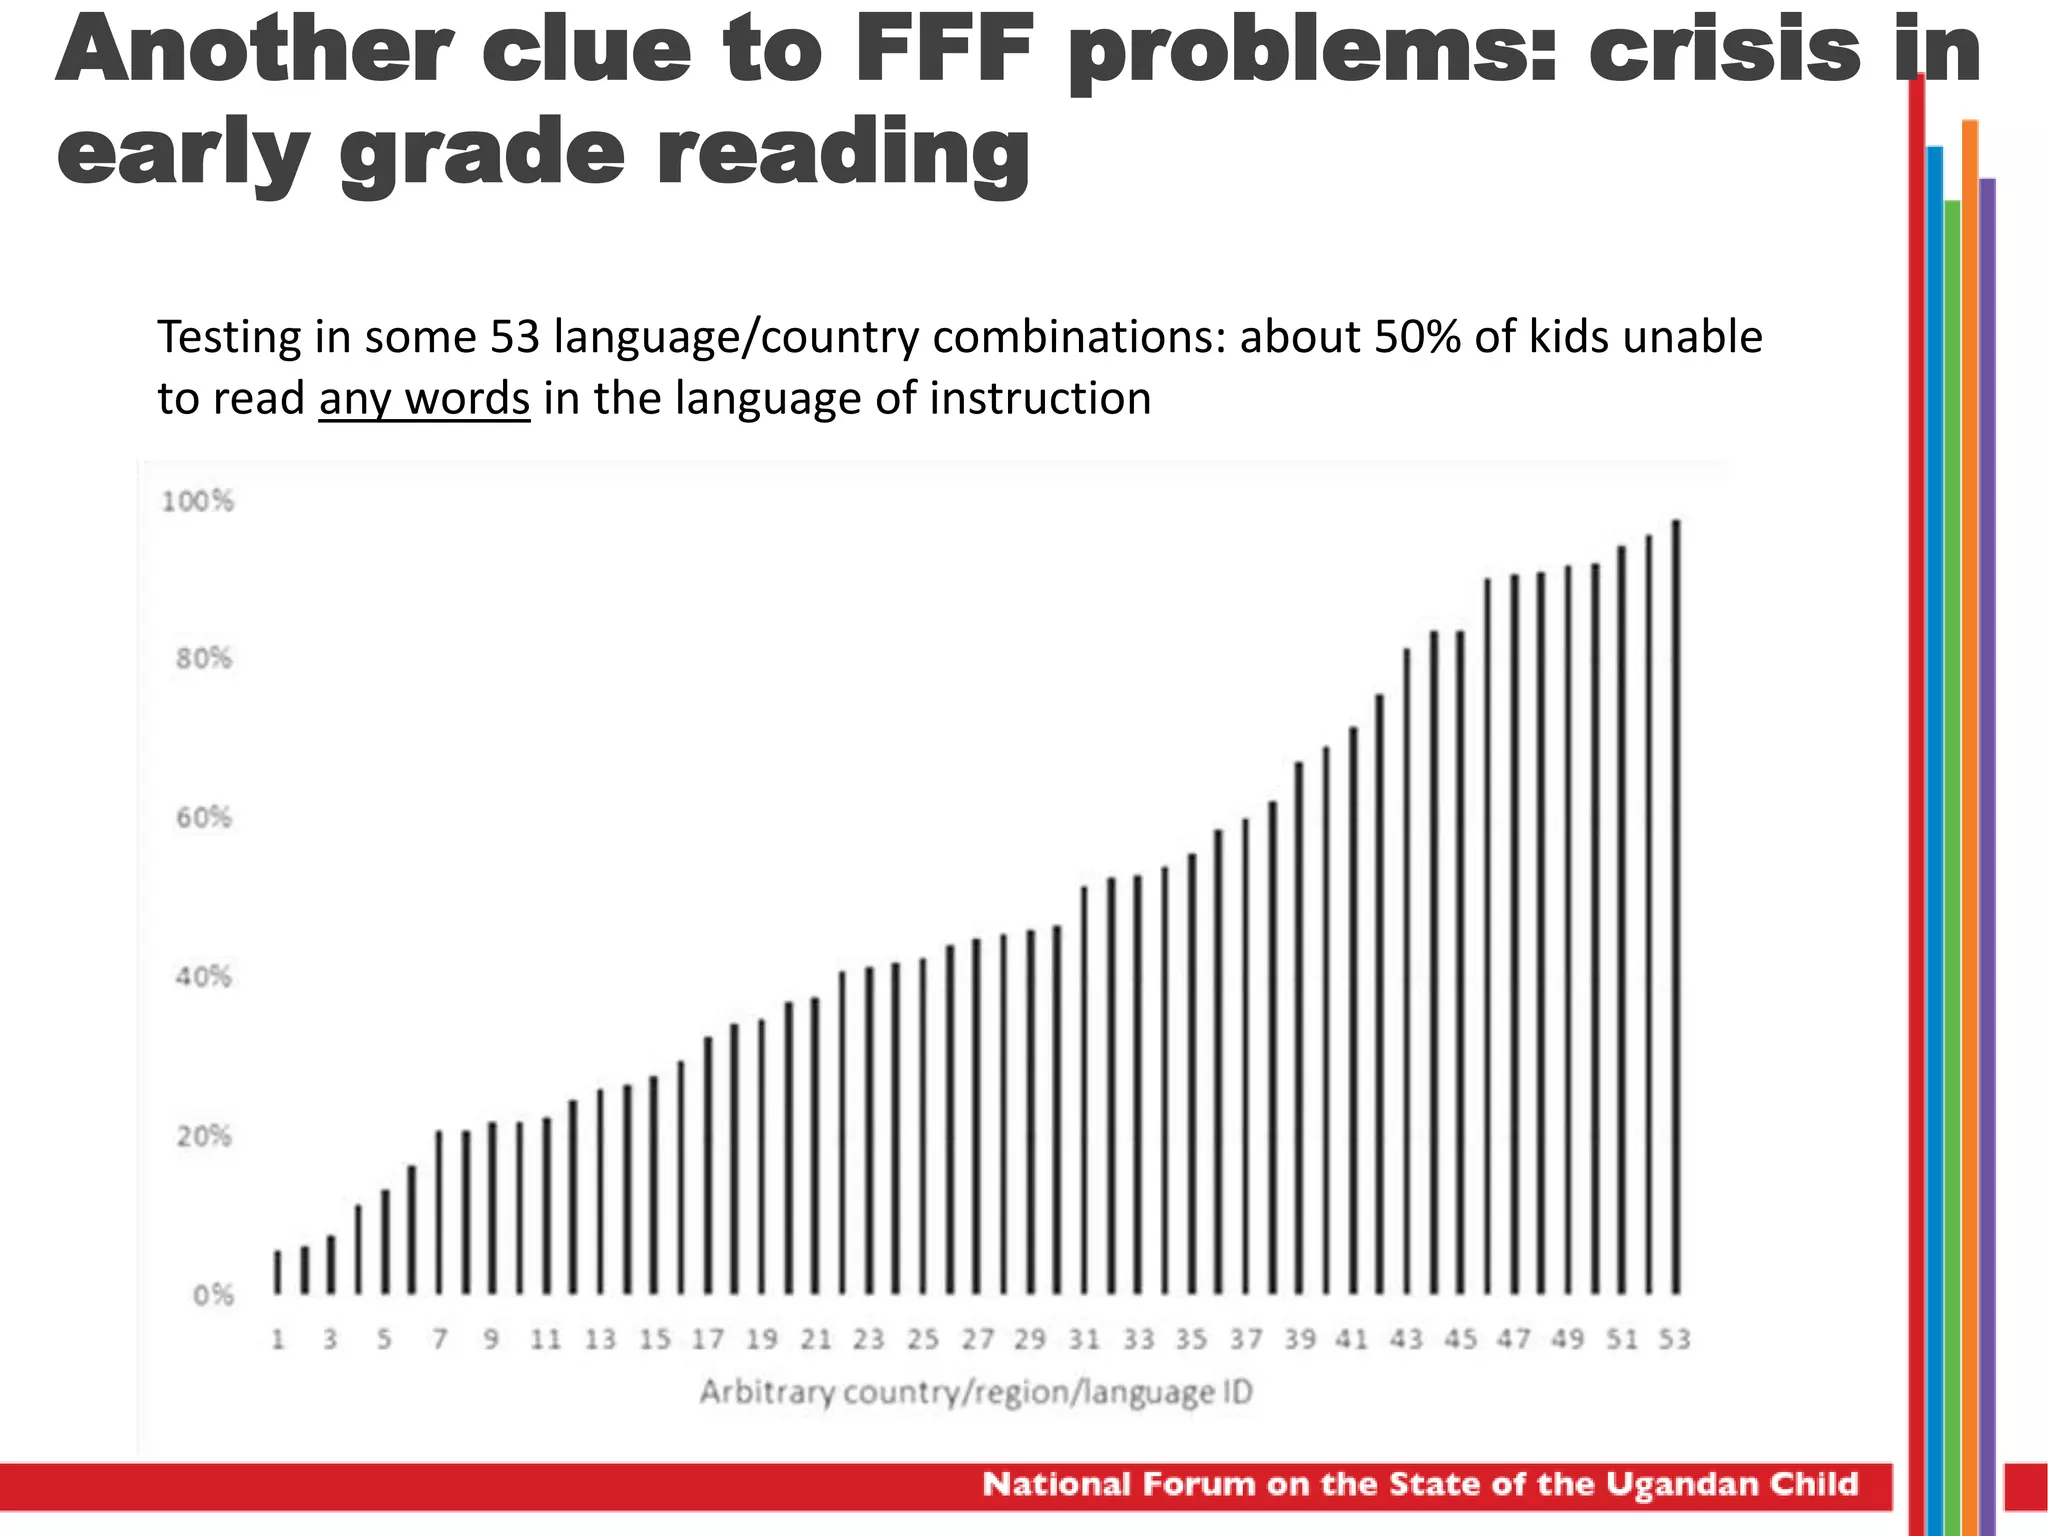
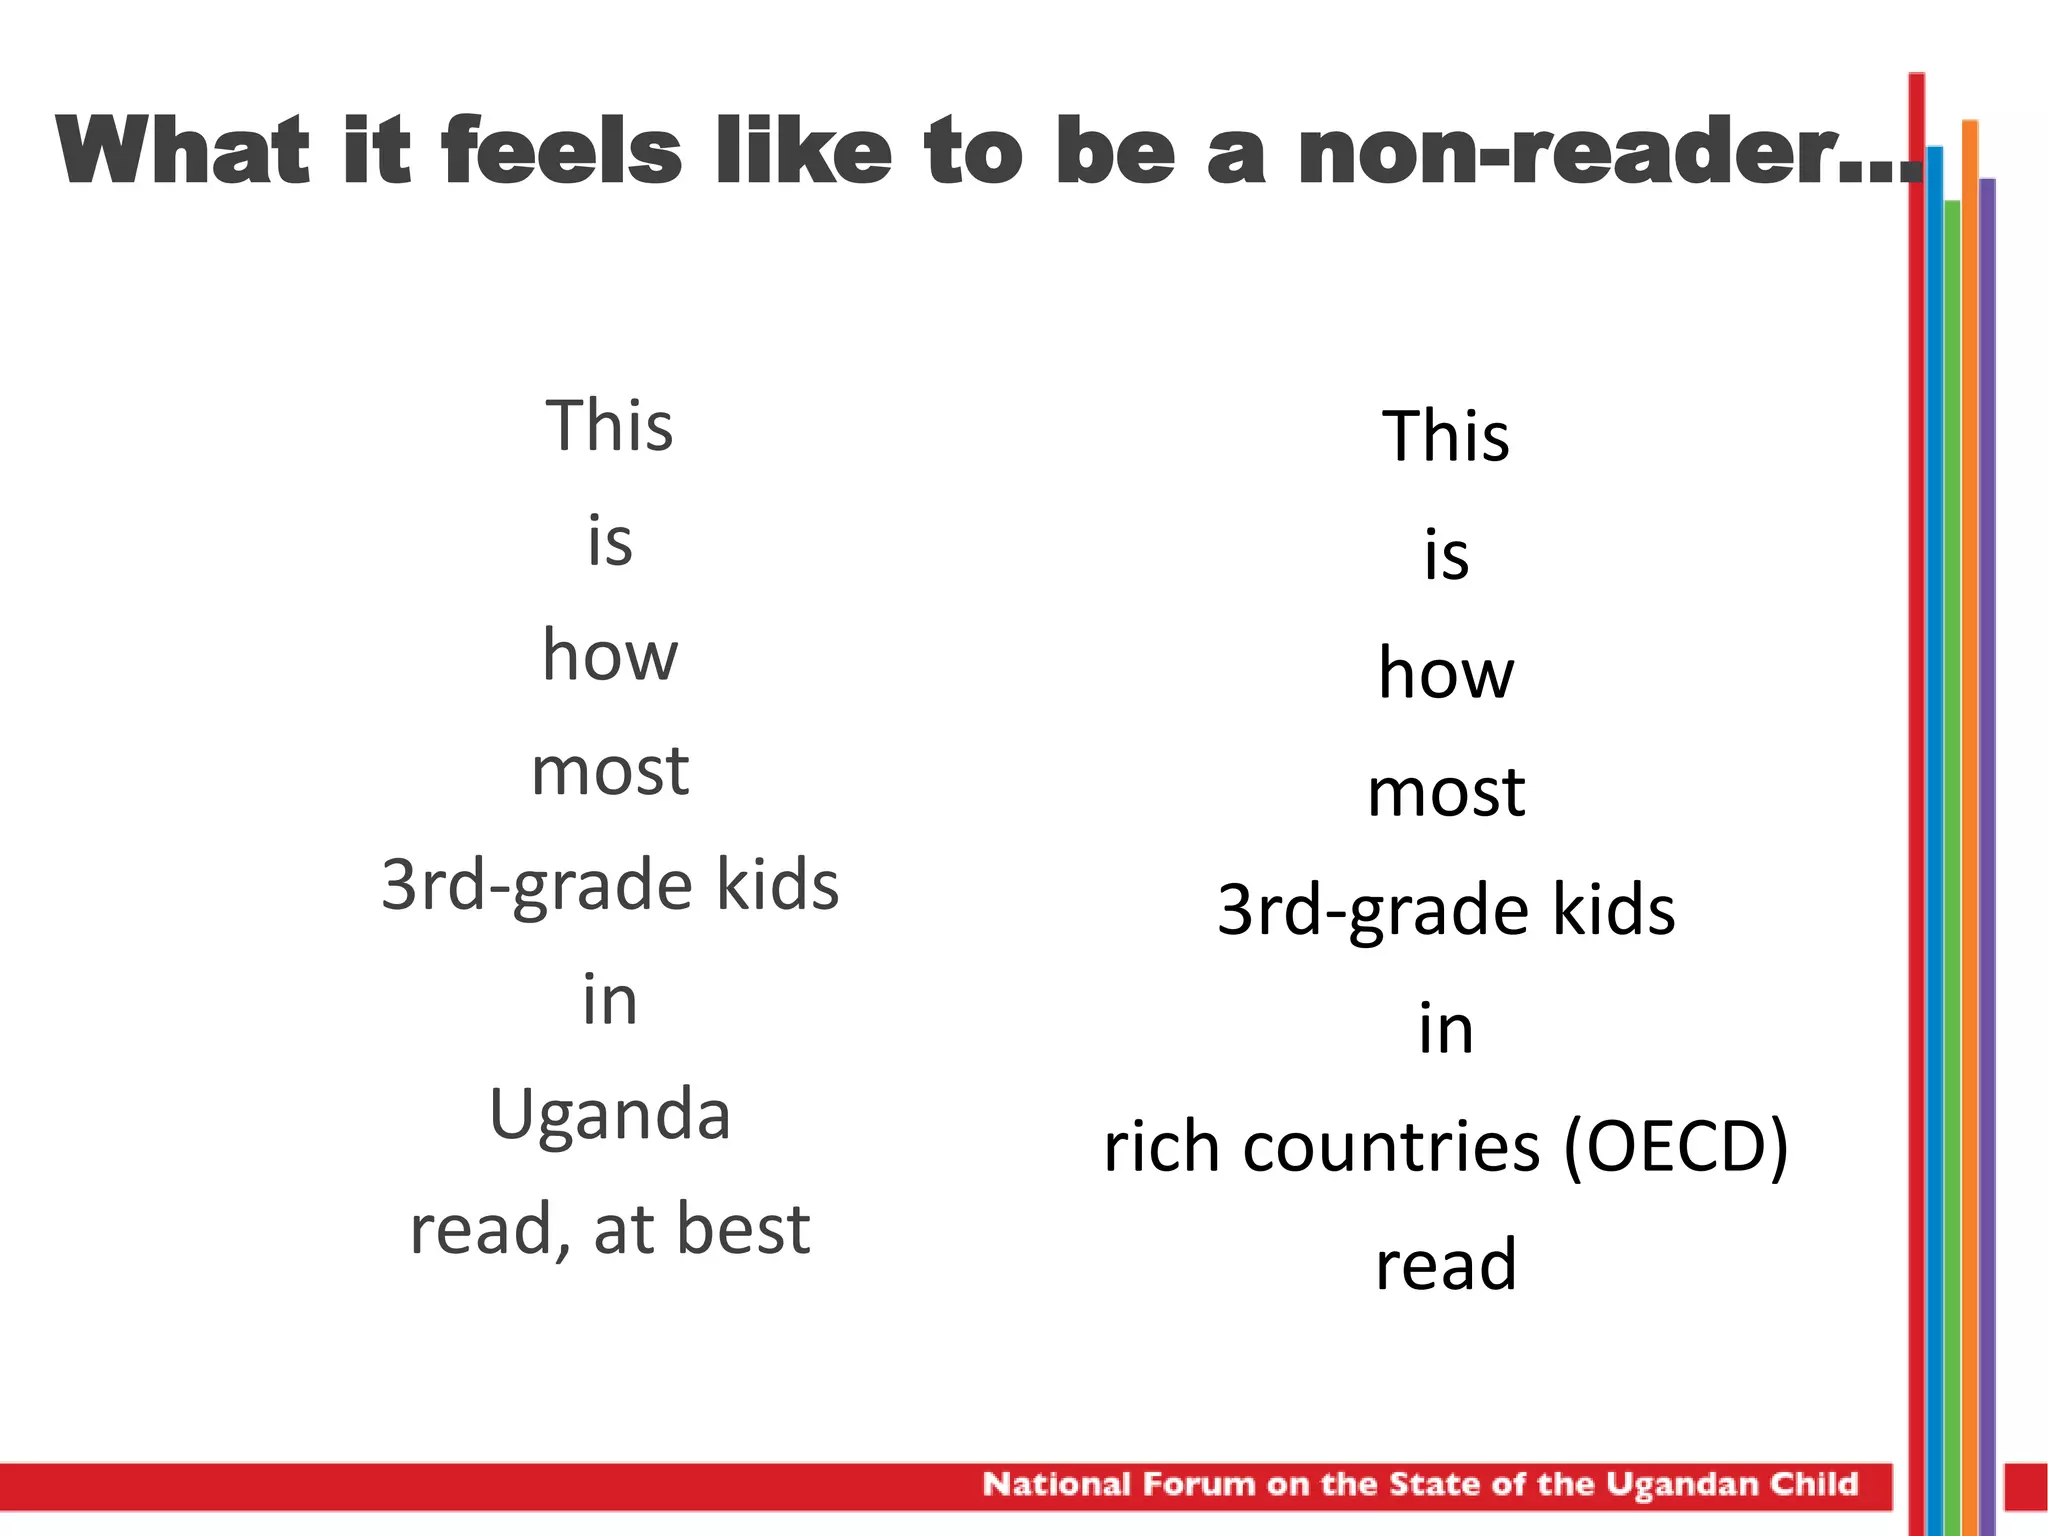
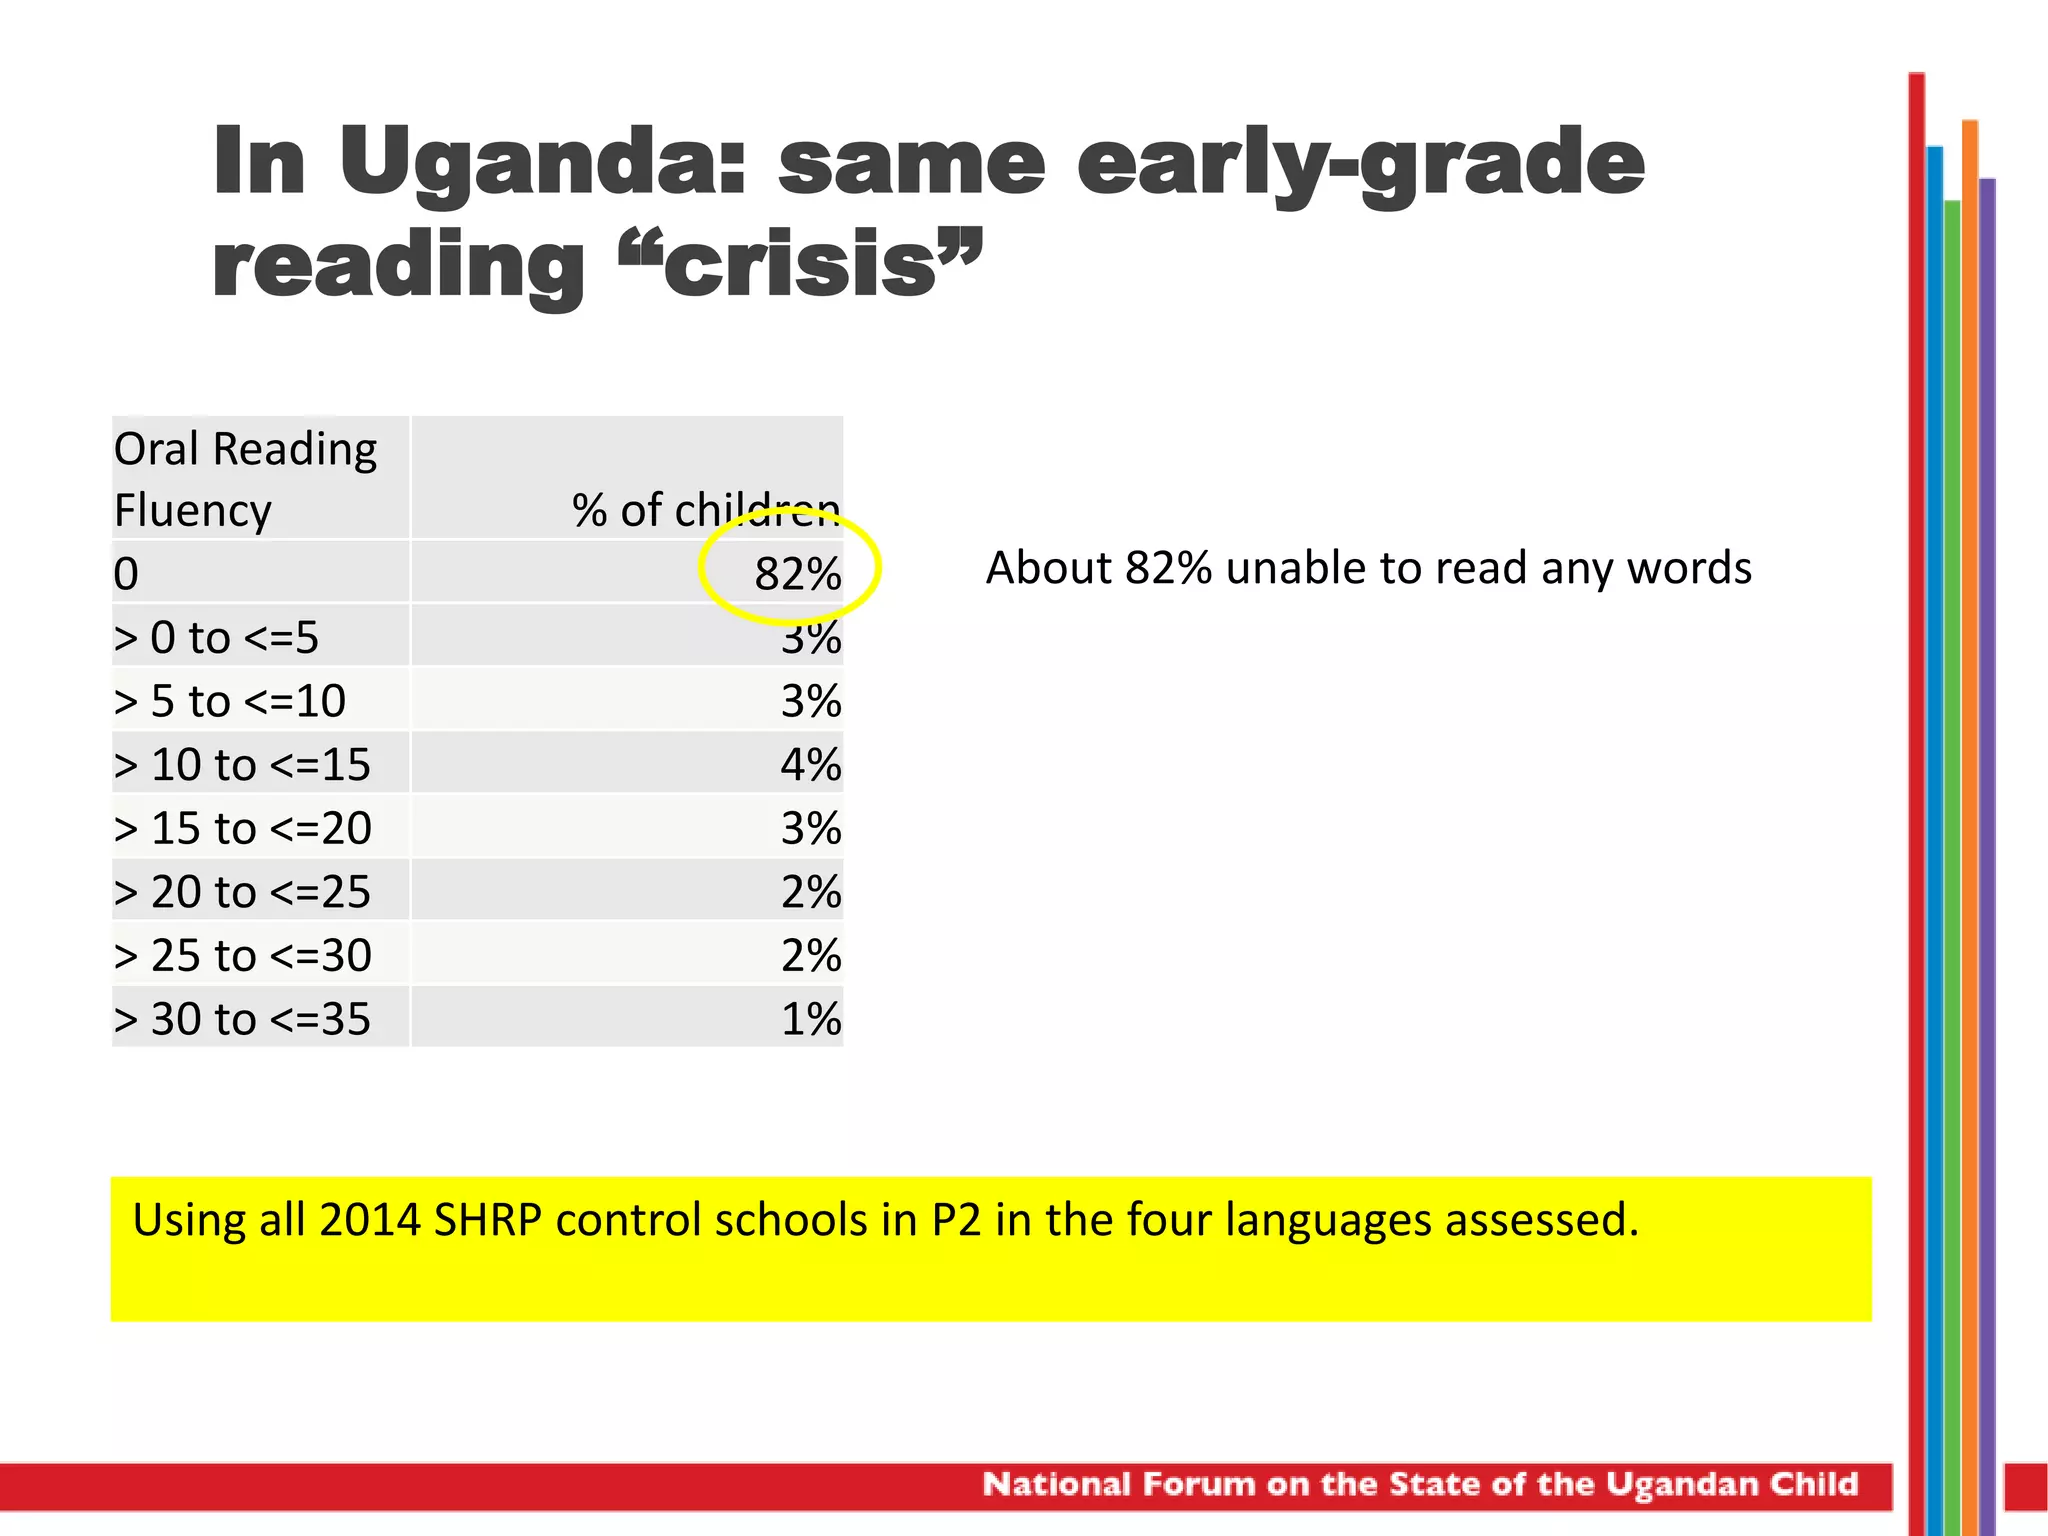
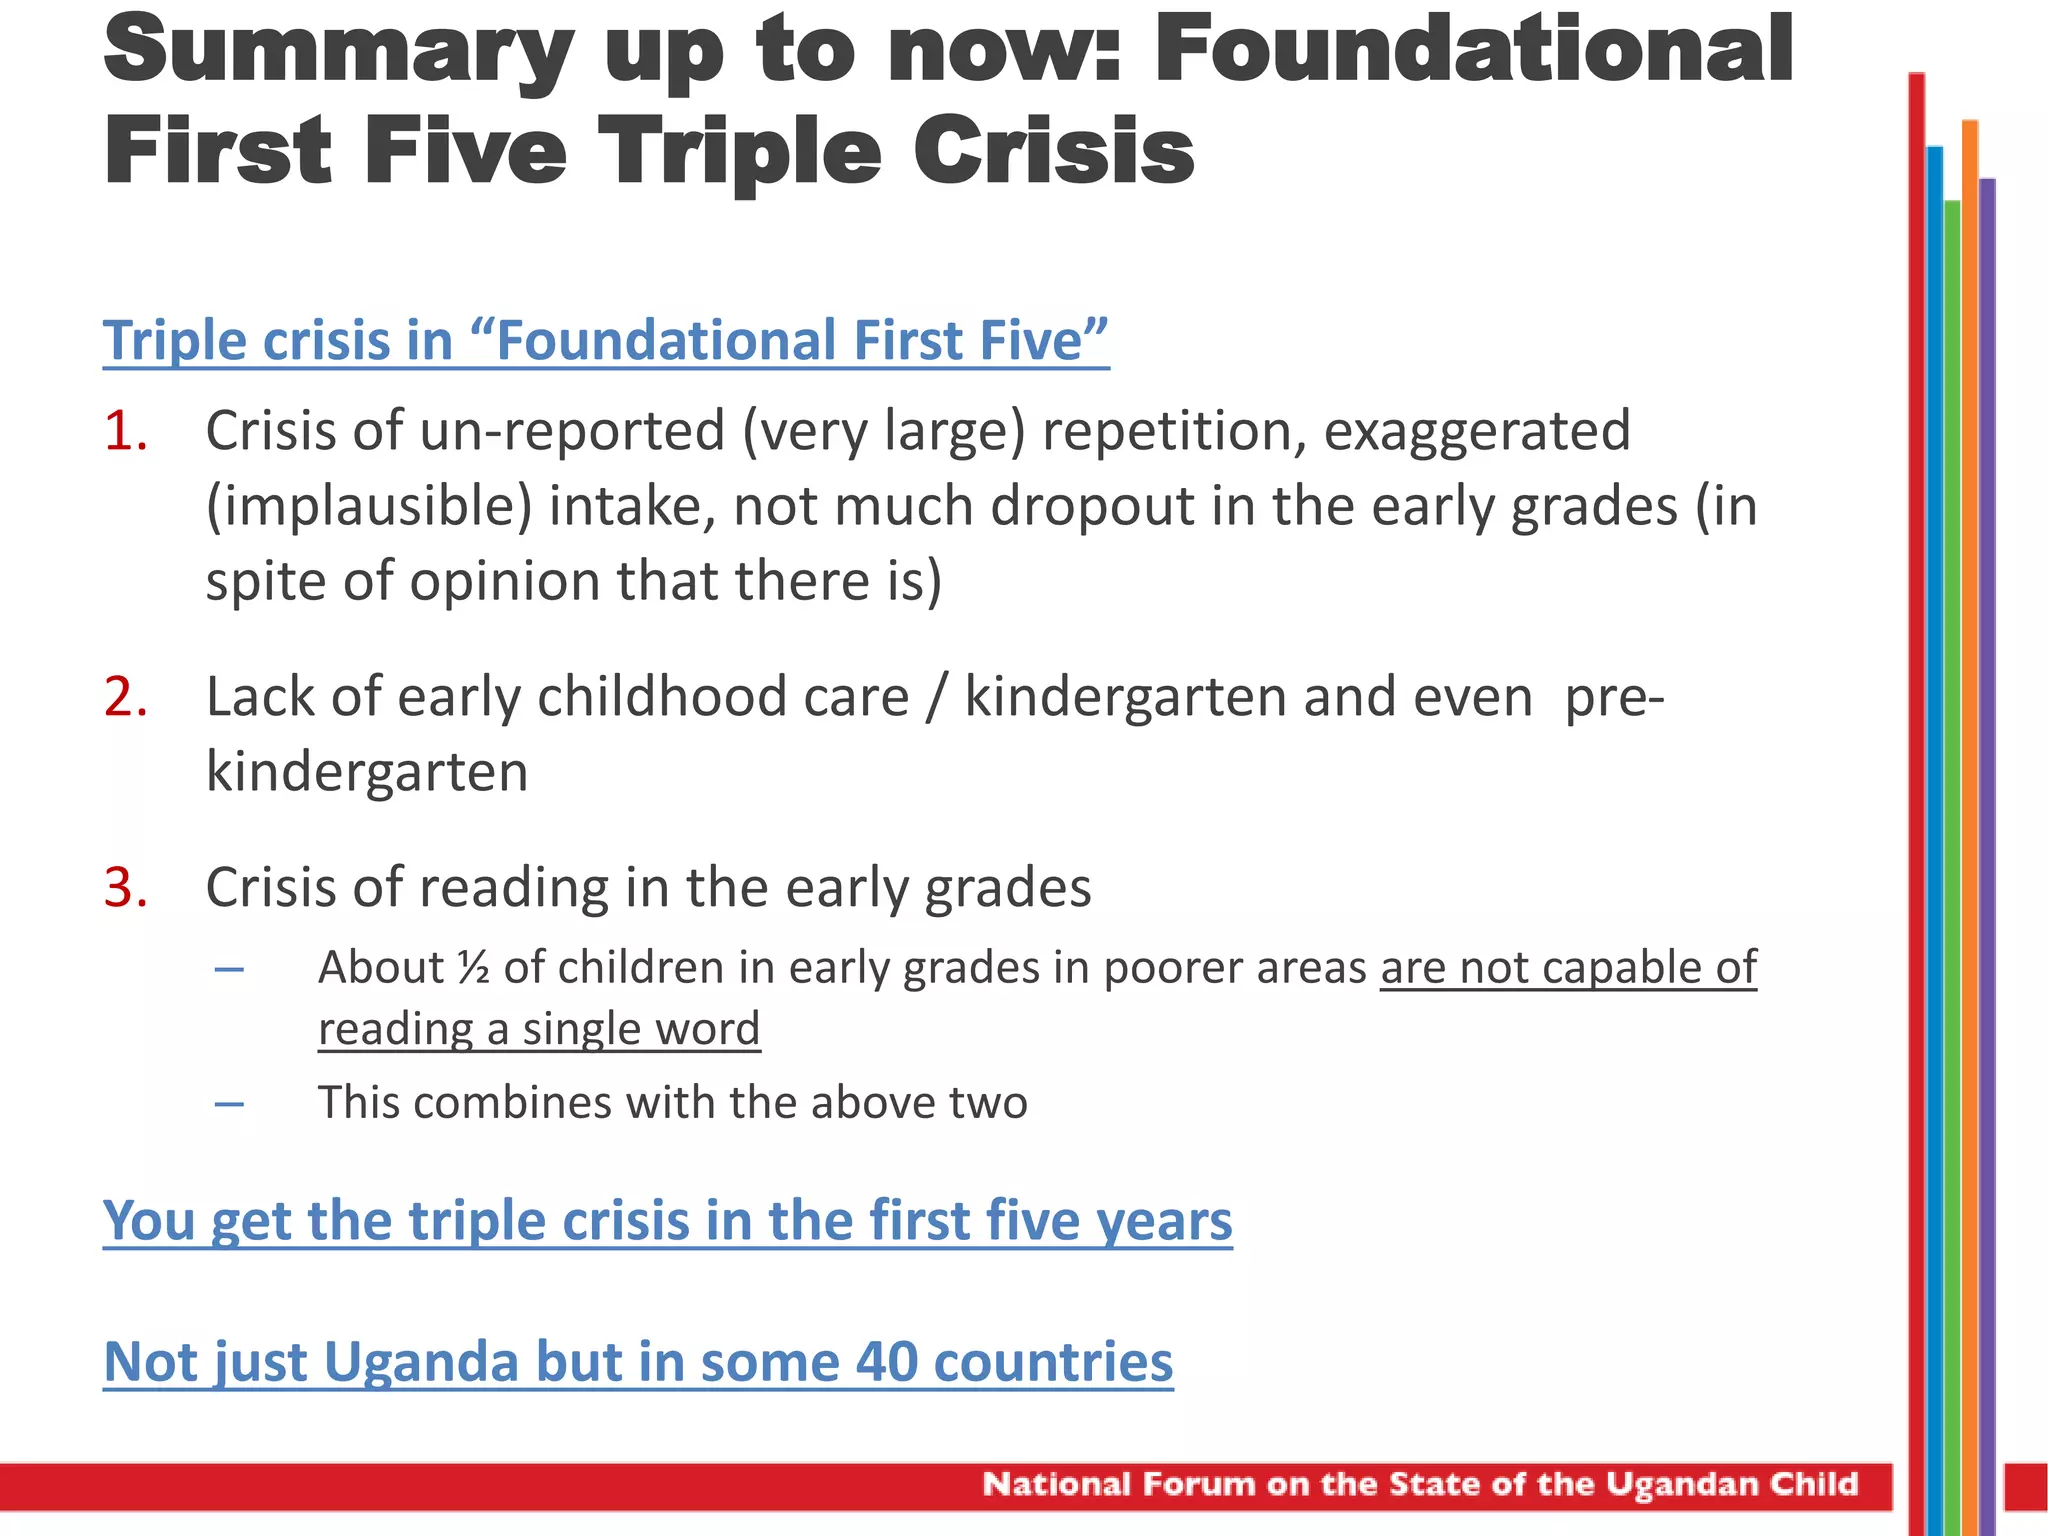
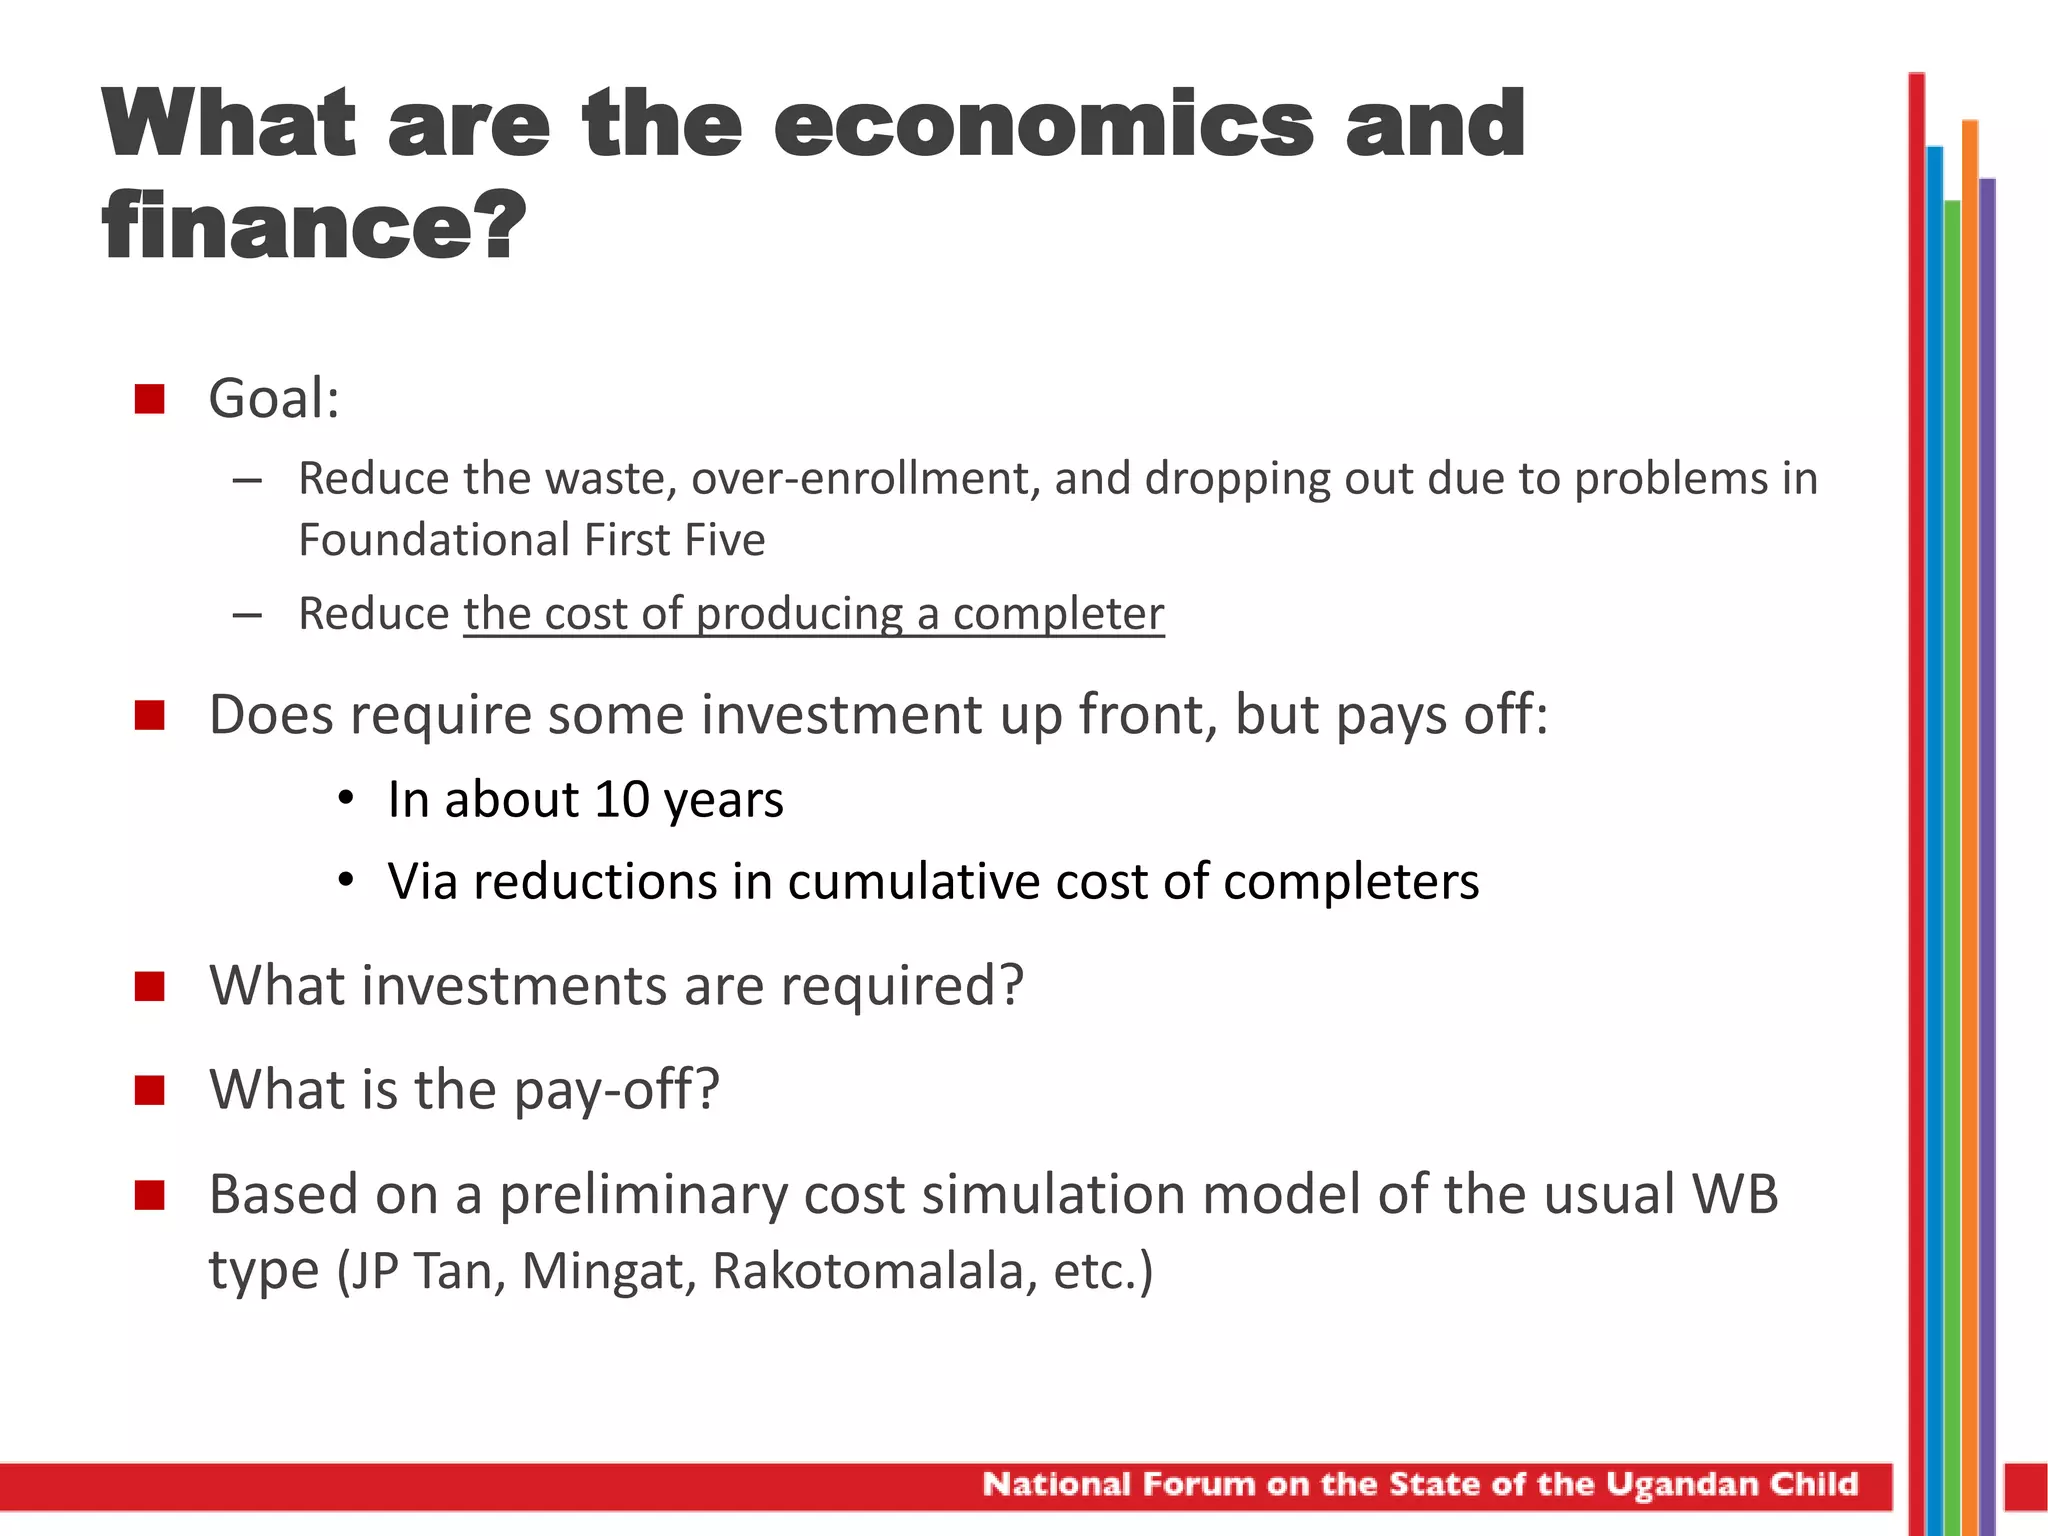
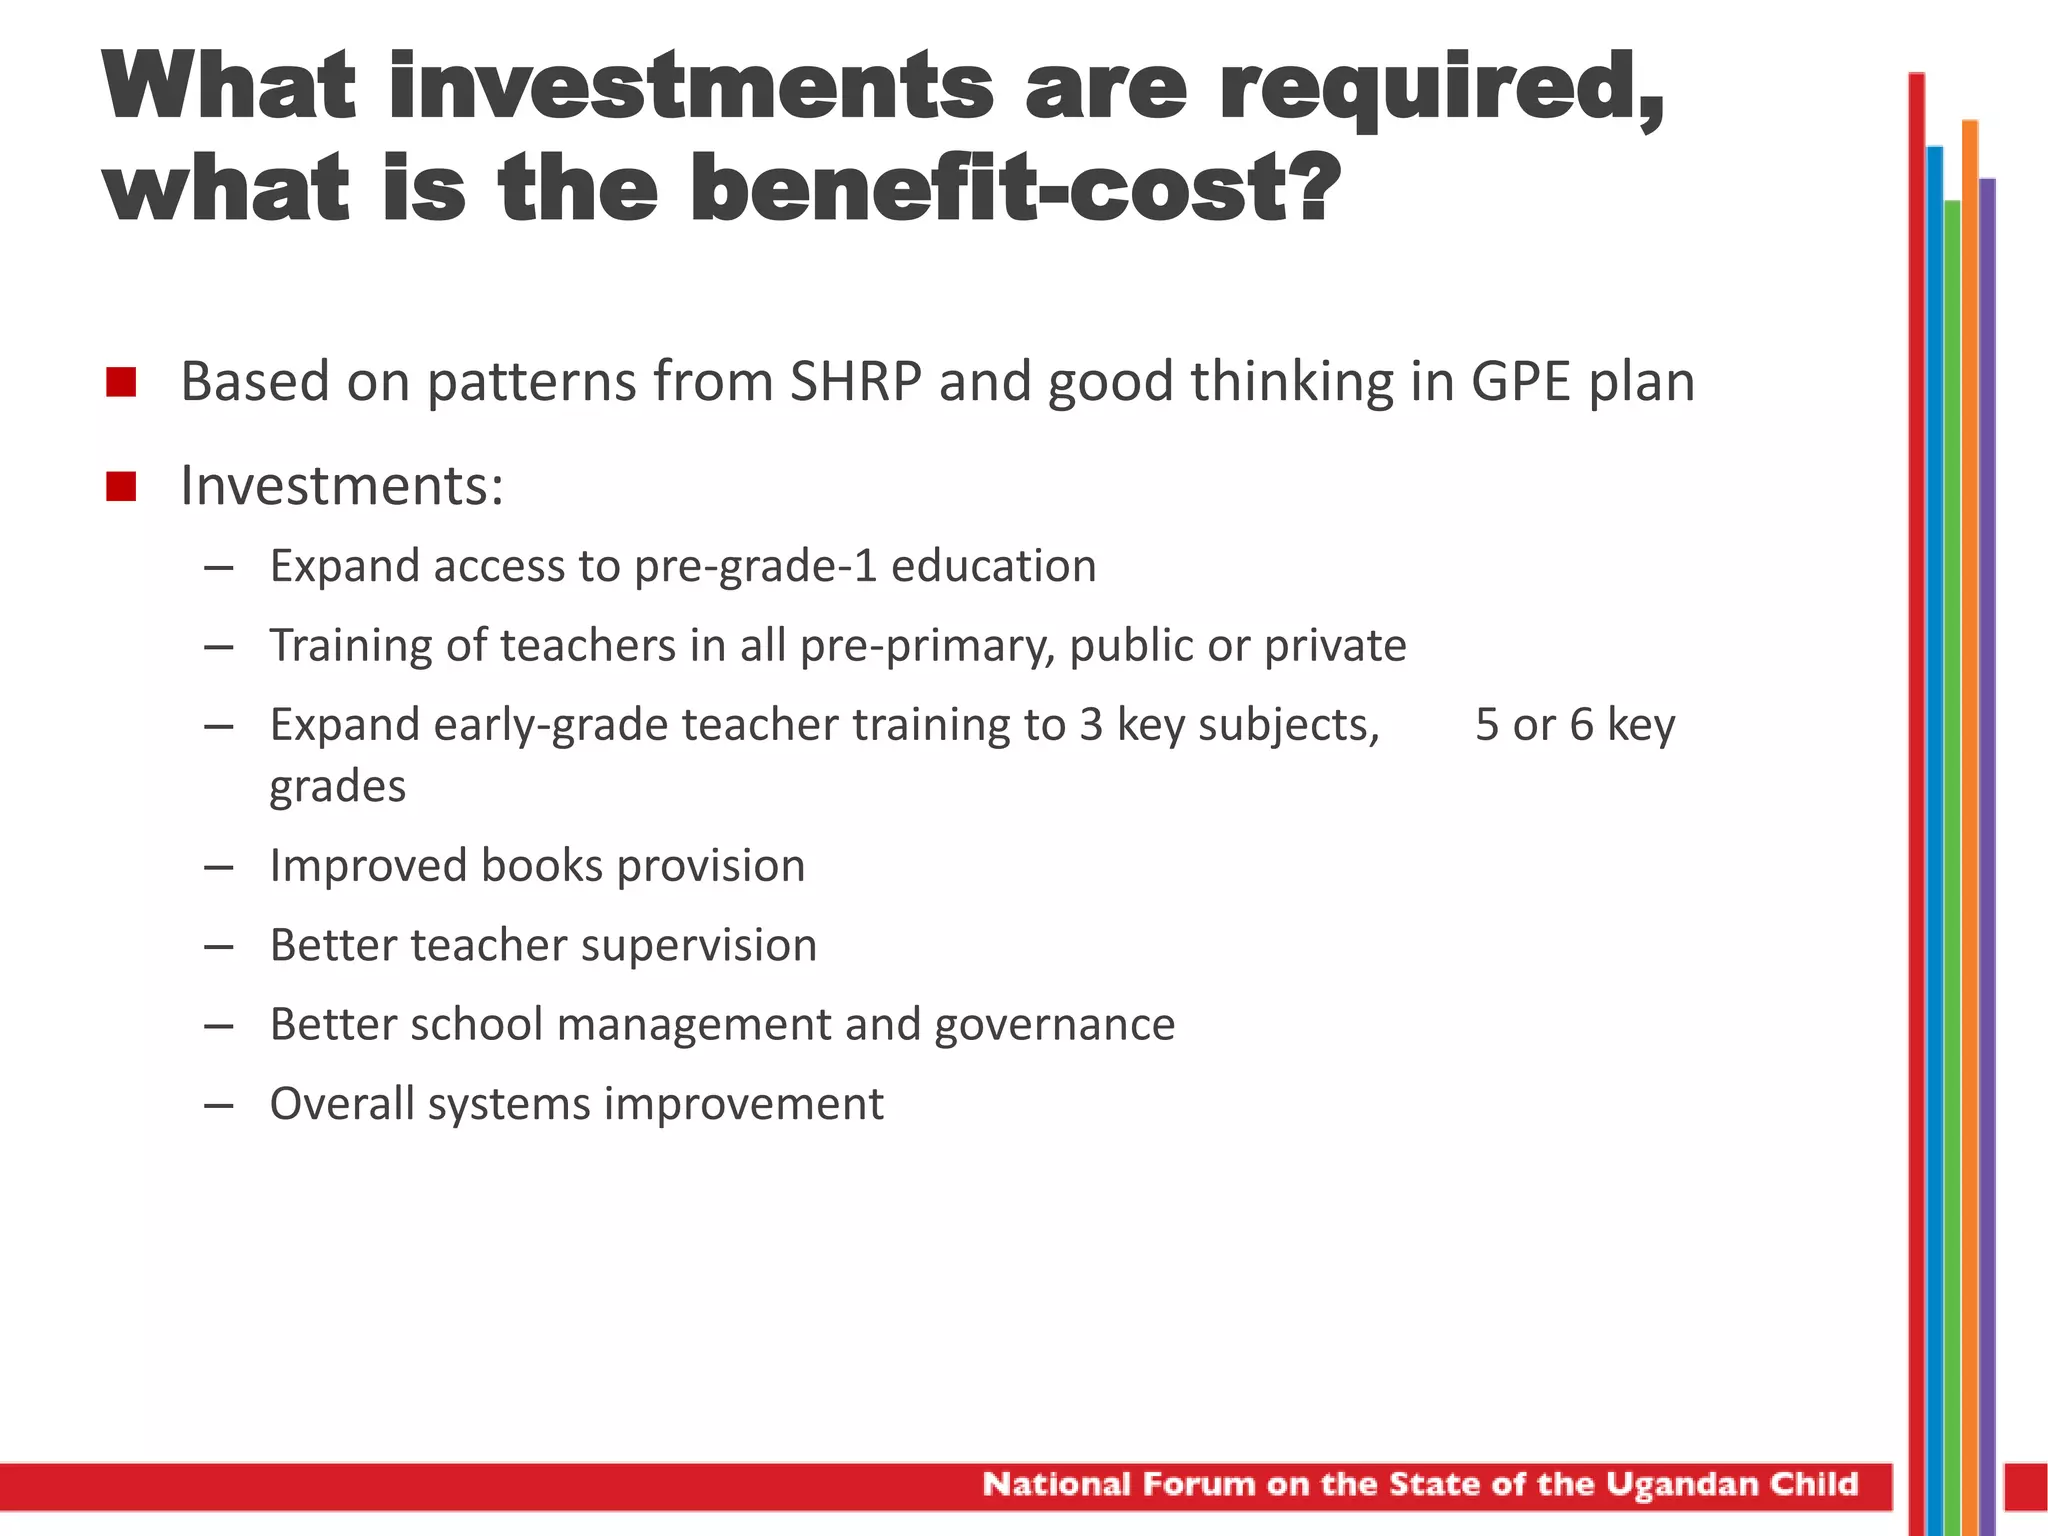
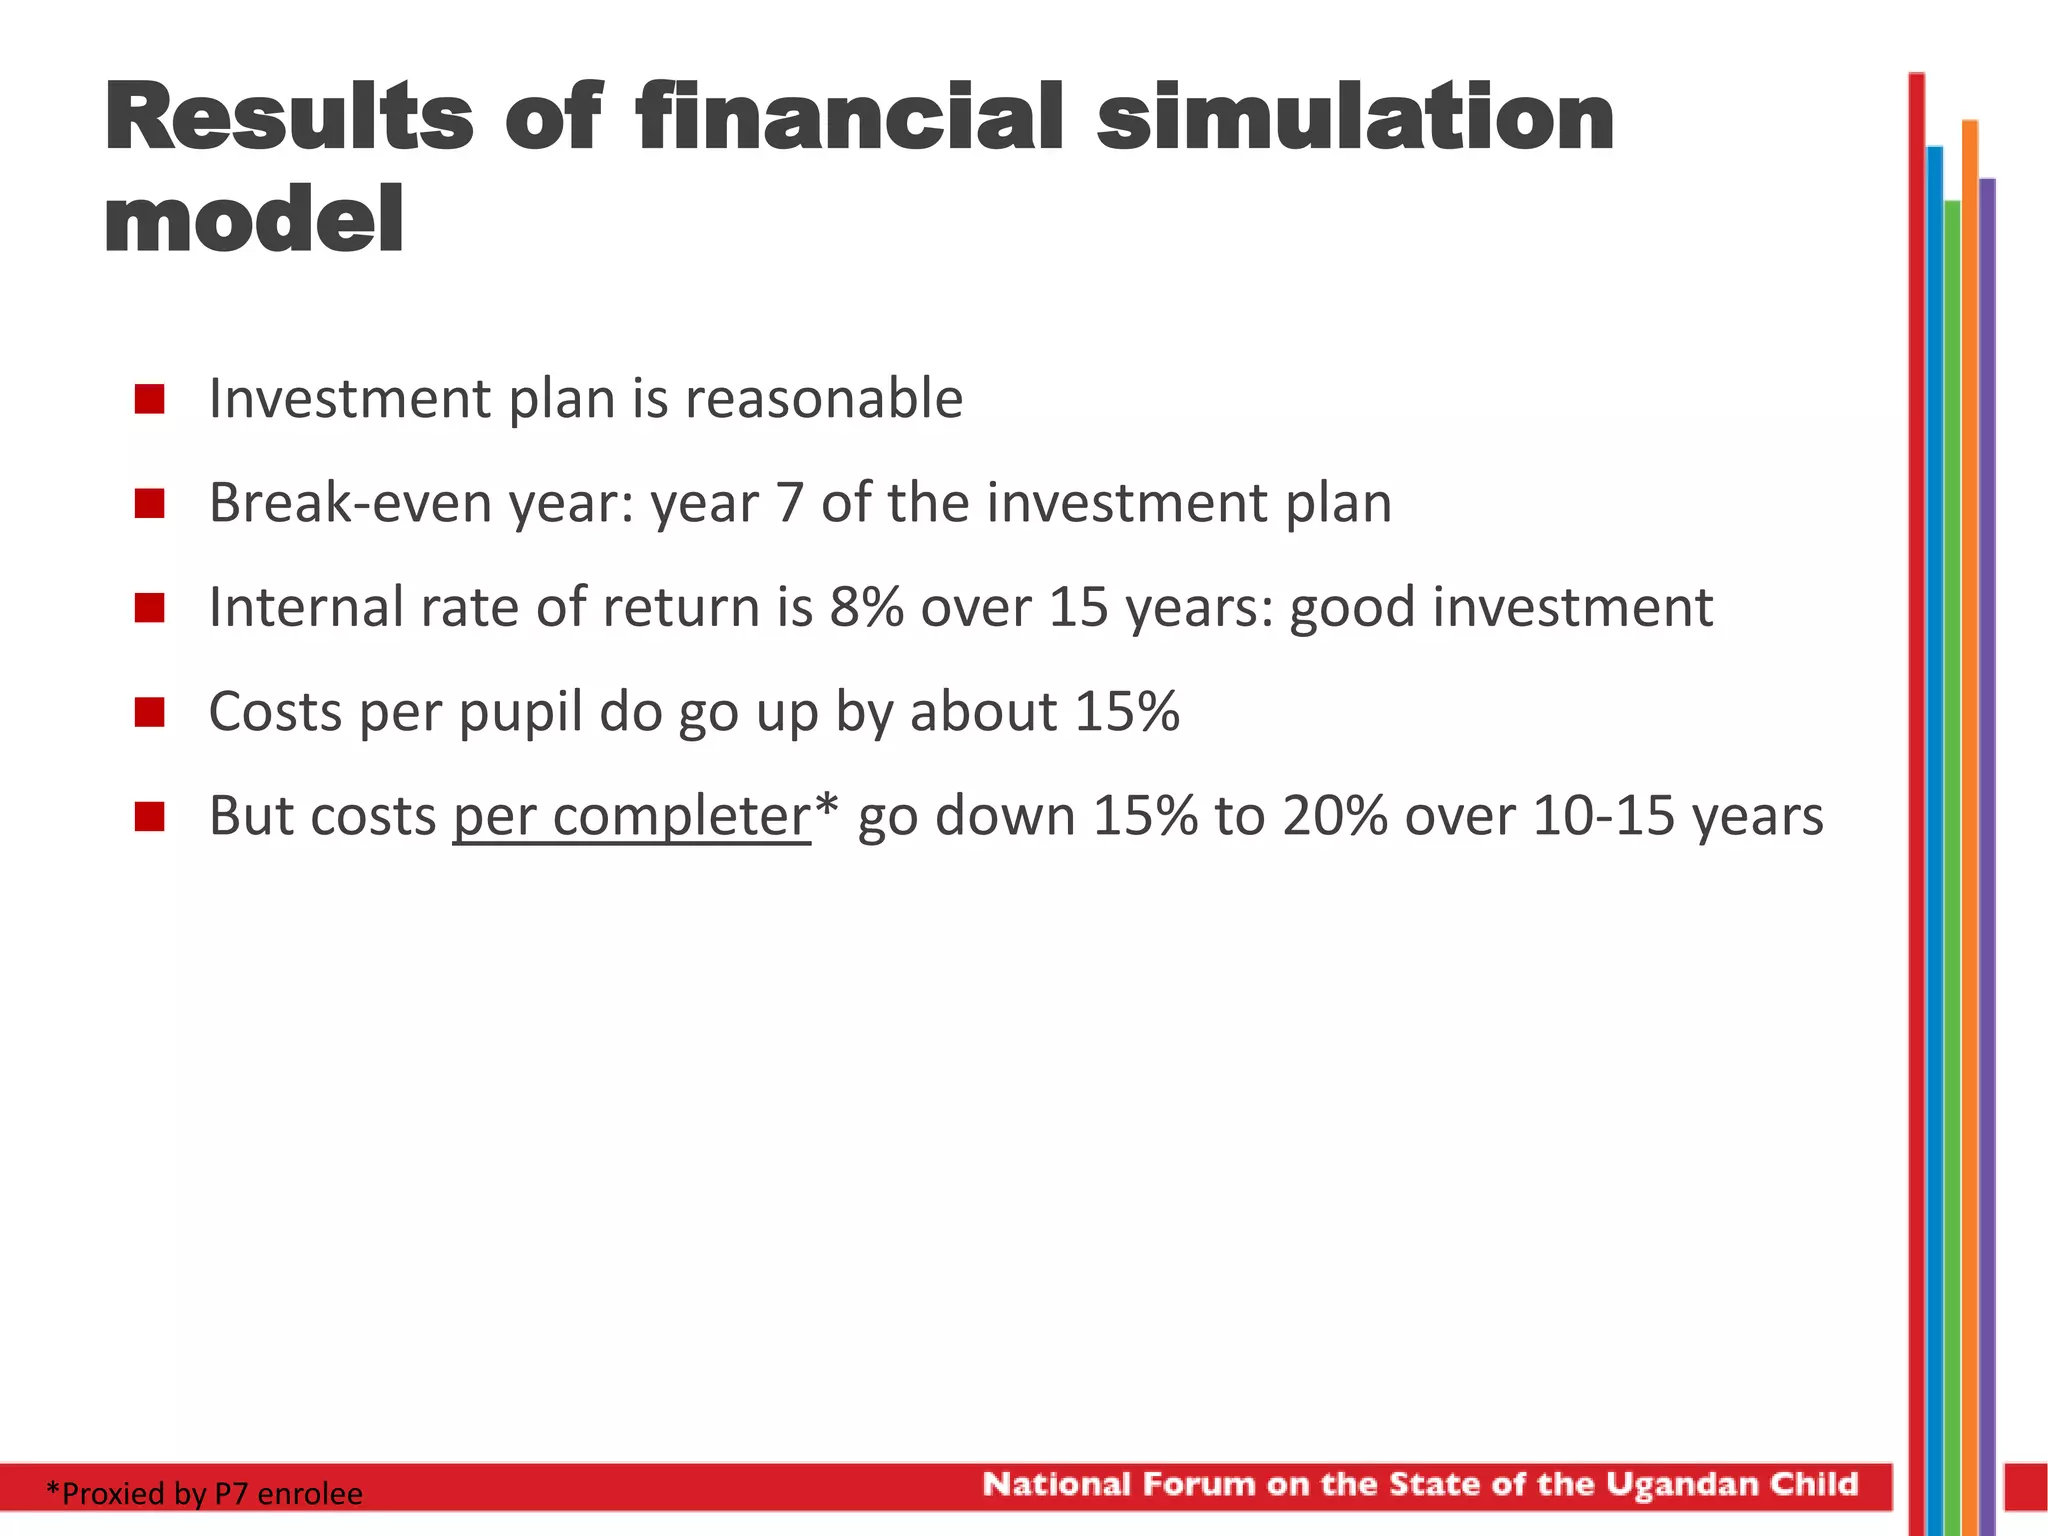
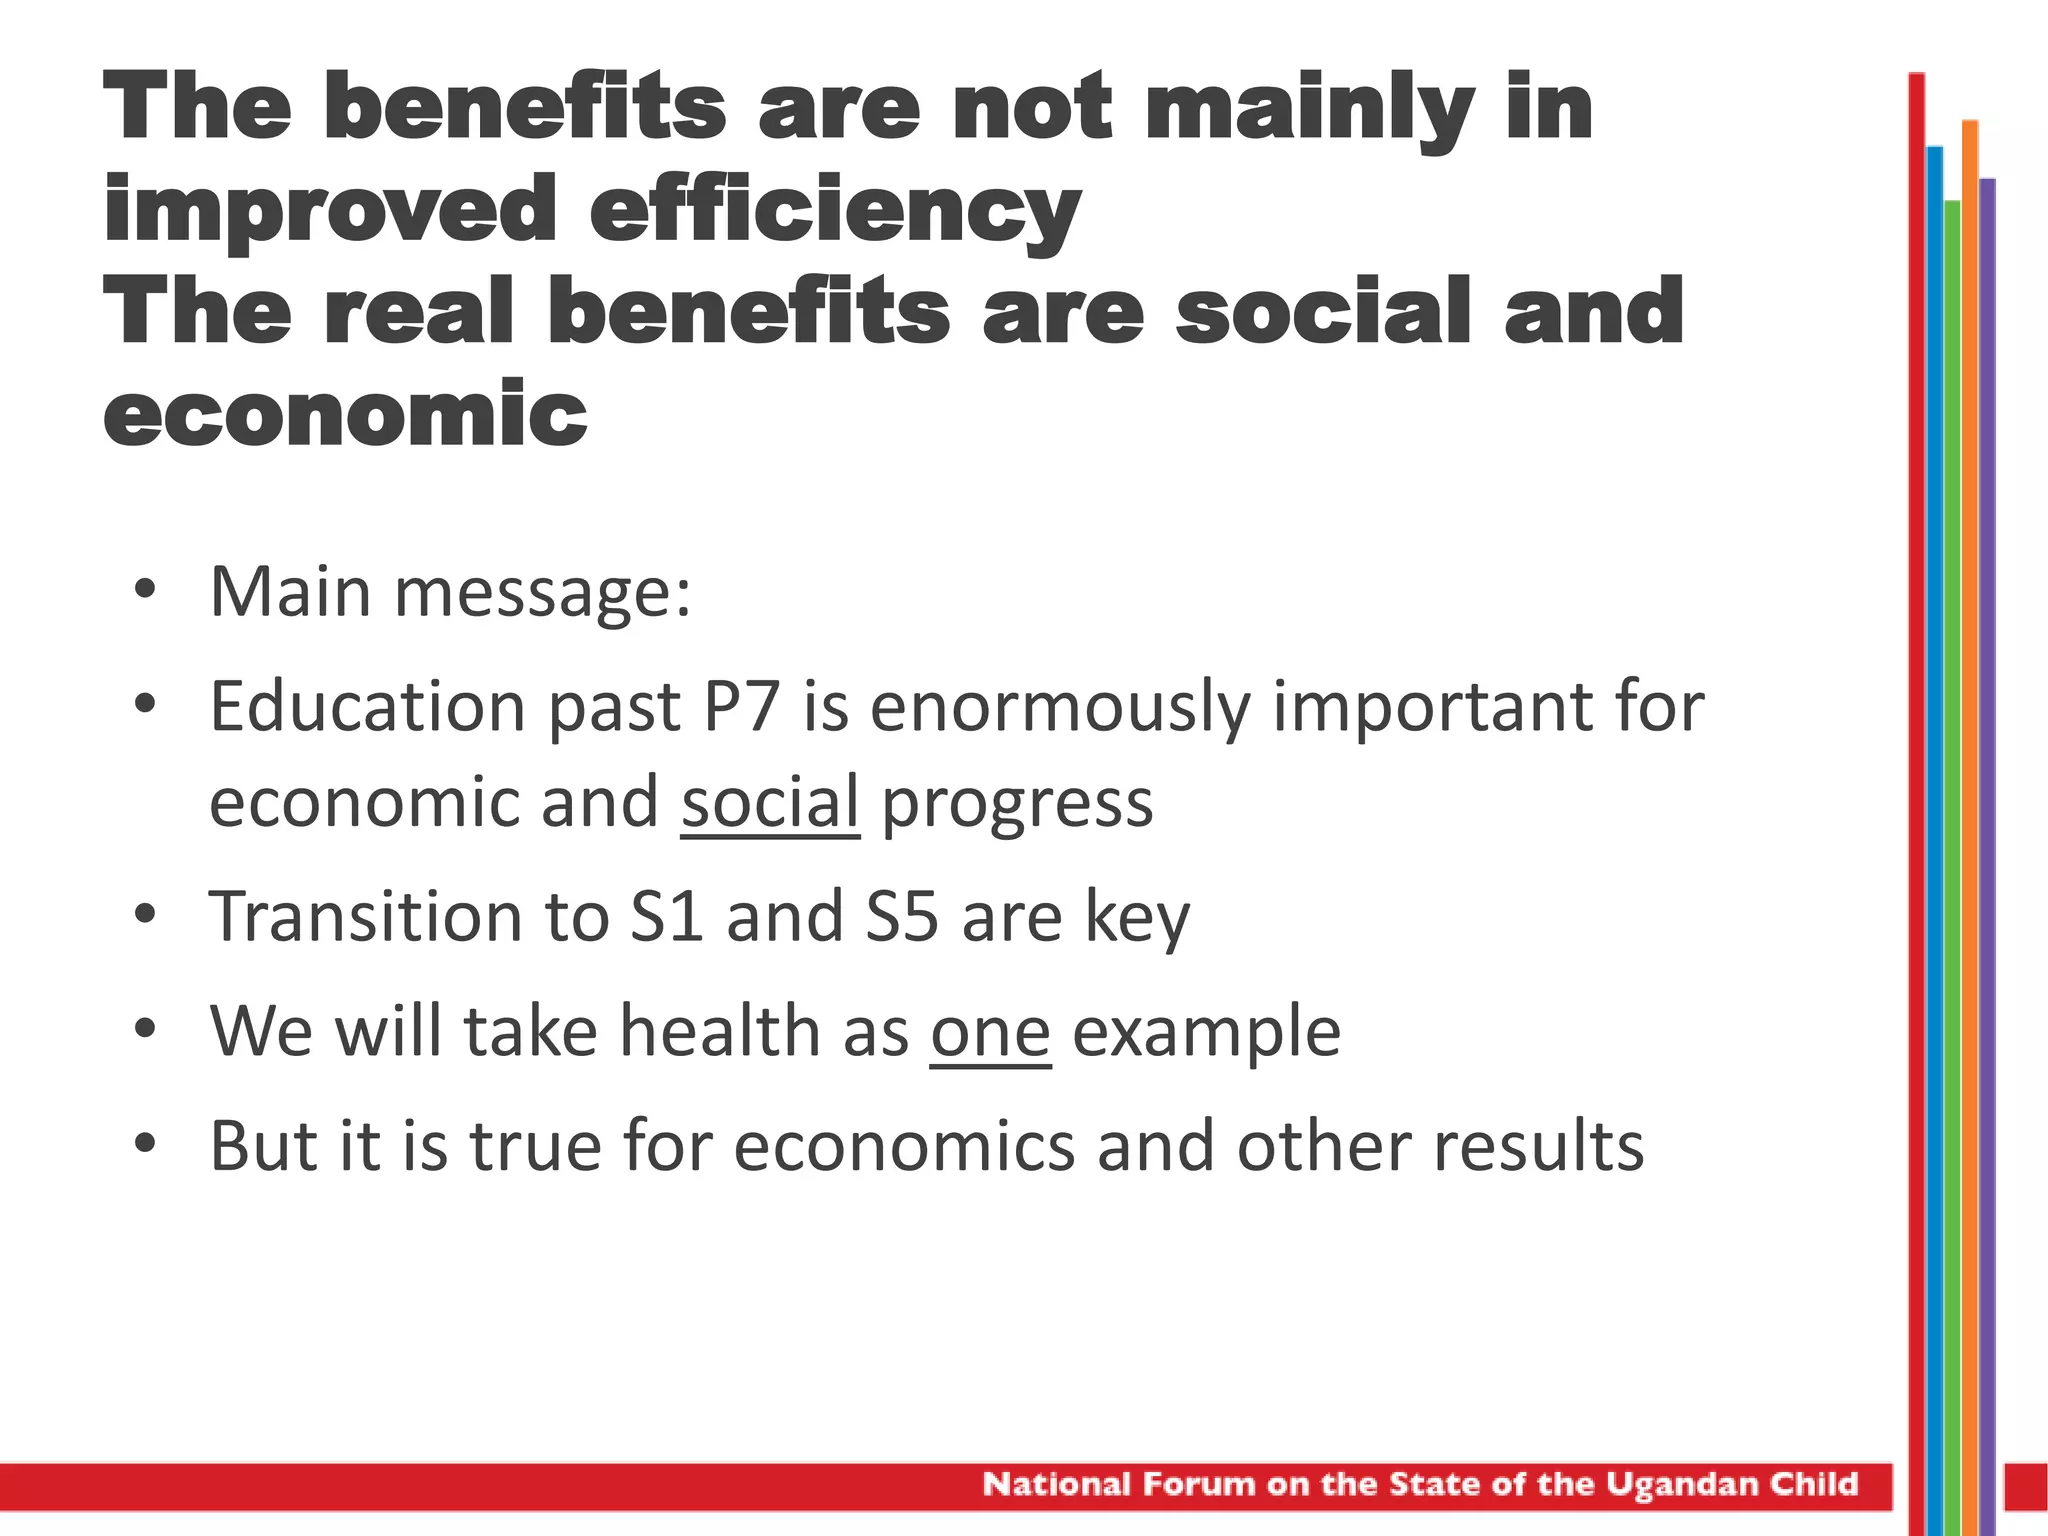
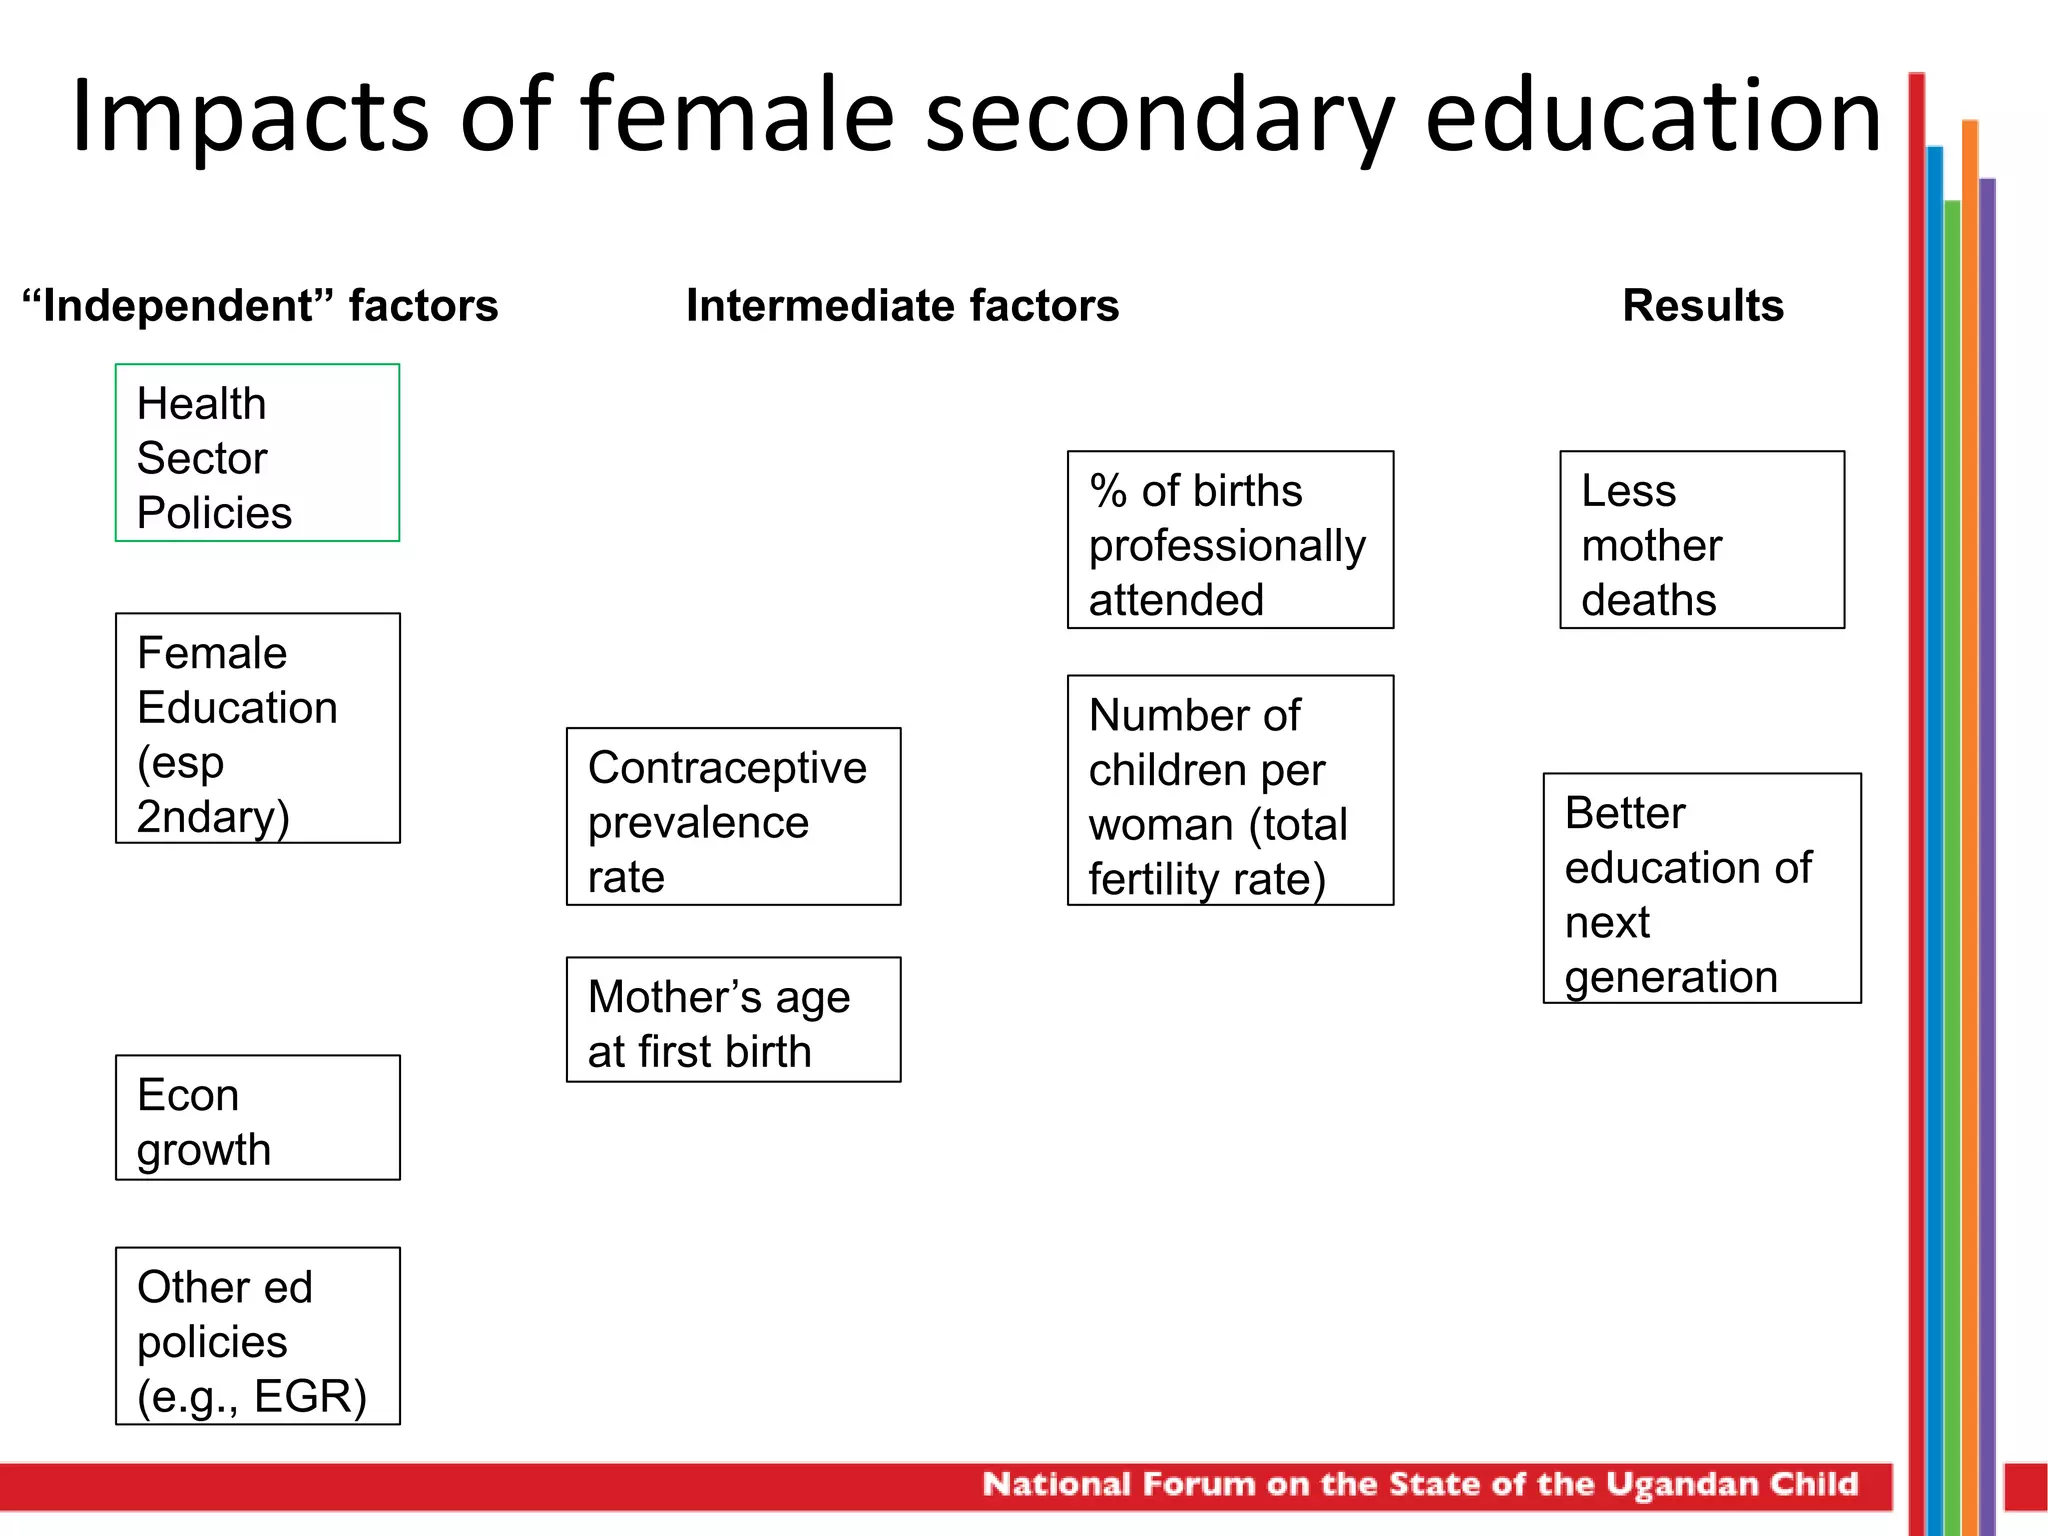
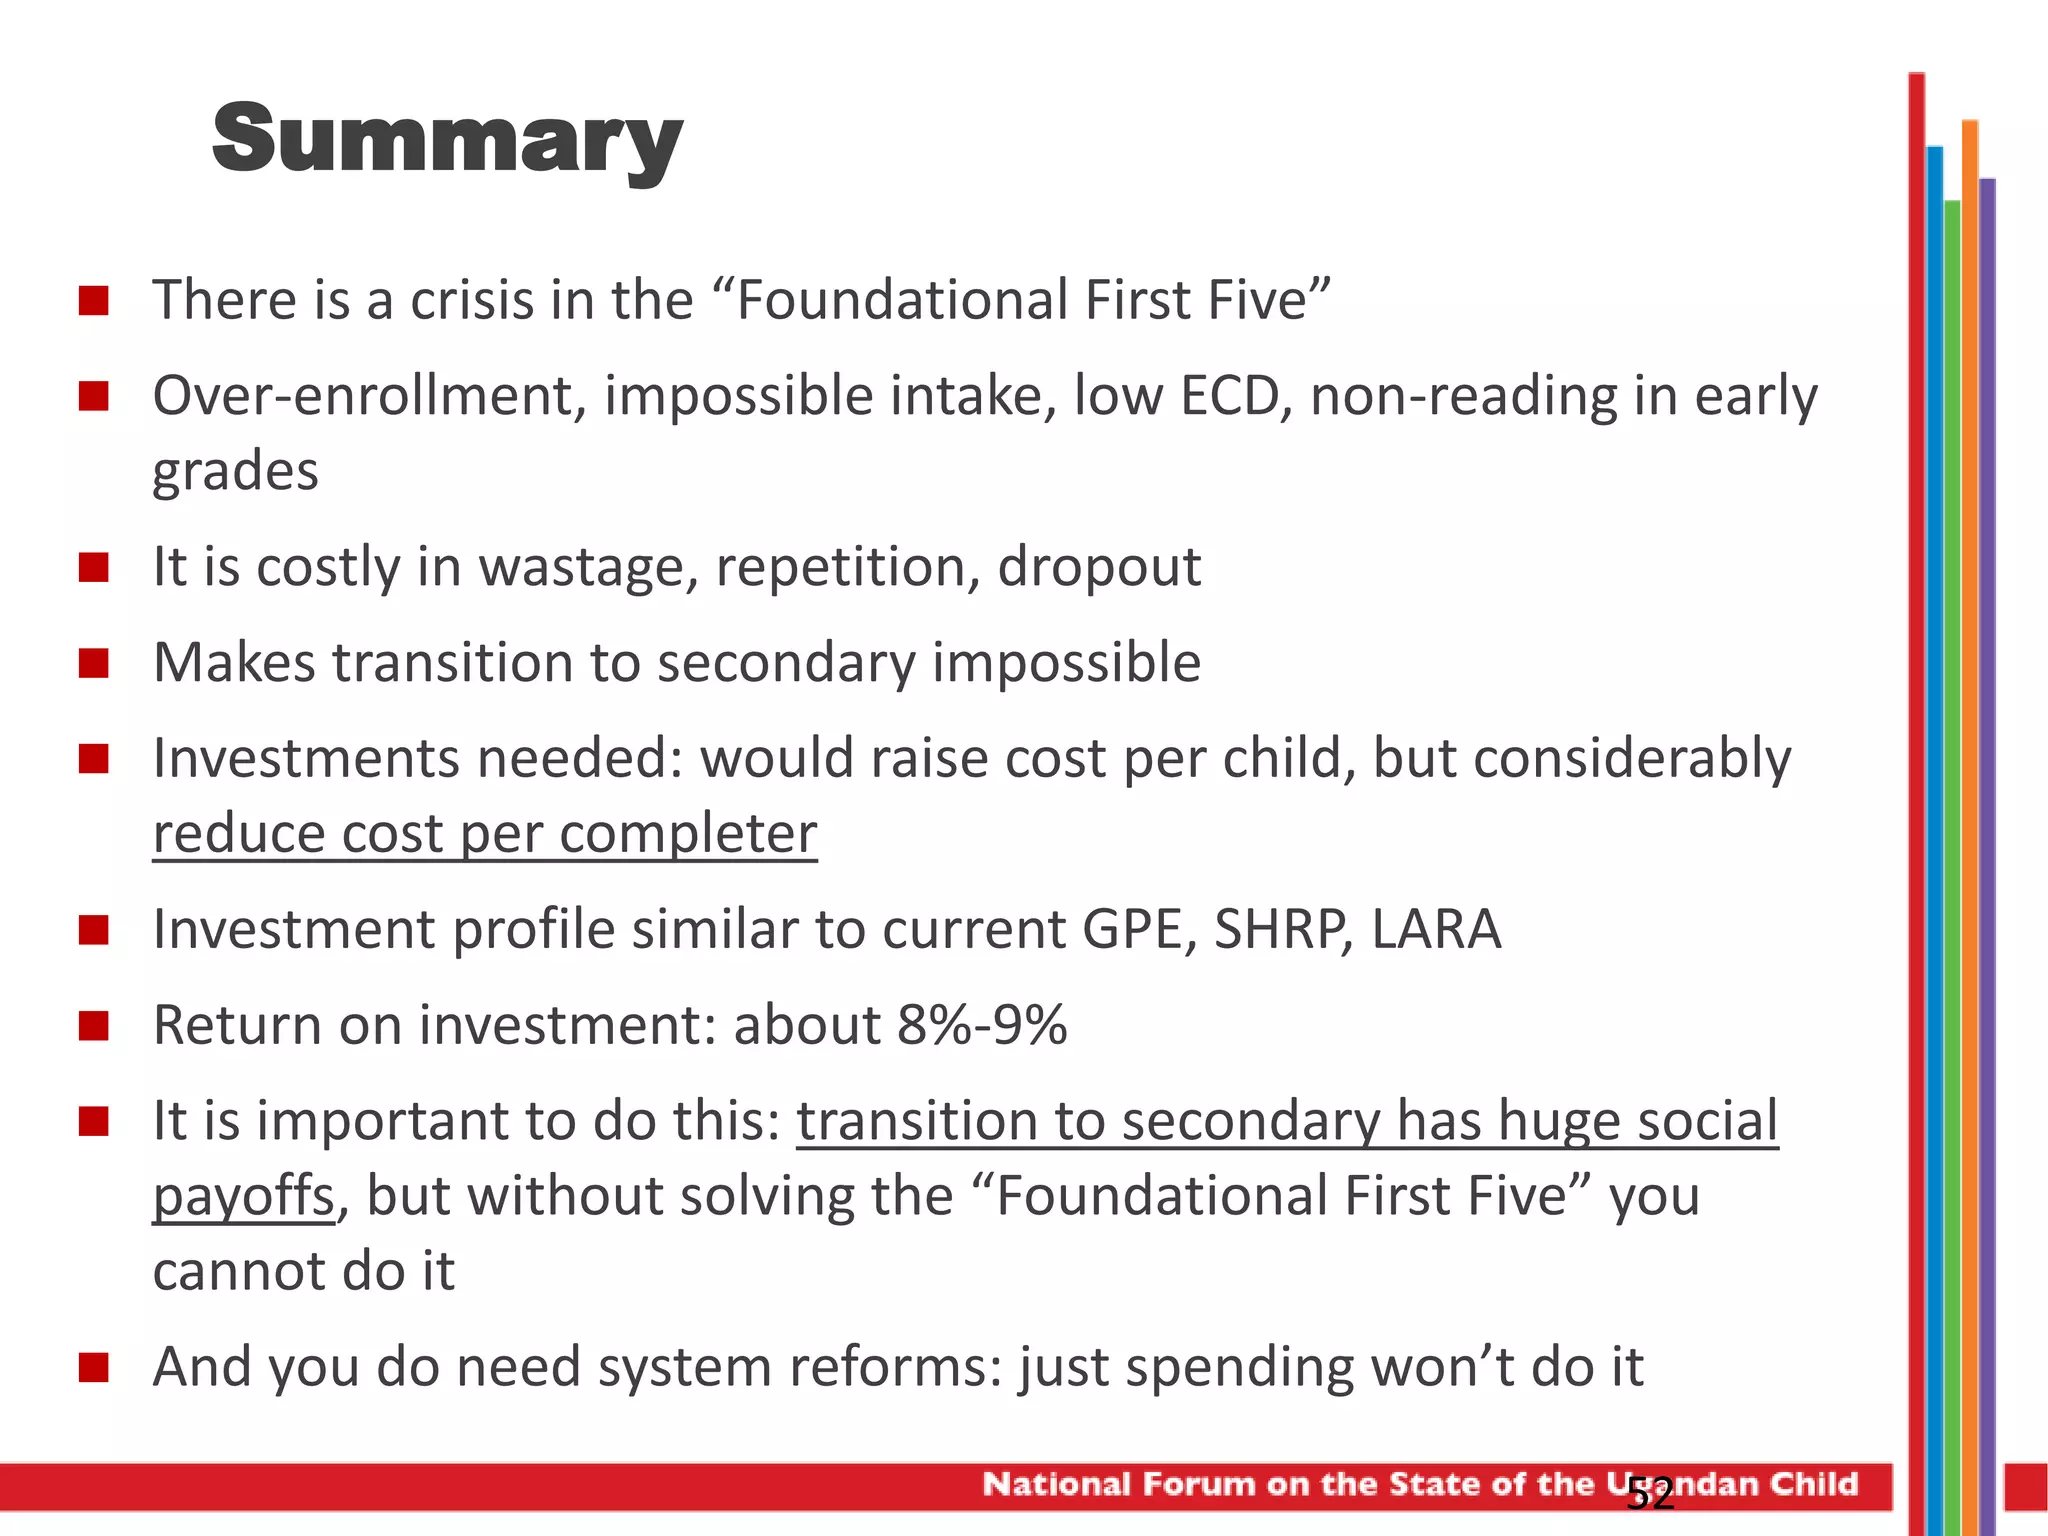
FOUNDATIONAL FIRST FIVE (FFF)
Lessons from the Data,
Cost to the System,
Approaches to Improve
Luis Crouch, RTI
National Forum on the
State of the Ugandan Child
27-28 Oct 2015
Speke Resort, Munyonyo, Uganda
Structure and Summary
1. Present data on low completion of P7
– The problems are not what most people think they are
– The problems have their foundations in a “dysfunctional” situation in the
early years
– Problem is common to many countries, others are solving it
2. Suggestions for fixing the problem
3. Costs and financial benefits of fixing the problem
– Costs per student may go up, but costs per completer of P7 would go
down
4. Spending is not enough: need systemic
improvement
5. A reminder of the social benefits
– Specially of girls’ continuing to lower and upper secondary
– In terms of, mostly, health outcomes
3
Three key messages
1. Improve retention through and beyond P7
– Because of big social and economic impact especially on health outcomes
– But retention has to start with a stronger base of early childhood and early grades
• There is huge wastage now (repetition early, dropping out later)
2. Improving retention requires a package, not just one thing
– Improved teacher skills in “subject matter pedagogy”
– Better/more books
– Better supervision and accountability
– And others: a “package” similar to USAID’s SHRP or GPE
3. The key issue of interest is cost per P7 completer
– Even if cost per enrolled student goes up by 10%-15% or so, cost per completer can
do down by 10%-15%, because you have less waste
4
What do the most basic numbers
tell us?
0 500,000 1,000,000 1,500,000 2,000,000
P1
P2
P3
P4
P4
P6
P7
Enrollment
5
Enrollment Pyramid in any recent year
P5
What do the most basic numbers
tell us?
0 500,000 1,000,000 1,500,000 2,000,000
P1
P2
P3
P4
P4
P6
P7
Enrollment
6
Enrollment Pyramid in any recent year
What is the size of the job?
P5
What do the most basic numbers
tell us?
0 500,000 1,000,000 1,500,000 2,000,000
P1
P2
P3
P4
P4
P6
P7
Enrollment
7
Enrollment Pyramid in any recent year
What is the size of the job?
This big?
P5
But what happens if we overlay
the population?
0 500,000 1,000,000 1,500,000 2,000,000
P1
P2
P3
P4
P4
P6
P7
Popluation of appropriate age Enrollment
8
Enrollment with Population Overlay
What do we notice?
Compare population
and enrollment
carefully.
P5
But what happens if we overlay
the population?
0 500,000 1,000,000 1,500,000 2,000,000
P1
P2
P3
P4
P4
P6
P7
Popluation of appropriate age Enrollment
9
Enrollment with Population Overlay
This small?
What is the size of the
job now?
P5
So what is going on here?
 Why is there so much enrollment compared to population in
grade 1?
 And even in the other grades?
 Could it be under-age and over-age enrollment?
10
0
20
40
60
80
100
120
140
160
180
200
2001 2002 2003 2004 2005 2006 2007 2008 2009 2010
Gross Intake Ratio into Grade 1: One Decade
Let’s look at the intake rate.
Now, what is the “normal intake”?
100%
0
20
40
60
80
100
120
140
160
180
200
2001 2002 2003 2004 2005 2006 2007 2008 2009 2010
Gross Intake Ratio into Grade 1: One Decade
Now, what is the “normal intake”?
100%
0
20
40
60
80
100
120
140
160
180
200
2001 2002 2003 2004 2005 2006 2007 2008 2009 2010
Gross Intake Ratio into Grade 1: One Decade
15
Now suppose you start out with half the kids out
of school in 2000…
Now, what is the “normal intake”?
100%
0
20
40
60
80
100
120
140
160
180
200
2001 2002 2003 2004 2005 2006 2007 2008 2009 2010
Gross Intake Ratio into Grade 1: One Decade
… Even with 50% OOS in 2000, in just a few years the
over-age due to that would have been taken in, the top
triangle compensating for the bottom one, because the
system was over-intaking by 60% to 80%.
And then you have all that rectangle to spare: impossible.
Now, what is the “normal intake”?
100%
Early bulge: Uganda as compared to
40 other countries
0.25
0.5
0.75
1
1.25
1.5
1.75
2
2.25
2.5
2.75
Enrol1/Pop7 Enrol2/Pop8 Enrol3/Pop9 Enrol4/Pop10 Enrol5/Pop11 Enrol6/Pop12
EnrollmentGradeforAge
Age for Grade and the Early Grades Bulge
Uganda
Median, other
countries with
foundational
problems
Study the problem by looking at
4 key ratios
 Ratio of P1 enrollment to Pop Age 7
 Ratio of P2 enrollment to P1 enrollment
 Gross intake ratio into P1
 Gross Enrollment Ratio in pre-primary
“Ideal values”, real values in other
countries, Uganda
“Ideal” values
Real, other
countries with
Foundational First
Five problems
Uganda (over
same time
period)
P1/Age 7 About 1.0 1.50 1.60
P2/P1 About 1.0 0.82 0.70
GIR into P1 About 1.0 higher
only in post
conflict or after
huge reforms
1.27 1.50
GER in pre-primary At least 1.0 0.24 0.13
Conclusions thus far
 The bulge in over-enrollment in early grades cannot be due to
under-age or over-age entry or intake
 It may likely be partially due to some exaggeration
 But the main pattern is probably rather large-scale, under-
reported repetition: “in school over-aging”
 A major reason for this: Grade 1 is widely available and free
 So, parents “use” Grade 1 as a form of ECD
 It is expected repetition, aging-in-place
 But a very inefficient form of ECD
Another clue to FFF problems: crisis in
early grade reading
Testing in some 53 language/country combinations: about 50% of kids unable
to read any words in the language of instruction
• This
• is
• how
• most
• 3rd-grade kids
• in
• Uganda
• read, at best
•
• This
• is
• how
• most
• 3rd-grade kids
• in
• rich countries (OECD)
• read
•
What it feels like to be a non-reader…
In Uganda: same early-grade
reading “crisis”
Oral Reading
Fluency % of children
0 82%
> 0 to <=5 3%
> 5 to <=10 3%
> 10 to <=15 4%
> 15 to <=20 3%
> 20 to <=25 2%
> 25 to <=30 2%
> 30 to <=35 1%
Using all 2014 SHRP control schools in P2 in the four languages assessed.
About 82% unable to read any words
Summary up to now: Foundational
First Five Triple Crisis
Triple crisis in “Foundational First Five”
1. Crisis of un-reported (very large) repetition, exaggerated
(implausible) intake, not much dropout in the early grades (in
spite of opinion that there is)
2. Lack of early childhood care / kindergarten and even pre-
kindergarten
3. Crisis of reading in the early grades
– About ½ of children in early grades in poorer areas are not capable of
reading a single word
– This combines with the above two
You get the triple crisis in the first five years
Not just Uganda but in some 40 countries
What are the economics and
finance?
 Goal:
– Reduce the waste, over-enrollment, and dropping out due to problems in
Foundational First Five
– Reduce the cost of producing a completer
 Does require some investment up front, but pays off:
• In about 10 years
• Via reductions in cumulative cost of completers
 What investments are required?
 What is the pay-off?
 Based on a preliminary cost simulation model of the usual WB
type (JP Tan, Mingat, Rakotomalala, etc.)
 Based on patterns from SHRP and good thinking in GPE plan
 Investments:
– Expand access to pre-grade-1 education
– Training of teachers in all pre-primary, public or private
– Expand early-grade teacher training to 3 key subjects, 5 or 6 key
grades
– Improved books provision
– Better teacher supervision
– Better school management and governance
– Overall systems improvement
What investments are required,
what is the benefit-cost?
Results of financial simulation
model
 Investment plan is reasonable
 Break-even year: year 7 of the investment plan
 Internal rate of return is 8% over 15 years: good investment
 Costs per pupil do go up by about 15%
 But costs per completer* go down 15% to 20% over 10-15 years
*Proxied by P7 enrolee
But remember…
Using a budget and expenditure to improve things is like pushing
on a string…
You need to pull on a string…
If you have
• accountability systems,
• data monitoring,
• rewards and sanctions,
• spreading of lessons learned:
• systemic reforms.
Then the budget can pull.
The benefits are not mainly in
improved efficiency
The real benefits are social and
economic
• Main message:
• Education past P7 is enormously important for
economic and social progress
• Transition to S1 and S5 are key
• We will take health as one example
• But it is true for economics and other results
Health
Sector
Policies
Female
Education
(esp
2ndary)
Econ
growth
Other ed
policies
(e.g., EGR)
Contraceptive
prevalence
rate
Mother’s age
at first birth
% of births
professionally
attended
Number of
children per
woman (total
fertility rate)
Less
mother
deaths
Better
education of
next
generation
“Independent” factors Intermediate factors Results
Impacts of female secondary education
Health
Sector
Policies
Female
Education
(esp
2ndary)
Econ
growth
Other ed
policies
(e.g., EGR)
Contraceptive
prevalence
rate
Mother’s age
at first birth
% of births
professionally
attended
Number of
children per
woman (total
fertility rate)
Less
mother
deaths
Better
education of
next
generation
1 2
3
7
4
5
8
9
“Independent” factors Intermediate factors Results
6
Impacts of female secondary education
That’s a theoretical model…
What do the real data look like
for Uganda?
What do the data for Uganda look like?
0%
10%
20%
30%
40%
50%
60%
0 1 2 3 4 5 6 7 8 9 10 11 12
%ofTeenagers15-19yearswhohavehadachildorare
pregnant
Grades of Education Completed by Teenage Mother
Teenage Motherhood: % Teenagers that are mothers,
by grades of education
R² = 0.8101
0%
10%
20%
30%
40%
50%
60%
0 1 2 3 4 5 6 7 8 9 10 11 12
%ofTeenagers15-19yearswhohavehadachildorare
pregnant
Grades of Education Completed by Teenage Mother
Teenage Motherhood: % Teenagers that are mothers,
by grades of education
What do the data for Uganda look like?
0%
10%
20%
30%
40%
50%
60%
0 1 2 3 4 5 6 7 8 9 10 11 12
PercentageContraceptiveUse
Grades of Education of Mother
Contraceptive Use among married women or those with live-in
partners, by grades of education
Using any FP method
Using Modern FP Method
What do the data for Uganda look like?
0%
10%
20%
30%
40%
50%
60%
70%
80%
90%
100%
0 1 2 3 4 5 6 7 8 9 10 11 12
%ofdeliveriesassistedbyaprofessionalhealthworker
Grades of Education of Mother
Professional assistance during delivery, by mother’s grades of
education
What do the data for Uganda look like?
.0
1.0
2.0
3.0
4.0
5.0
6.0
7.0
8.0
9.0
0 1 2 3 4 5 6 7 8 9 10 11 12
Numberofchildrenborn
Grades of Education of Mother
Total number of children ever born among women 40 - 49
years, by grades of education
What do the data for Uganda look like?
Summary
 There is a crisis in the “Foundational First Five”
 Over-enrollment, impossible intake, low ECD, non-reading in early
grades
 It is costly in wastage, repetition, dropout
 Makes transition to secondary impossible
 Investments needed: would raise cost per child, but considerably
reduce cost per completer
 Investment profile similar to current GPE, SHRP, LARA
 Return on investment: about 8%-9%
 It is important to do this: transition to secondary has huge social
payoffs, but without solving the “Foundational First Five” you
cannot do it
 And you do need system reforms: just spending won’t do it
52
Technical Presentation: Systems Finance

Technical Presentation: Systems Finance

  • 1.
  • 2.
    Lessons from theData, Cost to the System, Approaches to Improve Luis Crouch, RTI National Forum on the State of the Ugandan Child 27-28 Oct 2015 Speke Resort, Munyonyo, Uganda
  • 3.
    Structure and Summary 1.Present data on low completion of P7 – The problems are not what most people think they are – The problems have their foundations in a “dysfunctional” situation in the early years – Problem is common to many countries, others are solving it 2. Suggestions for fixing the problem 3. Costs and financial benefits of fixing the problem – Costs per student may go up, but costs per completer of P7 would go down 4. Spending is not enough: need systemic improvement 5. A reminder of the social benefits – Specially of girls’ continuing to lower and upper secondary – In terms of, mostly, health outcomes 3
  • 4.
    Three key messages 1.Improve retention through and beyond P7 – Because of big social and economic impact especially on health outcomes – But retention has to start with a stronger base of early childhood and early grades • There is huge wastage now (repetition early, dropping out later) 2. Improving retention requires a package, not just one thing – Improved teacher skills in “subject matter pedagogy” – Better/more books – Better supervision and accountability – And others: a “package” similar to USAID’s SHRP or GPE 3. The key issue of interest is cost per P7 completer – Even if cost per enrolled student goes up by 10%-15% or so, cost per completer can do down by 10%-15%, because you have less waste 4
  • 5.
    What do themost basic numbers tell us? 0 500,000 1,000,000 1,500,000 2,000,000 P1 P2 P3 P4 P4 P6 P7 Enrollment 5 Enrollment Pyramid in any recent year P5
  • 6.
    What do themost basic numbers tell us? 0 500,000 1,000,000 1,500,000 2,000,000 P1 P2 P3 P4 P4 P6 P7 Enrollment 6 Enrollment Pyramid in any recent year What is the size of the job? P5
  • 7.
    What do themost basic numbers tell us? 0 500,000 1,000,000 1,500,000 2,000,000 P1 P2 P3 P4 P4 P6 P7 Enrollment 7 Enrollment Pyramid in any recent year What is the size of the job? This big? P5
  • 8.
    But what happensif we overlay the population? 0 500,000 1,000,000 1,500,000 2,000,000 P1 P2 P3 P4 P4 P6 P7 Popluation of appropriate age Enrollment 8 Enrollment with Population Overlay What do we notice? Compare population and enrollment carefully. P5
  • 9.
    But what happensif we overlay the population? 0 500,000 1,000,000 1,500,000 2,000,000 P1 P2 P3 P4 P4 P6 P7 Popluation of appropriate age Enrollment 9 Enrollment with Population Overlay This small? What is the size of the job now? P5
  • 10.
    So what isgoing on here?  Why is there so much enrollment compared to population in grade 1?  And even in the other grades?  Could it be under-age and over-age enrollment? 10
  • 11.
    0 20 40 60 80 100 120 140 160 180 200 2001 2002 20032004 2005 2006 2007 2008 2009 2010 Gross Intake Ratio into Grade 1: One Decade Let’s look at the intake rate. Now, what is the “normal intake”? 100%
  • 12.
    0 20 40 60 80 100 120 140 160 180 200 2001 2002 20032004 2005 2006 2007 2008 2009 2010 Gross Intake Ratio into Grade 1: One Decade Now, what is the “normal intake”? 100%
  • 13.
    0 20 40 60 80 100 120 140 160 180 200 2001 2002 20032004 2005 2006 2007 2008 2009 2010 Gross Intake Ratio into Grade 1: One Decade 15 Now suppose you start out with half the kids out of school in 2000… Now, what is the “normal intake”? 100%
  • 14.
    0 20 40 60 80 100 120 140 160 180 200 2001 2002 20032004 2005 2006 2007 2008 2009 2010 Gross Intake Ratio into Grade 1: One Decade … Even with 50% OOS in 2000, in just a few years the over-age due to that would have been taken in, the top triangle compensating for the bottom one, because the system was over-intaking by 60% to 80%. And then you have all that rectangle to spare: impossible. Now, what is the “normal intake”? 100%
  • 15.
    Early bulge: Ugandaas compared to 40 other countries 0.25 0.5 0.75 1 1.25 1.5 1.75 2 2.25 2.5 2.75 Enrol1/Pop7 Enrol2/Pop8 Enrol3/Pop9 Enrol4/Pop10 Enrol5/Pop11 Enrol6/Pop12 EnrollmentGradeforAge Age for Grade and the Early Grades Bulge Uganda Median, other countries with foundational problems
  • 16.
    Study the problemby looking at 4 key ratios  Ratio of P1 enrollment to Pop Age 7  Ratio of P2 enrollment to P1 enrollment  Gross intake ratio into P1  Gross Enrollment Ratio in pre-primary
  • 17.
    “Ideal values”, realvalues in other countries, Uganda “Ideal” values Real, other countries with Foundational First Five problems Uganda (over same time period) P1/Age 7 About 1.0 1.50 1.60 P2/P1 About 1.0 0.82 0.70 GIR into P1 About 1.0 higher only in post conflict or after huge reforms 1.27 1.50 GER in pre-primary At least 1.0 0.24 0.13
  • 18.
    Conclusions thus far The bulge in over-enrollment in early grades cannot be due to under-age or over-age entry or intake  It may likely be partially due to some exaggeration  But the main pattern is probably rather large-scale, under- reported repetition: “in school over-aging”  A major reason for this: Grade 1 is widely available and free  So, parents “use” Grade 1 as a form of ECD  It is expected repetition, aging-in-place  But a very inefficient form of ECD
  • 19.
    Another clue toFFF problems: crisis in early grade reading Testing in some 53 language/country combinations: about 50% of kids unable to read any words in the language of instruction
  • 20.
    • This • is •how • most • 3rd-grade kids • in • Uganda • read, at best • • This • is • how • most • 3rd-grade kids • in • rich countries (OECD) • read • What it feels like to be a non-reader…
  • 21.
    In Uganda: sameearly-grade reading “crisis” Oral Reading Fluency % of children 0 82% > 0 to <=5 3% > 5 to <=10 3% > 10 to <=15 4% > 15 to <=20 3% > 20 to <=25 2% > 25 to <=30 2% > 30 to <=35 1% Using all 2014 SHRP control schools in P2 in the four languages assessed. About 82% unable to read any words
  • 22.
    Summary up tonow: Foundational First Five Triple Crisis Triple crisis in “Foundational First Five” 1. Crisis of un-reported (very large) repetition, exaggerated (implausible) intake, not much dropout in the early grades (in spite of opinion that there is) 2. Lack of early childhood care / kindergarten and even pre- kindergarten 3. Crisis of reading in the early grades – About ½ of children in early grades in poorer areas are not capable of reading a single word – This combines with the above two You get the triple crisis in the first five years Not just Uganda but in some 40 countries
  • 23.
    What are theeconomics and finance?  Goal: – Reduce the waste, over-enrollment, and dropping out due to problems in Foundational First Five – Reduce the cost of producing a completer  Does require some investment up front, but pays off: • In about 10 years • Via reductions in cumulative cost of completers  What investments are required?  What is the pay-off?  Based on a preliminary cost simulation model of the usual WB type (JP Tan, Mingat, Rakotomalala, etc.)
  • 24.
     Based onpatterns from SHRP and good thinking in GPE plan  Investments: – Expand access to pre-grade-1 education – Training of teachers in all pre-primary, public or private – Expand early-grade teacher training to 3 key subjects, 5 or 6 key grades – Improved books provision – Better teacher supervision – Better school management and governance – Overall systems improvement What investments are required, what is the benefit-cost?
  • 25.
    Results of financialsimulation model  Investment plan is reasonable  Break-even year: year 7 of the investment plan  Internal rate of return is 8% over 15 years: good investment  Costs per pupil do go up by about 15%  But costs per completer* go down 15% to 20% over 10-15 years *Proxied by P7 enrolee
  • 26.
    But remember… Using abudget and expenditure to improve things is like pushing on a string… You need to pull on a string… If you have • accountability systems, • data monitoring, • rewards and sanctions, • spreading of lessons learned: • systemic reforms. Then the budget can pull.
  • 27.
    The benefits arenot mainly in improved efficiency The real benefits are social and economic • Main message: • Education past P7 is enormously important for economic and social progress • Transition to S1 and S5 are key • We will take health as one example • But it is true for economics and other results
  • 28.
    Health Sector Policies Female Education (esp 2ndary) Econ growth Other ed policies (e.g., EGR) Contraceptive prevalence rate Mother’sage at first birth % of births professionally attended Number of children per woman (total fertility rate) Less mother deaths Better education of next generation “Independent” factors Intermediate factors Results Impacts of female secondary education
  • 29.
    Health Sector Policies Female Education (esp 2ndary) Econ growth Other ed policies (e.g., EGR) Contraceptive prevalence rate Mother’sage at first birth % of births professionally attended Number of children per woman (total fertility rate) Less mother deaths Better education of next generation 1 2 3 7 4 5 8 9 “Independent” factors Intermediate factors Results 6 Impacts of female secondary education
  • 30.
    That’s a theoreticalmodel… What do the real data look like for Uganda?
  • 31.
    What do thedata for Uganda look like? 0% 10% 20% 30% 40% 50% 60% 0 1 2 3 4 5 6 7 8 9 10 11 12 %ofTeenagers15-19yearswhohavehadachildorare pregnant Grades of Education Completed by Teenage Mother Teenage Motherhood: % Teenagers that are mothers, by grades of education
  • 32.
    R² = 0.8101 0% 10% 20% 30% 40% 50% 60% 01 2 3 4 5 6 7 8 9 10 11 12 %ofTeenagers15-19yearswhohavehadachildorare pregnant Grades of Education Completed by Teenage Mother Teenage Motherhood: % Teenagers that are mothers, by grades of education What do the data for Uganda look like?
  • 33.
    0% 10% 20% 30% 40% 50% 60% 0 1 23 4 5 6 7 8 9 10 11 12 PercentageContraceptiveUse Grades of Education of Mother Contraceptive Use among married women or those with live-in partners, by grades of education Using any FP method Using Modern FP Method What do the data for Uganda look like?
  • 34.
    0% 10% 20% 30% 40% 50% 60% 70% 80% 90% 100% 0 1 23 4 5 6 7 8 9 10 11 12 %ofdeliveriesassistedbyaprofessionalhealthworker Grades of Education of Mother Professional assistance during delivery, by mother’s grades of education What do the data for Uganda look like?
  • 35.
    .0 1.0 2.0 3.0 4.0 5.0 6.0 7.0 8.0 9.0 0 1 23 4 5 6 7 8 9 10 11 12 Numberofchildrenborn Grades of Education of Mother Total number of children ever born among women 40 - 49 years, by grades of education What do the data for Uganda look like?
  • 36.
    Summary  There isa crisis in the “Foundational First Five”  Over-enrollment, impossible intake, low ECD, non-reading in early grades  It is costly in wastage, repetition, dropout  Makes transition to secondary impossible  Investments needed: would raise cost per child, but considerably reduce cost per completer  Investment profile similar to current GPE, SHRP, LARA  Return on investment: about 8%-9%  It is important to do this: transition to secondary has huge social payoffs, but without solving the “Foundational First Five” you cannot do it  And you do need system reforms: just spending won’t do it 52