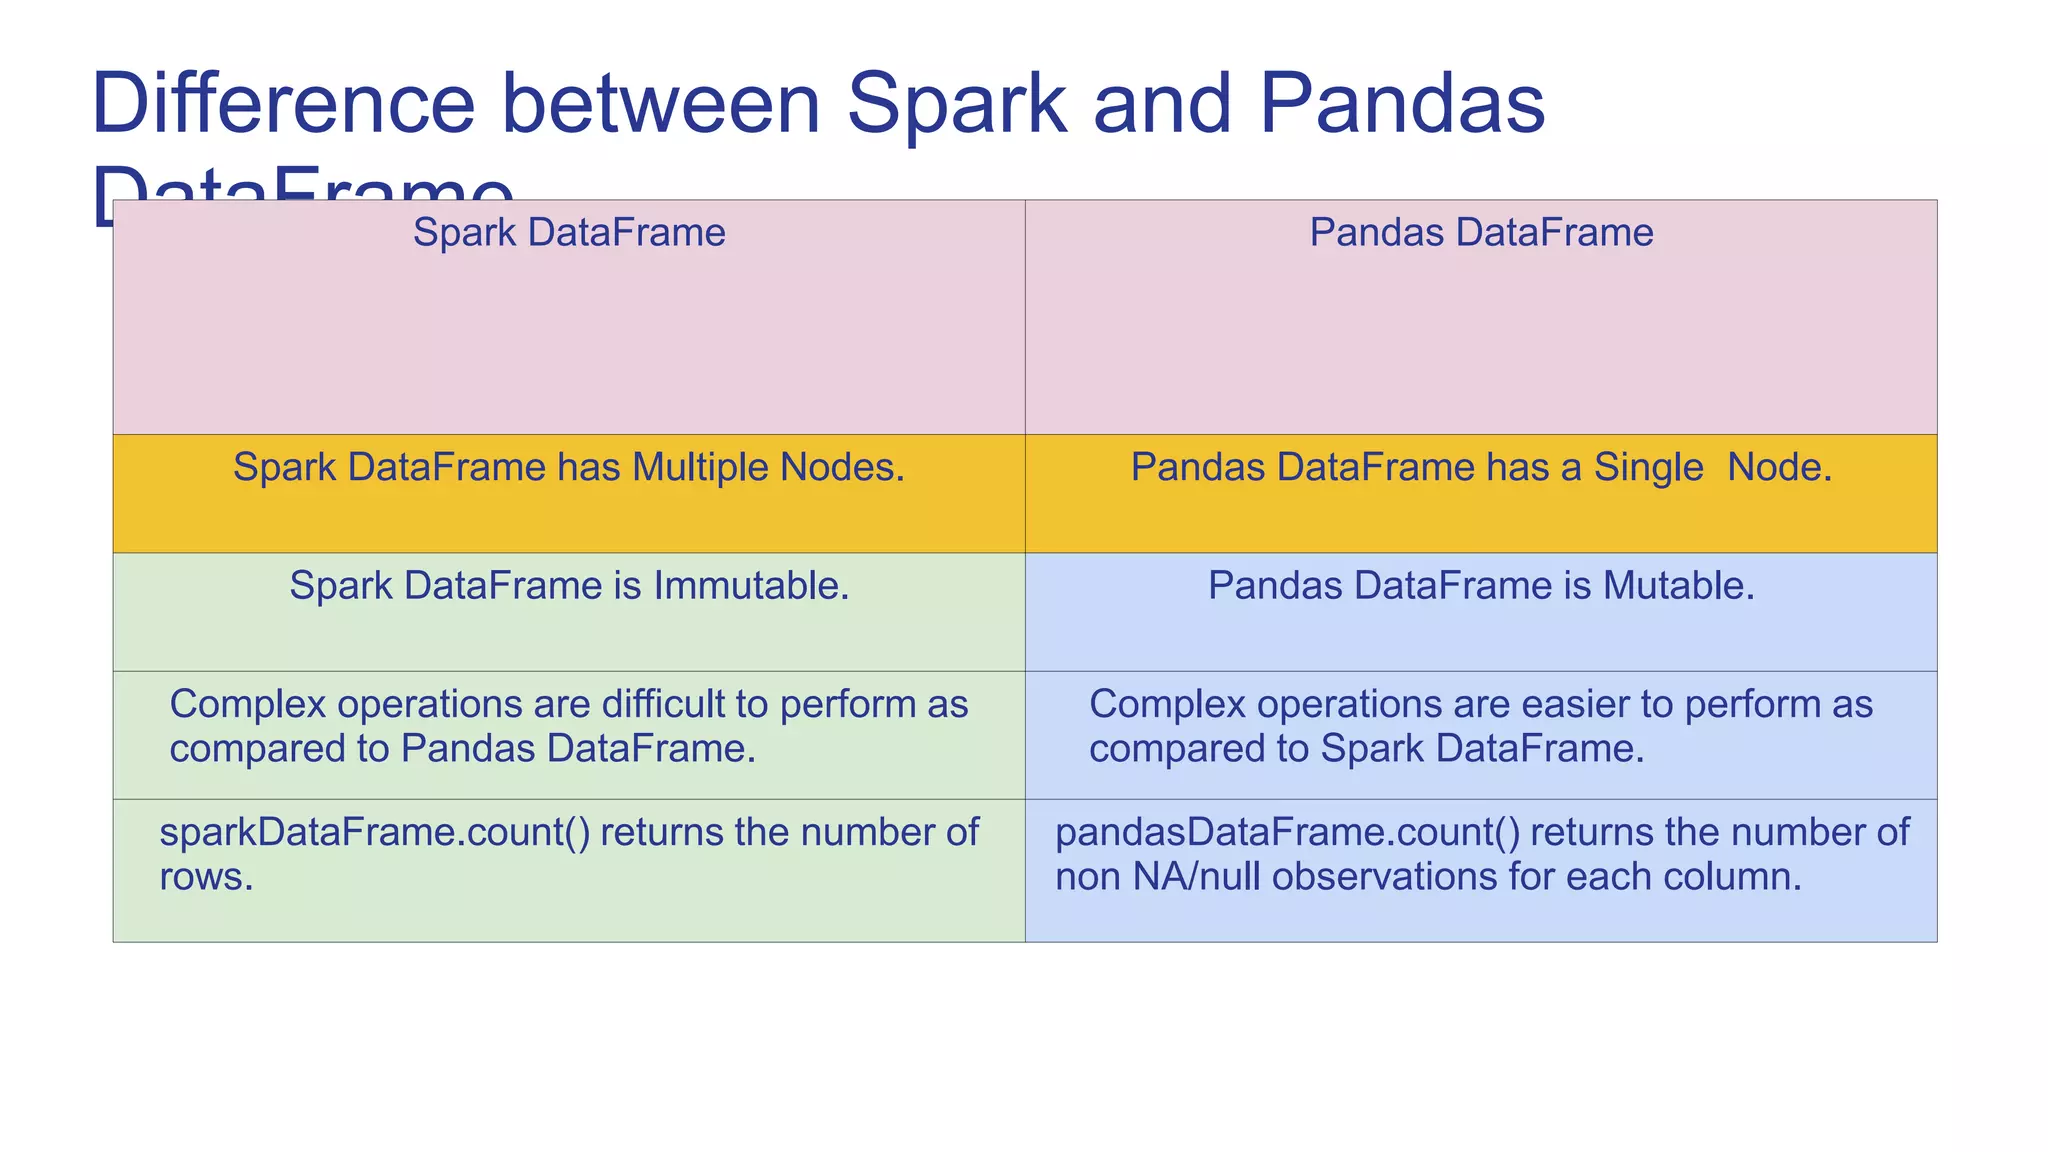
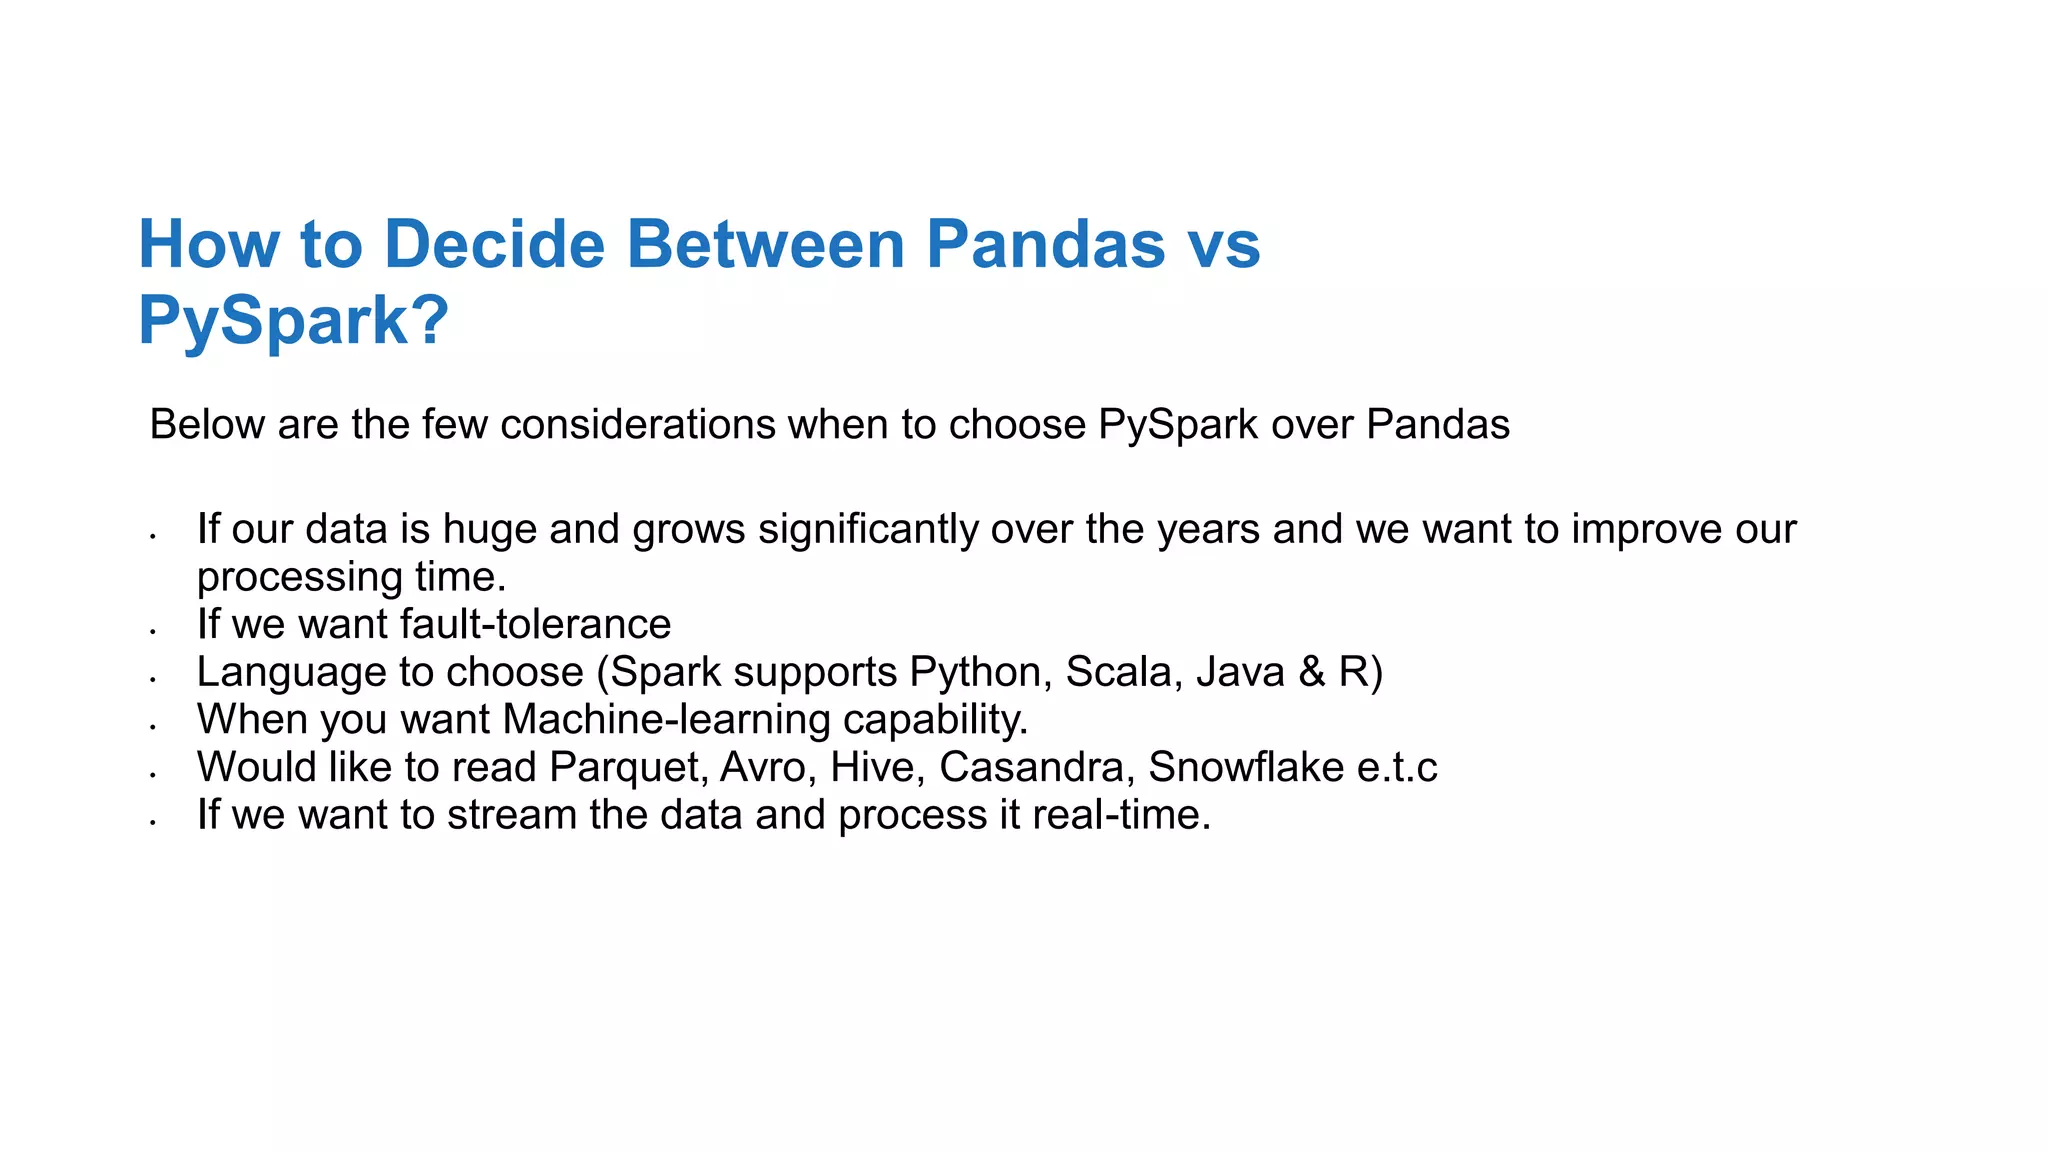
This document provides an introduction to pandas, a Python library used for data analysis and manipulation. It discusses pandas data structures like Series and DataFrames, how to create them from various data sources, perform operations on them like selection, filtering, handling missing values, and descriptive statistics. It also compares pandas DataFrames to Spark DataFrames and considerations for choosing between pandas and PySpark.


![Creating Series
import pandas as pd
s1 = pd.Series([1, 2, 3, 4])
0 1
1 2
2 3
3 4
s2 = pd.Series([1, 2, 3, 4], index=[‘A’, ‘B’, ‘C’, ‘D’])
A 1
B 2
C 3
D 4](https://image.slidesharecdn.com/pandas-230119070943-24d647f7/75/Pandas-ppt-4-2048.jpg)
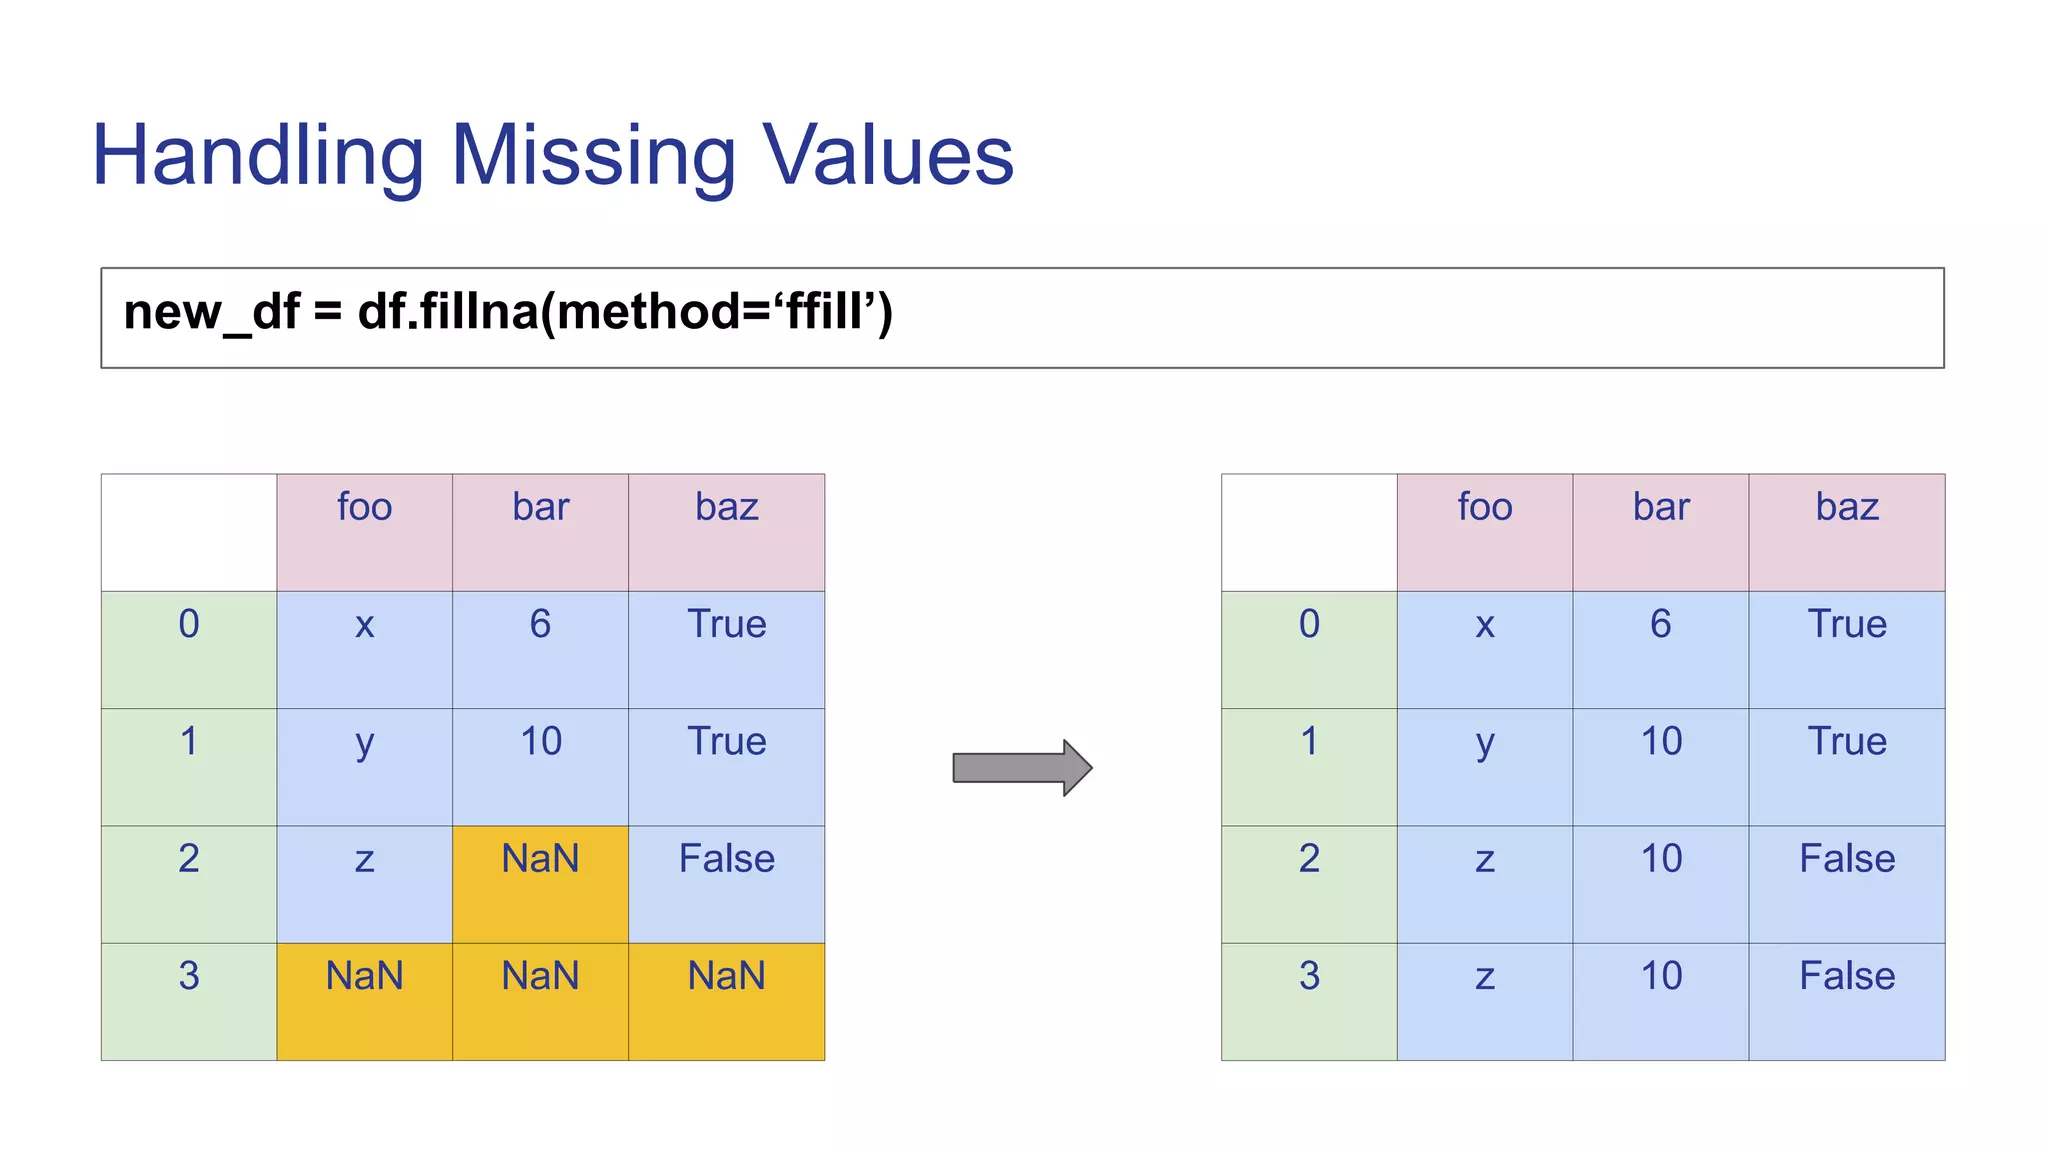
![Creating DataFrame
df = pd.DataFrame({‘foo’: [‘x’, ‘y’, ‘z’],
‘bar’: [6, 10, None],
‘baz’: [True, True, False]})
foo bar baz
0 x 6 True
1 y 10 True
2 z NaN False](https://image.slidesharecdn.com/pandas-230119070943-24d647f7/75/Pandas-ppt-5-2048.jpg)
![Creating DataFrame from list
calories=[420,300,150]
duration=[6,10,5]
df=pd.DataFrame(list (zip(calories , duration) ),columns=[‘Calories’,’Duration’])
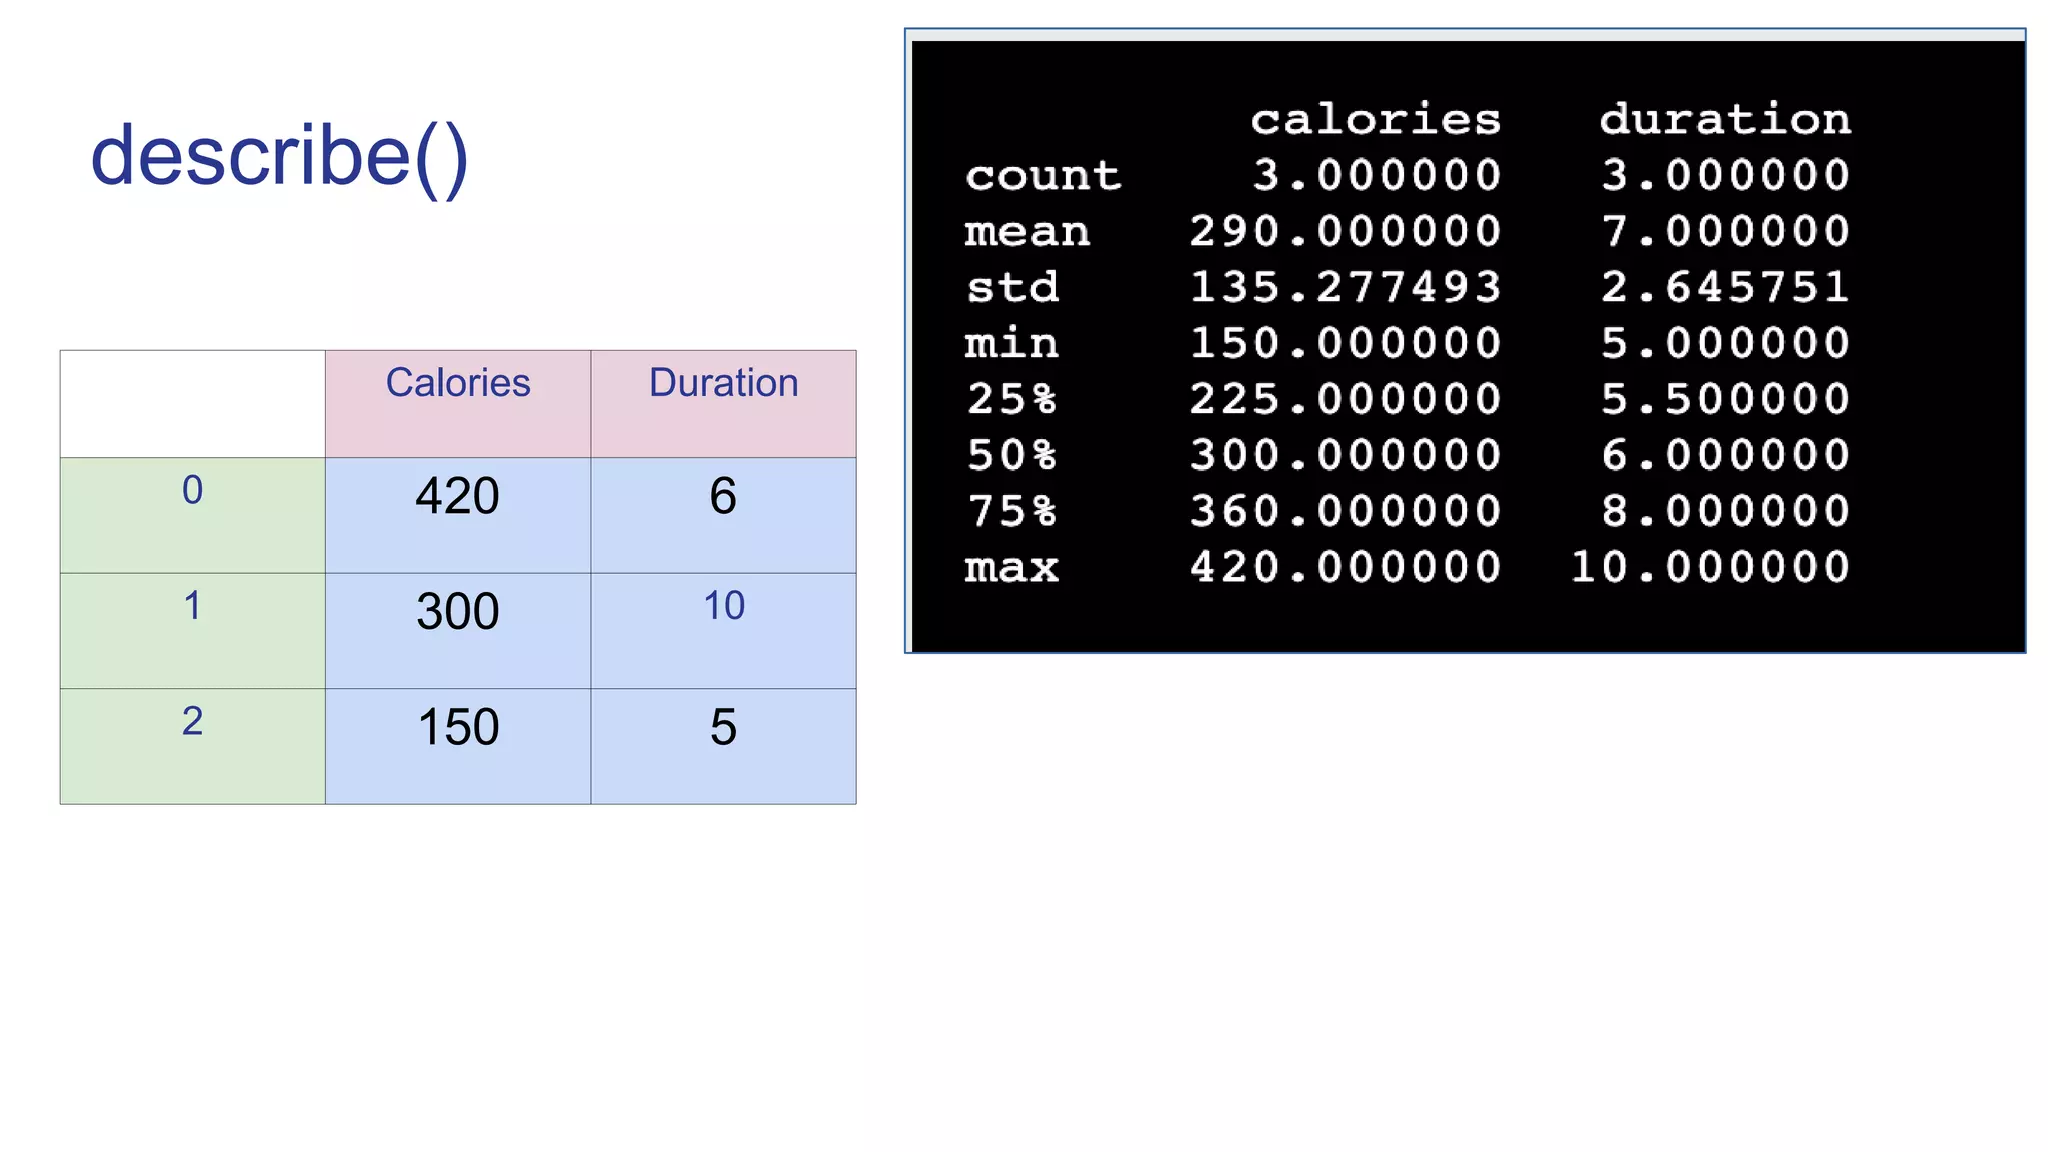
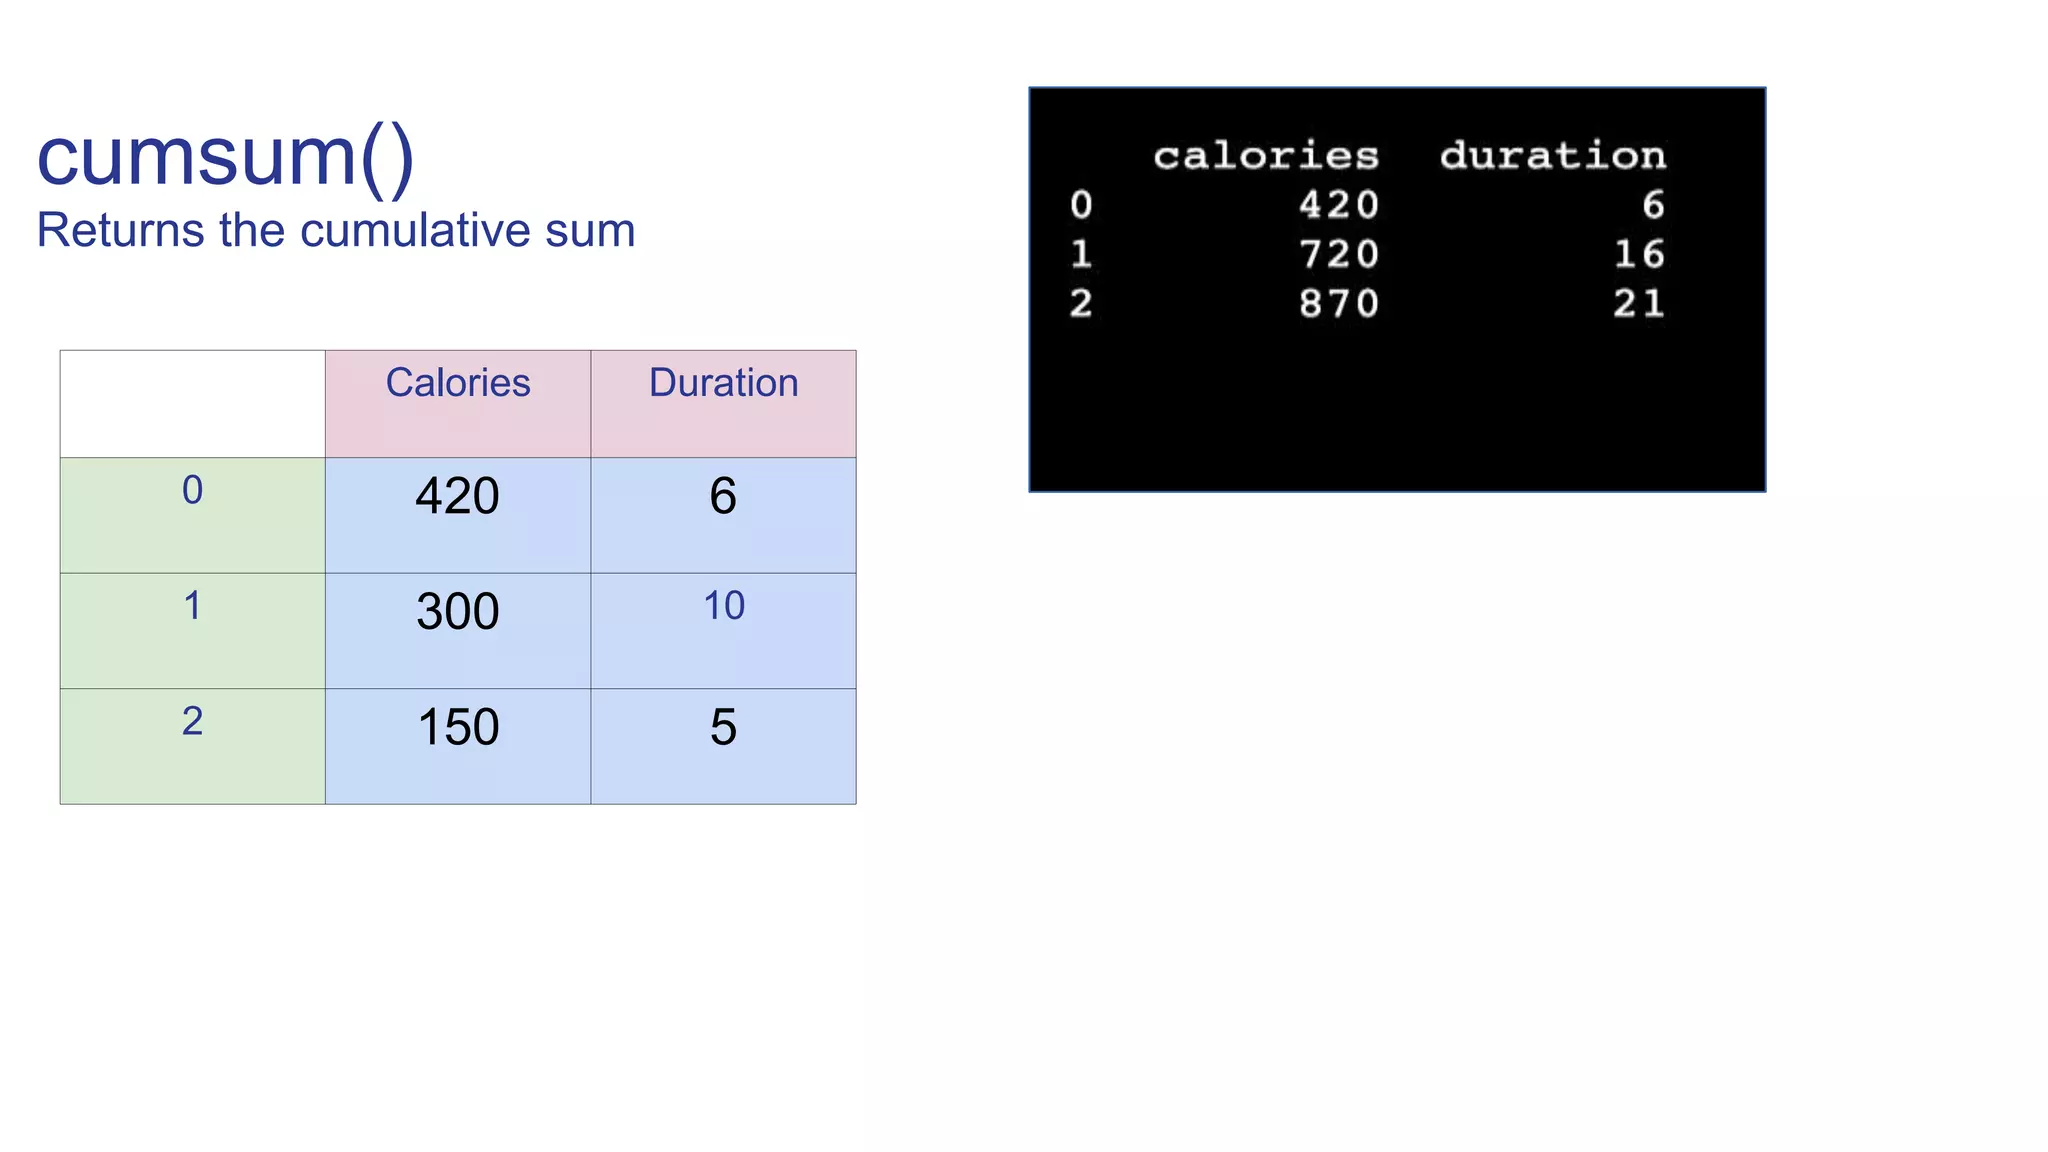
Calories Duration
0 420 6
1 300 10
2 150 5](https://image.slidesharecdn.com/pandas-230119070943-24d647f7/75/Pandas-ppt-8-2048.jpg)
![Column Selection
df[‘Calories’]
Calories
0 420
1 300
2 150
Calories Duration
0 420 6
1 300 10
2 150 5](https://image.slidesharecdn.com/pandas-230119070943-24d647f7/75/Pandas-ppt-9-2048.jpg)
![Column Selection
df[[‘Calories’,’Duration’]]
Calories Duration
0 420 6
1 300 10
2 150 5
Calories Duration
0 420 6
1 300 10
2 150 5](https://image.slidesharecdn.com/pandas-230119070943-24d647f7/75/Pandas-ppt-10-2048.jpg)
![Row Selection
df.loc[0]
Calories 420
Duration 6
Calories Duration
0 420 6
1 300 10
2 150 5](https://image.slidesharecdn.com/pandas-230119070943-24d647f7/75/Pandas-ppt-11-2048.jpg)
![Row Selection
df.loc[0:2] OR
df.loc[[0,1]]
Calories Duration
0 420 6
1 300 10
Calories Duration
0 420 6
1 300 10
2 150 5](https://image.slidesharecdn.com/pandas-230119070943-24d647f7/75/Pandas-ppt-12-2048.jpg)
![Cleaning wrong data
df.loc[2, 'Duration'] = 5
Calories Duration
0 420 6
1 300 10
2 150 5
Calories Duration
0 420 6
1 300 10
2 150 500](https://image.slidesharecdn.com/pandas-230119070943-24d647f7/75/Pandas-ppt-13-2048.jpg)
![Conditional Filtering
foo bar baz
0 x 6 True
1 y 10 True
2 z NaN False
df[ (df[‘baz’]) ]
foo bar baz
0 x 6 True
1 y 10 True](https://image.slidesharecdn.com/pandas-230119070943-24d647f7/75/Pandas-ppt-15-2048.jpg)
![Conditional Filtering
foo bar baz
0 x 6 True
1 y 10 True
2 z NaN False
df[ (df['foo'] == 'x') |
(df['foo'] == 'z') ]
foo bar baz
0 x 6 True
2 z NaN False](https://image.slidesharecdn.com/pandas-230119070943-24d647f7/75/Pandas-ppt-16-2048.jpg)
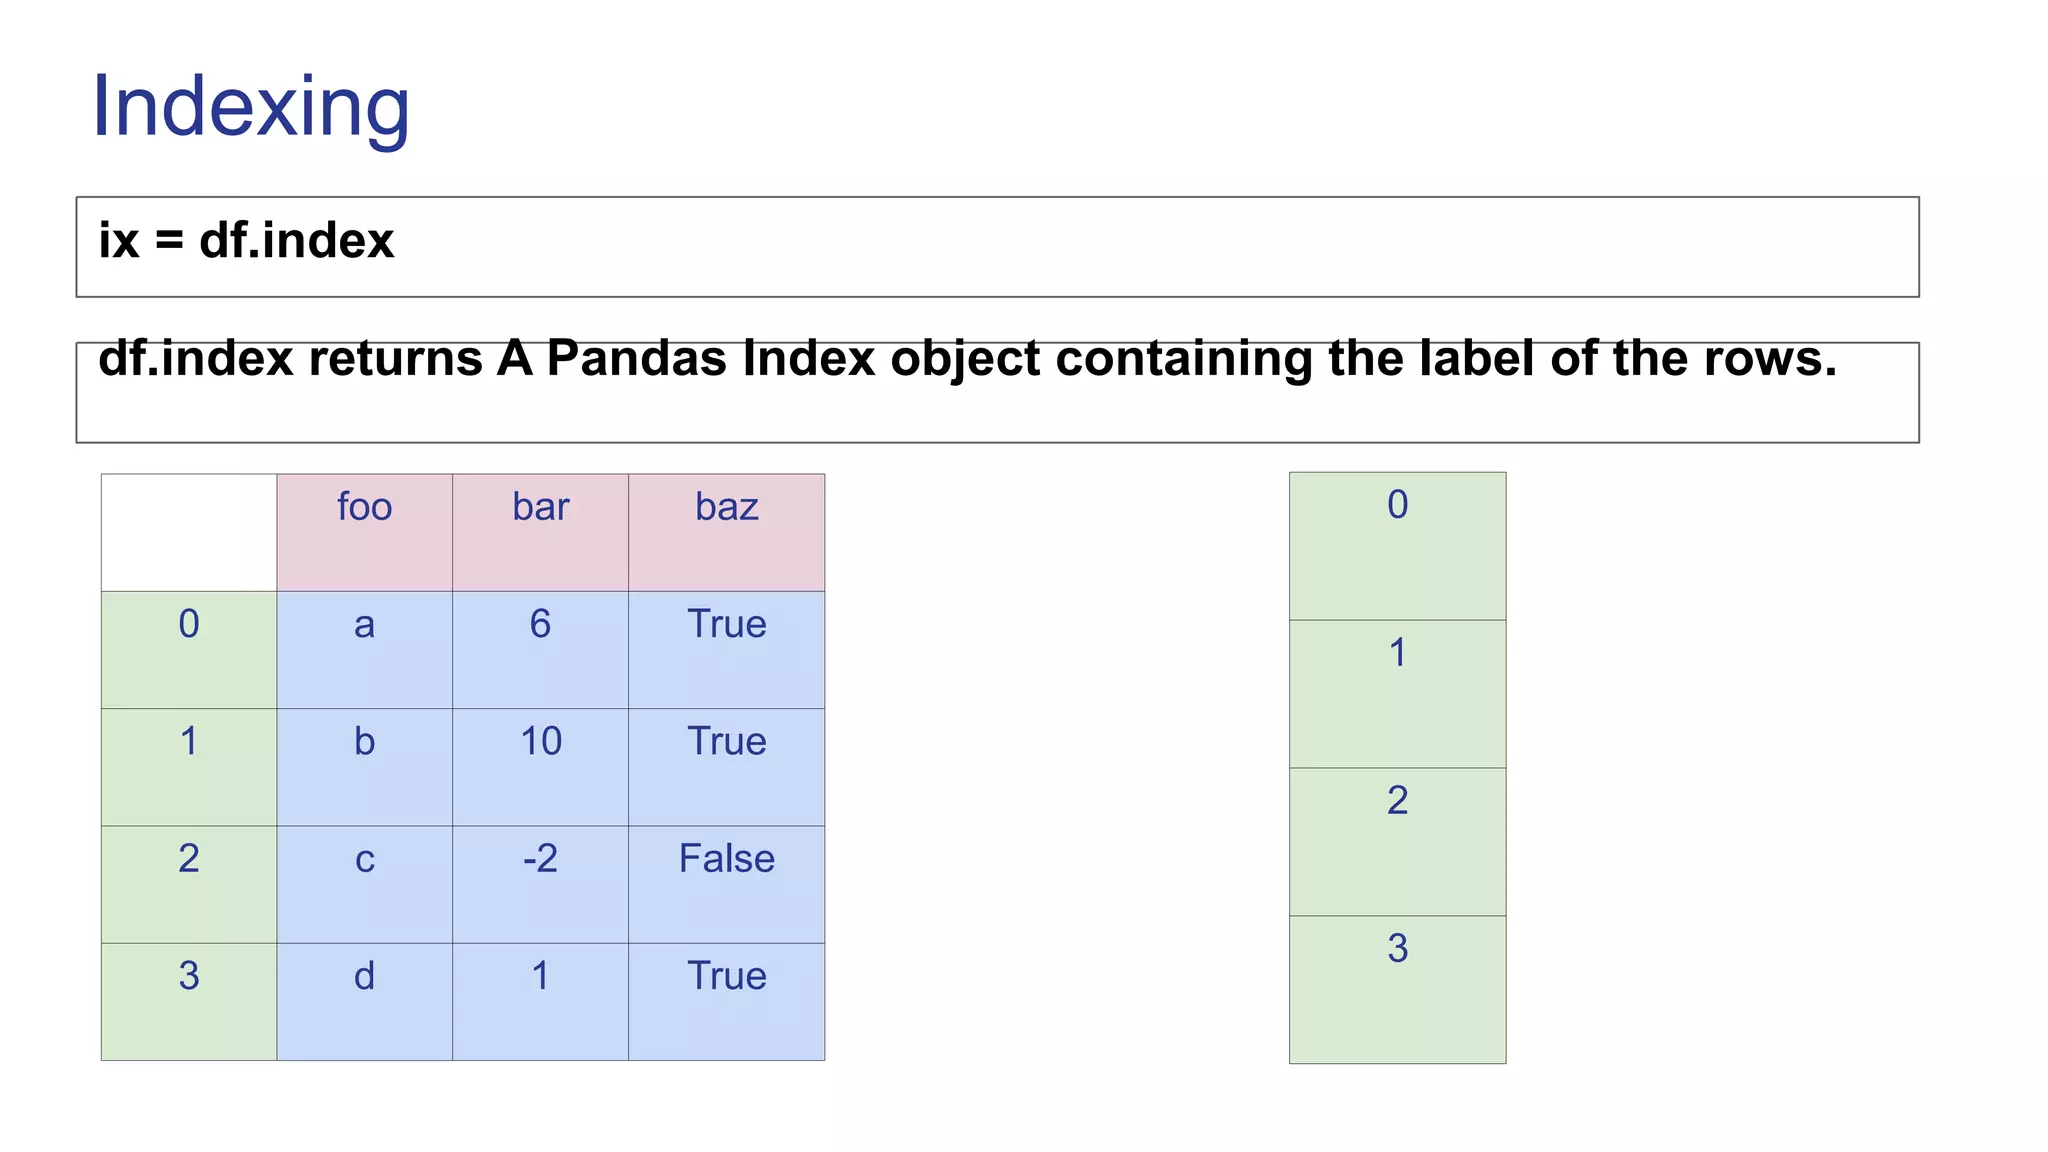
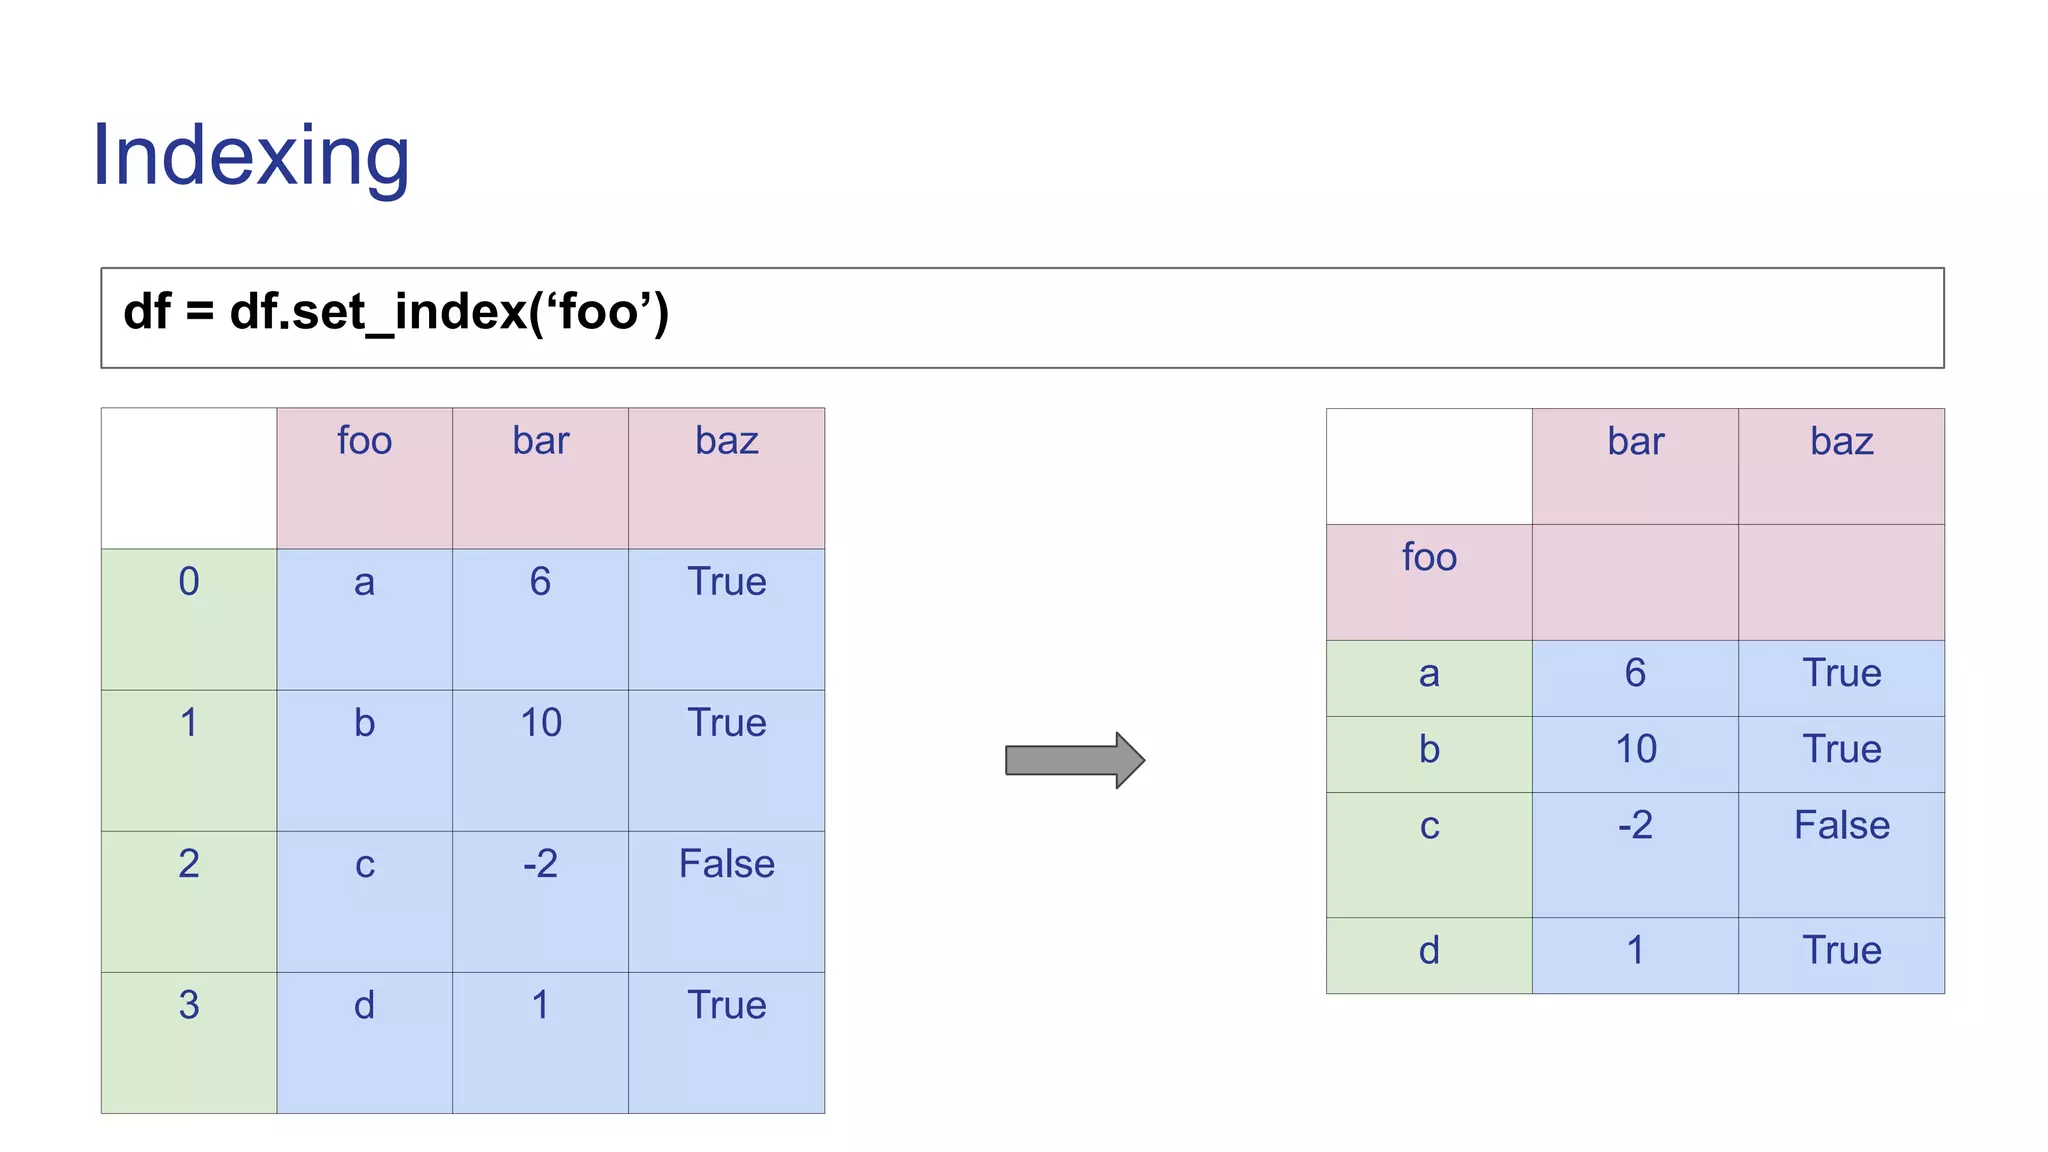
![Indexing
df.loc[‘a’]
bar baz
foo
a 6 True
b 10 True
c -2 False
d 1 True
bar 6
baz True
df.iloc[0]](https://image.slidesharecdn.com/pandas-230119070943-24d647f7/75/Pandas-ppt-23-2048.jpg)


![Function in Python [Autosaved].ppt](https://cdn.slidesharecdn.com/ss_thumbnails/functioninpythonautosaved-230410161341-0859b6e8-thumbnail.jpg?width=640&height=640&fit=bounds)


![Introduction to Pandas and Time Series Analysis [PyCon DE]](https://cdn.slidesharecdn.com/ss_thumbnails/introductiontopandasandtimeseriesanalysispyconde-170617163724-thumbnail.jpg?width=640&height=640&fit=bounds)