Introduction
●Pandas is anopen-source library that uses for working with relational or labeled
data both easily and intuitively.
●It provides various data structures and operations for manipulating numerical data
and time series.
●It offers a tool for cleaning and processes your data.
●It is the most popular Python library that is used for data analysis.
●It supports two data structures:
● Series
● Dataframe
3.
What is aSeries?
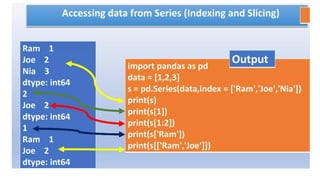
• A Pandas Series is like a column in a table.
• It is a one-dimensional array holding data of any type.
• If nothing else is specified, the values are labeled with their index
number.
• First value has index 0, second value has index 1 etc.
• This label can be used to access a specified value.
4.
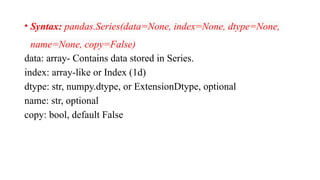
• Syntax: pandas.Series(data=None,index=None, dtype=None,
name=None, copy=False)
data: array- Contains data stored in Series.
index: array-like or Index (1d)
dtype: str, numpy.dtype, or ExtensionDtype, optional
name: str, optional
copy: bool, default False
5.
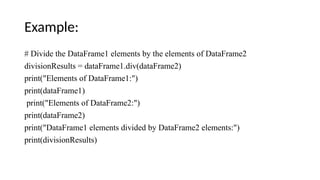
Example1:
import pandas aspd
# a simple char list
list = ['h', 'e', 'l', 'l', 'o']
# create series from a char list
res = pd.Series(list)
print(res)
Output:
0 h
1 e
2 l
3 l
4 0
dtype: object
6.
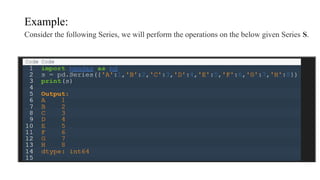
Example 2: Createa simple Pandas Series
from a list:
import pandas as pd
a = [1, 7, 2]
myvar = pd.Series(a)
print(myvar)
print(myvar[0])
Output:
0 1
1 7
2 2
dtype: int64
1
7.
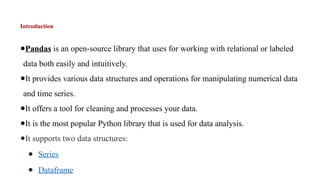
Example 3: Createlabel
import pandas as pd
a = [1,7,2]
myvar = pd.Series(a, index = ["x","y","z"])
print(myvar)
Output:
x 1
y 7
z 2
dtype: int64
8.
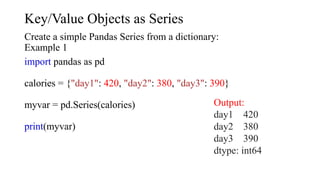
Key/Value Objects asSeries
Create a simple Pandas Series from a dictionary:
Example 1
import pandas as pd
calories = {"day1": 420, "day2": 380, "day3": 390}
myvar = pd.Series(calories)
print(myvar)
Output:
day1 420
day2 380
day3 390
dtype: int64
9.
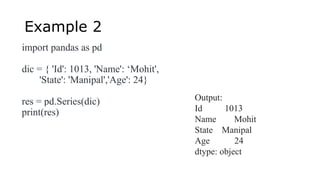
Example 2
import pandasas pd
dic = { 'Id': 1013, 'Name': ‘Mohit',
'State': 'Manipal','Age': 24}
res = pd.Series(dic)
print(res)
Output:
Id 1013
Name Mohit
State Manipal
Age 24
dtype: object
10.
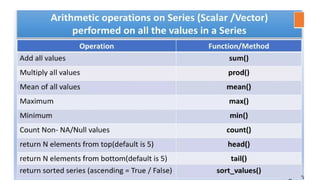
Operations on aSeries
• Pandas Series provides two very useful methods for extracting the data from
the top and bottom of the Series Object.
• These methods are head() and tail().
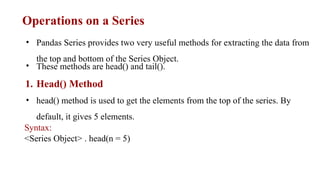
1. Head() Method
• head() method is used to get the elements from the top of the series. By
default, it gives 5 elements.
Syntax:
<Series Object> . head(n = 5)
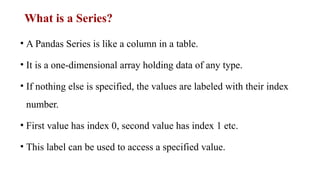
head() Function withoutargument
If we do not give any argument inside head() function, it will give by default 5
values from the top.
import pandas as pd # Creating a Pandas Series
data = pd.Series([10, 20, 30, 40, 50, 60, 70, 80]) #
Using head() method (default n=5)
print(data.head())
13.
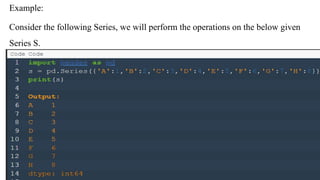
When a positivenumber is provided, the head() function will extract the top n rows from Series
Object. In the below given example, I have given 7, so 7 rows from the top has been extracted.
head() Function with
Positive Argument
head() Function with negative
Argument
14.
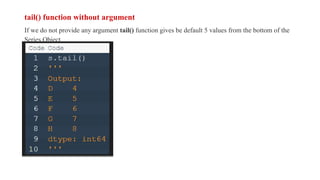
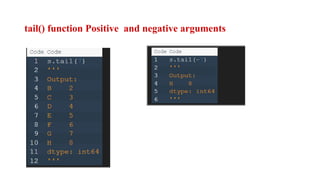
2. Tail() Method
tail()method gives the elements of series from the bottom.
Syntax:
<Series Object> . tail(n = 5)
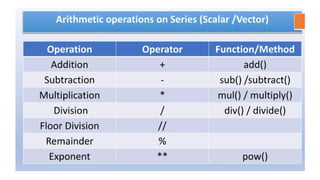
3. Vector operations
•Like NumPy array, series support vector operations.
• Batch operations on data without writing any for loops. This is usually
called vectorization.
19.
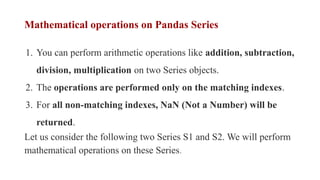
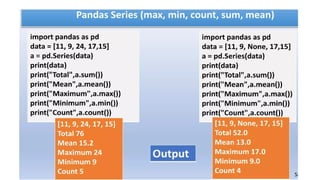
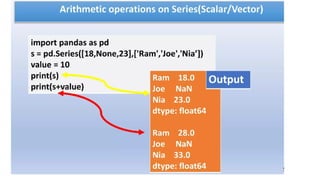
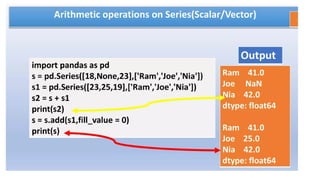
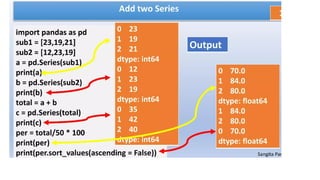
Mathematical operations onPandas Series
1. You can perform arithmetic operations like addition, subtraction,
division, multiplication on two Series objects.
2. The operations are performed only on the matching indexes.
3. For all non-matching indexes, NaN (Not a Number) will be
returned.
Let us consider the following two Series S1 and S2. We will perform
mathematical operations on these Series.
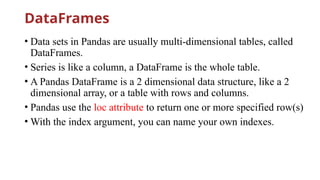
DataFrames
• Data setsin Pandas are usually multi-dimensional tables, called
DataFrames.
• Series is like a column, a DataFrame is the whole table.
• A Pandas DataFrame is a 2 dimensional data structure, like a 2
dimensional array, or a table with rows and columns.
• Pandas use the loc attribute to return one or more specified row(s)
• With the index argument, you can name your own indexes.
29.
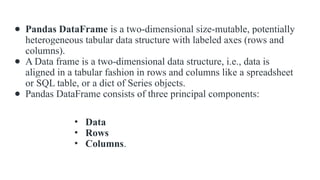
● Pandas DataFrameis a two-dimensional size-mutable, potentially
heterogeneous tabular data structure with labeled axes (rows and
columns).
● A Data frame is a two-dimensional data structure, i.e., data is
aligned in a tabular fashion in rows and columns like a spreadsheet
or SQL table, or a dict of Series objects.
● Pandas DataFrame consists of three principal components:
• Data
• Rows
• Columns.
30.
Example1:
import pandas aspd
# list of strings
lst = ['welcome', 'to', 'gods', 'own', 'country']
# Calling DataFrame constructor on list
df = pd.DataFrame(lst)
display(df)
Output:
31.
2. Create aDataFrame from two Series:
import pandas as pd
data = {
"calories": [420, 380, 390],
"duration": [50, 40, 45]
}
myvar = pd.DataFrame(data)
print(myvar)
Output:
32.
3.Creating DataFrame fromdict of array/lists.
# Python code demonstrate creating
# DataFrame from dict narray / lists
# By default addresses.
import pandas as pd
# initialise data of lists.
data = {'Name':['Tom', 'nick', 'krish', 'jack'],
'Age':[20, 21, 19, 18]}
# Create DataFrame
df = pd.DataFrame(data)
# Print the output.
display(df)
Selection of column:The [ ] operator is used to select a column by
mentioning the respective column name.
# Import pandas package
import pandas as pd
# Define a dictionary containing employee data
data = {'Name':['Jai', 'Princi', 'Gaurav', 'Anuj'],
'Age':[27, 24, 22, 32],
'Address':['Delhi', 'Kanpur', 'Allahabad', 'Kannauj'],
'Qualification':['Msc', 'MA', 'MCA', 'Phd']}
# Convert the dictionary into DataFrame
df = pd.DataFrame(data)
# select two columns
35.
How to SelectRows and Column from
Pandas DataFrame based on condition?
Example 1: Selecting rows.
pandas.DataFrame.loc is a function used to select rows from Pandas
DataFrame based on the condition provided.
Syntax: df.loc[df[‘cname’] ‘condition’]
Parameters:
● df: represents data frame
● cname: represents column name
● condition: represents condition on which rows has to be selected
36.
from pandas importDataFrame ** Example for selecting row
# Creating a data frame
Data = {'Name': ['Mohe', 'Shyni', 'Parul', 'Sam'],
'ID': [12, 43, 54, 32],
'Place': ['Delhi', 'Kochi', 'Pune', 'Patna']
}
df = DataFrame(Data, columns = ['Name', 'ID', 'Place'])
# Print original data frame
print("Original data frame:n")
display(df)
# Selecting the product of Electronic Type
select_prod = df.loc[df['Name'] == 'Mohe']
print("n")
# Print selected rows based on the condition
print("Selecting rows:n")
display (select_prod)
37.
Example for selectingcolumn
# Importing pandas as pd
from pandas import DataFrame
# Creating a data frame
Data = {'Name': ['Mohe', 'Shyni', 'Parul', 'Sam'],
'ID': [12, 43, 54, 32],
'Place': ['Delhi', 'Kochi', 'Pune', 'Patna']
}
df = DataFrame(Data, columns = ['Name', 'ID', 'Place'])
# Print original data frame
print("Original data frame:")
display(df)
print("Selected column: ")
display(df[['Name', 'ID']] )
38.
Add a NewColumn
Let’s create a DataFrame object to begin.
Method 1:
import pandas as pd
df = pd.DataFrame({'price': [3, 89, 45, 6], 'amount': [57, 42, 70, 43]})
df['total'] = df['price'] * df['amount']
39.
Method 2
If youwant to specify where your new column should be inserted in the DataFrame, you can use
the DataFrame.insert() method. The insert method has four parameters:
insert(loc, new column name, value, allow_duplications)
● loc: the column insertion index
● column: new column label
● value: desired row data
● allow_duplications: (optional) will not create a new column if a column with the same label
already exists
We can insert our new 'total' column at index 0 in our DataFrame object using the following code.
df.insert(0, 'total', df['price']*df['amount'], False)
40.
Delete a Column
●The best way to delete Dataframe columns in Pandas is with the DataFrame.drop() method.
● The drop method is very flexible and can be used to drop specific rows or columns.
● It can also drop multiple columns at a time by either the column’s index or the column’s name.
● labels: index or column labels to drop
● axis: whether to drop labels from the index (0 or 'index') or columns (1 or 'columns')
● inplace: if True, complete the operation inplace and return None (data frame has to make
changes permanent)
df.drop('total', 1, inplace=True)
df.drop(df.columns[[1, 2]], 1, inplace=True)
41.
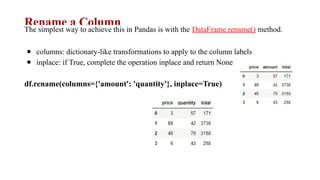
Rename a Column
Thesimplest way to achieve this in Pandas is with the DataFrame.rename() method.
● columns: dictionary-like transformations to apply to the column labels
● inplace: if True, complete the operation inplace and return None
df.rename(columns={'amount': 'quantity'}, inplace=True)
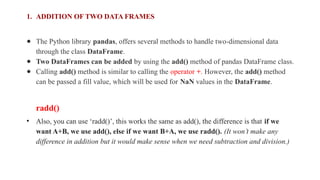
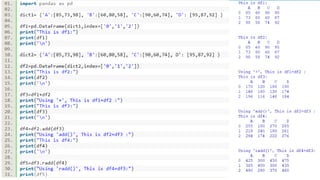
1. ADDITION OFTWO DATA FRAMES
● The Python library pandas, offers several methods to handle two-dimensional data
through the class DataFrame.
● Two DataFrames can be added by using the add() method of pandas DataFrame class.
● Calling add() method is similar to calling the operator +. However, the add() method
can be passed a fill value, which will be used for NaN values in the DataFrame.
radd()
• Also, you can use ‘radd()’, this works the same as add(), the difference is that if we
want A+B, we use add(), else if we want B+A, we use radd(). (It won’t make any
difference in addition but it would make sense when we need subtraction and division.)
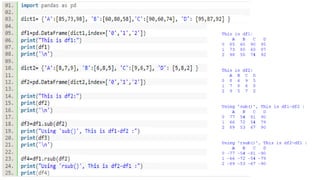
2. Subtracting APandas DataFrame From Another
DataFrame
● Python pandas library provides multitude of functions to work on two dimensioanl
Data through the DataFrame class.
● The sub() method of pandas DataFrame subtracts the elements of one DataFrame
from the elements of another DataFrame.
● Invoking sub() method on a DataFrame object is equivalent to calling the binary
subtraction operator(-).
● The sub() method supports passing a parameter for missing values(np.nan, None).
● rsub(): if you want A-B, then use ‘sub()’, but if you want B-A, then use ‘rsub()’
SYNTAX
● dataFrame1.rsub(dataFrame2)
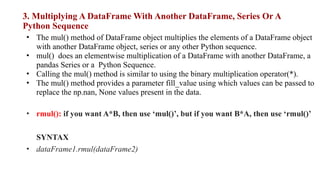
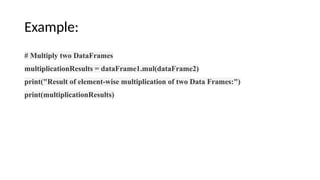
3. Multiplying ADataFrame With Another DataFrame, Series Or A
Python Sequence
• The mul() method of DataFrame object multiplies the elements of a DataFrame object
with another DataFrame object, series or any other Python sequence.
• mul() does an elementwise multiplication of a DataFrame with another DataFrame, a
pandas Series or a Python Sequence.
• Calling the mul() method is similar to using the binary multiplication operator(*).
• The mul() method provides a parameter fill_value using which values can be passed to
replace the np.nan, None values present in the data.
• rmul(): if you want A*B, then use ‘mul()’, but if you want B*A, then use ‘rmul()’
SYNTAX
• dataFrame1.rmul(dataFrame2)
50.
Example:
# Multiply twoDataFrames
multiplicationResults = dataFrame1.mul(dataFrame2)
print("Result of element-wise multiplication of two Data Frames:")
print(multiplicationResults)
51.
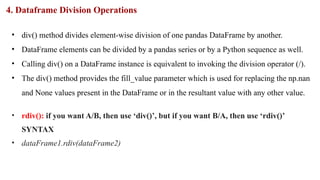
4. Dataframe DivisionOperations
• div() method divides element-wise division of one pandas DataFrame by another.
• DataFrame elements can be divided by a pandas series or by a Python sequence as well.
• Calling div() on a DataFrame instance is equivalent to invoking the division operator (/).
• The div() method provides the fill_value parameter which is used for replacing the np.nan
and None values present in the DataFrame or in the resultant value with any other value.
• rdiv(): if you want A/B, then use ‘div()’, but if you want B/A, then use ‘rdiv()’
SYNTAX
• dataFrame1.rdiv(dataFrame2)
52.
Example:
# Divide theDataFrame1 elements by the elements of DataFrame2
divisionResults = dataFrame1.div(dataFrame2)
print("Elements of DataFrame1:")
print(dataFrame1)
print("Elements of DataFrame2:")
print(dataFrame2)
print("DataFrame1 elements divided by DataFrame2 elements:")
print(divisionResults)


![Example1:
import pandas as pd
# a simple char list
list = ['h', 'e', 'l', 'l', 'o']
# create series from a char list
res = pd.Series(list)
print(res)
Output:
0 h
1 e
2 l
3 l
4 0
dtype: object](https://image.slidesharecdn.com/seriesanddataframes-250314064642-08a57a77/85/introduction-to-data-structures-in-pandas-5-320.jpg)
![Example 2: Create a simple Pandas Series
from a list:
import pandas as pd
a = [1, 7, 2]
myvar = pd.Series(a)
print(myvar)
print(myvar[0])
Output:
0 1
1 7
2 2
dtype: int64
1](https://image.slidesharecdn.com/seriesanddataframes-250314064642-08a57a77/85/introduction-to-data-structures-in-pandas-6-320.jpg)
![Example 3: Create label
import pandas as pd
a = [1,7,2]
myvar = pd.Series(a, index = ["x","y","z"])
print(myvar)
Output:
x 1
y 7
z 2
dtype: int64](https://image.slidesharecdn.com/seriesanddataframes-250314064642-08a57a77/85/introduction-to-data-structures-in-pandas-7-320.jpg)
![head() Function without argument
If we do not give any argument inside head() function, it will give by default 5
values from the top.
import pandas as pd # Creating a Pandas Series
data = pd.Series([10, 20, 30, 40, 50, 60, 70, 80]) #
Using head() method (default n=5)
print(data.head())](https://image.slidesharecdn.com/seriesanddataframes-250314064642-08a57a77/85/introduction-to-data-structures-in-pandas-12-320.jpg)

![Example1:
import pandas as pd
# list of strings
lst = ['welcome', 'to', 'gods', 'own', 'country']
# Calling DataFrame constructor on list
df = pd.DataFrame(lst)
display(df)
Output:](https://image.slidesharecdn.com/seriesanddataframes-250314064642-08a57a77/85/introduction-to-data-structures-in-pandas-30-320.jpg)
![2. Create a DataFrame from two Series:
import pandas as pd
data = {
"calories": [420, 380, 390],
"duration": [50, 40, 45]
}
myvar = pd.DataFrame(data)
print(myvar)
Output:](https://image.slidesharecdn.com/seriesanddataframes-250314064642-08a57a77/85/introduction-to-data-structures-in-pandas-31-320.jpg)
![3.Creating DataFrame from dict of array/lists.
# Python code demonstrate creating
# DataFrame from dict narray / lists
# By default addresses.
import pandas as pd
# initialise data of lists.
data = {'Name':['Tom', 'nick', 'krish', 'jack'],
'Age':[20, 21, 19, 18]}
# Create DataFrame
df = pd.DataFrame(data)
# Print the output.
display(df)](https://image.slidesharecdn.com/seriesanddataframes-250314064642-08a57a77/85/introduction-to-data-structures-in-pandas-32-320.jpg)

![Selection of column: The [ ] operator is used to select a column by
mentioning the respective column name.
# Import pandas package
import pandas as pd
# Define a dictionary containing employee data
data = {'Name':['Jai', 'Princi', 'Gaurav', 'Anuj'],
'Age':[27, 24, 22, 32],
'Address':['Delhi', 'Kanpur', 'Allahabad', 'Kannauj'],
'Qualification':['Msc', 'MA', 'MCA', 'Phd']}
# Convert the dictionary into DataFrame
df = pd.DataFrame(data)
# select two columns](https://image.slidesharecdn.com/seriesanddataframes-250314064642-08a57a77/85/introduction-to-data-structures-in-pandas-34-320.jpg)
![How to Select Rows and Column from
Pandas DataFrame based on condition?
Example 1: Selecting rows.
pandas.DataFrame.loc is a function used to select rows from Pandas
DataFrame based on the condition provided.
Syntax: df.loc[df[‘cname’] ‘condition’]
Parameters:
● df: represents data frame
● cname: represents column name
● condition: represents condition on which rows has to be selected](https://image.slidesharecdn.com/seriesanddataframes-250314064642-08a57a77/85/introduction-to-data-structures-in-pandas-35-320.jpg)
![from pandas import DataFrame ** Example for selecting row
# Creating a data frame
Data = {'Name': ['Mohe', 'Shyni', 'Parul', 'Sam'],
'ID': [12, 43, 54, 32],
'Place': ['Delhi', 'Kochi', 'Pune', 'Patna']
}
df = DataFrame(Data, columns = ['Name', 'ID', 'Place'])
# Print original data frame
print("Original data frame:n")
display(df)
# Selecting the product of Electronic Type
select_prod = df.loc[df['Name'] == 'Mohe']
print("n")
# Print selected rows based on the condition
print("Selecting rows:n")
display (select_prod)](https://image.slidesharecdn.com/seriesanddataframes-250314064642-08a57a77/85/introduction-to-data-structures-in-pandas-36-320.jpg)
![Example for selecting column
# Importing pandas as pd
from pandas import DataFrame
# Creating a data frame
Data = {'Name': ['Mohe', 'Shyni', 'Parul', 'Sam'],
'ID': [12, 43, 54, 32],
'Place': ['Delhi', 'Kochi', 'Pune', 'Patna']
}
df = DataFrame(Data, columns = ['Name', 'ID', 'Place'])
# Print original data frame
print("Original data frame:")
display(df)
print("Selected column: ")
display(df[['Name', 'ID']] )](https://image.slidesharecdn.com/seriesanddataframes-250314064642-08a57a77/85/introduction-to-data-structures-in-pandas-37-320.jpg)
![Add a New Column
Let’s create a DataFrame object to begin.
Method 1:
import pandas as pd
df = pd.DataFrame({'price': [3, 89, 45, 6], 'amount': [57, 42, 70, 43]})
df['total'] = df['price'] * df['amount']](https://image.slidesharecdn.com/seriesanddataframes-250314064642-08a57a77/85/introduction-to-data-structures-in-pandas-38-320.jpg)
![Method 2
If you want to specify where your new column should be inserted in the DataFrame, you can use
the DataFrame.insert() method. The insert method has four parameters:
insert(loc, new column name, value, allow_duplications)
● loc: the column insertion index
● column: new column label
● value: desired row data
● allow_duplications: (optional) will not create a new column if a column with the same label
already exists
We can insert our new 'total' column at index 0 in our DataFrame object using the following code.
df.insert(0, 'total', df['price']*df['amount'], False)](https://image.slidesharecdn.com/seriesanddataframes-250314064642-08a57a77/85/introduction-to-data-structures-in-pandas-39-320.jpg)
![Delete a Column
● The best way to delete Dataframe columns in Pandas is with the DataFrame.drop() method.
● The drop method is very flexible and can be used to drop specific rows or columns.
● It can also drop multiple columns at a time by either the column’s index or the column’s name.
● labels: index or column labels to drop
● axis: whether to drop labels from the index (0 or 'index') or columns (1 or 'columns')
● inplace: if True, complete the operation inplace and return None (data frame has to make
changes permanent)
df.drop('total', 1, inplace=True)
df.drop(df.columns[[1, 2]], 1, inplace=True)](https://image.slidesharecdn.com/seriesanddataframes-250314064642-08a57a77/85/introduction-to-data-structures-in-pandas-40-320.jpg)

![import pandas as pd
dataSet1 = [(10, 20, 30),
(40, 50, 60),
(70, 80, 90)]
dataFrame1 = pd.DataFrame(data=dataSet1)
dataSet2 = [(5, 15, 25),
(35, 45, 55),
(65, 75, 85)]
dataFrame2 = pd.DataFrame(data=dataSet2)
print("DataFrame1:")
print(dataFrame1)
print("DataFrame2:")
print(dataFrame2)
result = dataFrame1.add(dataFrame2)
print("Result of adding two pandas dataframes:")
print(result)](https://image.slidesharecdn.com/seriesanddataframes-250314064642-08a57a77/85/introduction-to-data-structures-in-pandas-44-320.jpg)
![import pandas as pd
# Create Data
data1 = [(2, 4, 6, 8),
(1, 3, 5, 7),
(5, 0, 0, 9)]
data2 = [(1, 1, 0 , 1),
(1, 0, 1 , 1),
(0, 1, 1 , 0)]
# Construct DataFrame1
dataFrame1 = pd.DataFrame(data=data1)
print("DataFrame1:")
print(dataFrame1)
# Construct DataFrame2
dataFrame2 = pd.DataFrame(data=data2)
print("DataFrame2:")
print(dataFrame2)
# Subtracting DataFrame2 from DataFrame1
subtractionResults = dataFrame1 - dataFrame2
print("Result of subtracting dataFrame1 from dataFrame2:")
print(subtractionResults)](https://image.slidesharecdn.com/seriesanddataframes-250314064642-08a57a77/85/introduction-to-data-structures-in-pandas-47-320.jpg)