Introduction&HISTORY:
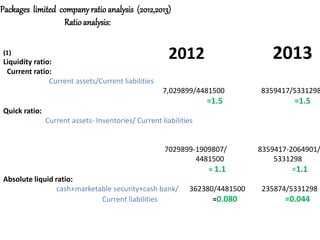
•Packages Limited was established in 1956 as a joint venture between the Ali Group of
Pakistan and Akeund & Rausing of Sweden, to convert paper and paperboard into packaging
for consumer industry
• The capacity has been increased eventually at 110,000 tonnes per year.
• Provides premium packaging solutions for exceptional value to individuals and
businesses.
•Since 1982, Packages Limited has a joint venture with Tetra Pak International in Tetra Pak
Pakistan Limited to manufacture paperboard for liquid food packaging and to market
Tetra Pak packaging equipment.
•In 1996, a joint venture agreement was signed with Printcare (Ceylon) Limited for the
production of flexible packaging materials in Sri Lanka. This project Packages Lanka (Pivate)
Limited commenced production in 1998. Packages Limited now owns 79% of this company
VISION:
Position ourselves to be a regional player of quality packaging and consumer products
AWARD:
December 31, 2010 was awarded third position in its category by the joint committee
of Institute of Chartered Accountants of Pakistan (ICAP
Company won the National Forum for Environment and Health (NFEH) Environment
excellence Award 2011
Shahrah-e-Roomi P.O. Amer-sidhu, Lahore-54760, Pakistan
Tel: + 92 42 35811541-6, 35811191-4
Fax: + 92 42 35811195, 35820147
For Customer Queries: buy@packages.com.pk
For Vendor Queries : sales@packages.com.pk
For Human Resource : hrd@packages.com.pk
For General Info : info@packages.com.pk
For Blow Your Whistle : blowyourwhistle@packages.com.pk
OFFICES & OPERATIONS HEAD OFFICE & WORKS
PAPER & BOARD
STATIONARY
CARTON BUSINESS UNIT
UNIT FLEXIBLE
BUSINESS UNIT
CONSUMER PRODUCTS
Manpower Less Than 10 Years Service 1,358
Between 11 And 20 Years 582
Between 21 And 30 Years 512
Above 30 Years 439
Executive And Management Staff 506
Supervisors 246
Workers 2,139
TOTAL 2,891
Corporate strcture:
Packages Limited has two main manufacturing divisions:
1. The Packaging Division, provides multi-dimensional and multi product packaging solutions
to clients that are involved in manufacturing consumer product across industries.
2. The Consumer Products Division, which manufactures off-the-shelf branded
consumer products
Boardof Directors
1. Mr. Towfiq Habib Chinoy
2. Mr. Khalid Yacob
3. Mr. Shamim Ahmad Khan
4. Mr. Mats Nordlander
5. Mr. Alamuddin Bullo
6. Mr. Tariq Iqbal Khan
7. Mr. Muhammad Aurangzeb
8. Syed Shahid Ali
9. Syed Hyder Ali
10. Syed Aslam Mehdi
Packages limited companyratio analysis (2012,2013)
Ratioanalysis:
(1)
Liquidity ratio:
Current ratio:
Current assets/Current liabilities
7,029899/4481500 8359417/5331298
=1.5 =1.5
Quick ratio:
Current assets- Inventories/ Current liabilities
7029899-1909807/ 8359417-2064901/
4481500 5331298
= 1.1 =1.1
Absolute liquid ratio:
cash+marketable security+cash bank/ 362380/4481500 235874/5331298
Current liabilities =0.080 =0.044
2012 2013
2)
Asset management ratio:
Inventory turnover:
Sales/Inventories
11,745290/1909807 14887857/2064901
=6.1times =7.2times
Days sales outstanding:
Receviable/annual sales/365
2279915/11745,2901/ 1622809/14887857/
365 365
=70.8times =39.7times
Fixed assets turnover:
Sales/net fixed assets
11745290/24418764 14887857/44909885
=0.4 times =0.3times
Total assets turnover:
Sales /total assets
11745290/45991954 14887857/53,269302
=0.25 times =0.27times
Payable deffered period :
Payables/cost of good sold/365
1977498/10270143/ 3052362/12892590/
365 365
=70.2 days =86.4 days
Inventory conversion period:
Inventory/cost of good Sold per day
2371432/10270143/ 2633494/12892590/
365 365
=84.2 days =74.55days
Working capital turnover ratio:
Cost of good sold/average Net working capital
10270143/2548399 12892590/3028119
= 4.0 time 4.2 times
(3)
Debt management ratio:
Total debt to total assets:
total debt/total assets
2279.915/45991954 1622809/53269,302
=0.04% = 0.03%
2012 2013
Time interest earned:
EBIT/interest charges
1010928/528371 996571/845253
=1.91 = 1.17
( 4)
Profitability ratio:
Operating margin:
EBIT/SALES
1010928/11745290 996571/14887857
=0.086 =0.06
Profit margin:
Net income/sales
1488082/11745290 1795812/14887857
= 0.126 =0.120
Return on total assets:
Net income/total assets
1488082/45991954 1795812/53269302
=0.032 =0.033
2012 2013
Gross profit margin:
gross profit/ Net sales *100
1475147/11745290*100 1995267/14887857*100
=12.55% =13.4%
Operating profit margin:
operating profit /Net sales *100
1488082/11745290*100 1795812/14887857*100
=12.6 =12.0
(5)
Efficiency ratio:
Cash turnover:
Net sales/cash
11745290/362380 14887857/235874
=32.4 =63.11
Basic earning power:
EBIT/total assets
1010928/45991954 996571/53269302
=0.021 =0.018
Return on common equity:
Net income/common equity
1488082/1909807 1795812/2064901
=0.77 = 0.86
Comparison ratio:
•Liquidity ratio:
There is no effect of current & quick ratio in 2012,2013. Absolute liquid ratio will be decrease
in 2013.
•Asset Management ratio:
In inventory turnover & total asset turnover working capital ratio will be increase in 2013
as compare to 2012 & Days sales outstanding & fixed asset turnover is decrease in 2013 as compare to 2012.
•Debt Management ratio:
Debt management is decrease in 2013 as compare to 2012.
•Profitability ratio:
Profit made in 2013 is less than 2012.
•Efficiency ratio:
Efficiency ratio is increase year after year
Conclusion:
The company goes day by day. company goes
on the way they may be close if they want to
survive they increase there financial resource
and develop management.
Pakage limited

Pakage limited

  • 2.
    Introduction&HISTORY: •Packages Limited wasestablished in 1956 as a joint venture between the Ali Group of Pakistan and Akeund & Rausing of Sweden, to convert paper and paperboard into packaging for consumer industry • The capacity has been increased eventually at 110,000 tonnes per year. • Provides premium packaging solutions for exceptional value to individuals and businesses.
  • 3.
    •Since 1982, PackagesLimited has a joint venture with Tetra Pak International in Tetra Pak Pakistan Limited to manufacture paperboard for liquid food packaging and to market Tetra Pak packaging equipment. •In 1996, a joint venture agreement was signed with Printcare (Ceylon) Limited for the production of flexible packaging materials in Sri Lanka. This project Packages Lanka (Pivate) Limited commenced production in 1998. Packages Limited now owns 79% of this company VISION: Position ourselves to be a regional player of quality packaging and consumer products AWARD: December 31, 2010 was awarded third position in its category by the joint committee of Institute of Chartered Accountants of Pakistan (ICAP Company won the National Forum for Environment and Health (NFEH) Environment excellence Award 2011
  • 4.
    Shahrah-e-Roomi P.O. Amer-sidhu,Lahore-54760, Pakistan Tel: + 92 42 35811541-6, 35811191-4 Fax: + 92 42 35811195, 35820147 For Customer Queries: buy@packages.com.pk For Vendor Queries : sales@packages.com.pk For Human Resource : hrd@packages.com.pk For General Info : info@packages.com.pk For Blow Your Whistle : blowyourwhistle@packages.com.pk OFFICES & OPERATIONS HEAD OFFICE & WORKS
  • 5.
    PAPER & BOARD STATIONARY CARTONBUSINESS UNIT UNIT FLEXIBLE BUSINESS UNIT CONSUMER PRODUCTS
  • 6.
    Manpower Less Than10 Years Service 1,358 Between 11 And 20 Years 582 Between 21 And 30 Years 512 Above 30 Years 439 Executive And Management Staff 506 Supervisors 246 Workers 2,139 TOTAL 2,891
  • 7.
    Corporate strcture: Packages Limitedhas two main manufacturing divisions: 1. The Packaging Division, provides multi-dimensional and multi product packaging solutions to clients that are involved in manufacturing consumer product across industries. 2. The Consumer Products Division, which manufactures off-the-shelf branded consumer products
  • 8.
    Boardof Directors 1. Mr.Towfiq Habib Chinoy 2. Mr. Khalid Yacob 3. Mr. Shamim Ahmad Khan 4. Mr. Mats Nordlander 5. Mr. Alamuddin Bullo 6. Mr. Tariq Iqbal Khan 7. Mr. Muhammad Aurangzeb 8. Syed Shahid Ali 9. Syed Hyder Ali 10. Syed Aslam Mehdi
  • 9.
    Packages limited companyratioanalysis (2012,2013) Ratioanalysis: (1) Liquidity ratio: Current ratio: Current assets/Current liabilities 7,029899/4481500 8359417/5331298 =1.5 =1.5 Quick ratio: Current assets- Inventories/ Current liabilities 7029899-1909807/ 8359417-2064901/ 4481500 5331298 = 1.1 =1.1 Absolute liquid ratio: cash+marketable security+cash bank/ 362380/4481500 235874/5331298 Current liabilities =0.080 =0.044 2012 2013
  • 10.
    2) Asset management ratio: Inventoryturnover: Sales/Inventories 11,745290/1909807 14887857/2064901 =6.1times =7.2times Days sales outstanding: Receviable/annual sales/365 2279915/11745,2901/ 1622809/14887857/ 365 365 =70.8times =39.7times
  • 11.
    Fixed assets turnover: Sales/netfixed assets 11745290/24418764 14887857/44909885 =0.4 times =0.3times Total assets turnover: Sales /total assets 11745290/45991954 14887857/53,269302 =0.25 times =0.27times Payable deffered period : Payables/cost of good sold/365 1977498/10270143/ 3052362/12892590/ 365 365 =70.2 days =86.4 days Inventory conversion period: Inventory/cost of good Sold per day 2371432/10270143/ 2633494/12892590/ 365 365 =84.2 days =74.55days
  • 12.
    Working capital turnoverratio: Cost of good sold/average Net working capital 10270143/2548399 12892590/3028119 = 4.0 time 4.2 times (3) Debt management ratio: Total debt to total assets: total debt/total assets 2279.915/45991954 1622809/53269,302 =0.04% = 0.03% 2012 2013
  • 13.
    Time interest earned: EBIT/interestcharges 1010928/528371 996571/845253 =1.91 = 1.17 ( 4) Profitability ratio: Operating margin: EBIT/SALES 1010928/11745290 996571/14887857 =0.086 =0.06 Profit margin: Net income/sales 1488082/11745290 1795812/14887857 = 0.126 =0.120 Return on total assets: Net income/total assets 1488082/45991954 1795812/53269302 =0.032 =0.033 2012 2013
  • 14.
    Gross profit margin: grossprofit/ Net sales *100 1475147/11745290*100 1995267/14887857*100 =12.55% =13.4% Operating profit margin: operating profit /Net sales *100 1488082/11745290*100 1795812/14887857*100 =12.6 =12.0 (5) Efficiency ratio: Cash turnover: Net sales/cash 11745290/362380 14887857/235874 =32.4 =63.11 Basic earning power: EBIT/total assets 1010928/45991954 996571/53269302 =0.021 =0.018 Return on common equity: Net income/common equity 1488082/1909807 1795812/2064901 =0.77 = 0.86
  • 15.
    Comparison ratio: •Liquidity ratio: Thereis no effect of current & quick ratio in 2012,2013. Absolute liquid ratio will be decrease in 2013. •Asset Management ratio: In inventory turnover & total asset turnover working capital ratio will be increase in 2013 as compare to 2012 & Days sales outstanding & fixed asset turnover is decrease in 2013 as compare to 2012. •Debt Management ratio: Debt management is decrease in 2013 as compare to 2012. •Profitability ratio: Profit made in 2013 is less than 2012. •Efficiency ratio: Efficiency ratio is increase year after year Conclusion: The company goes day by day. company goes on the way they may be close if they want to survive they increase there financial resource and develop management.