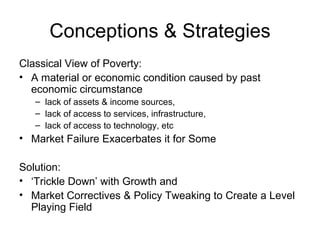
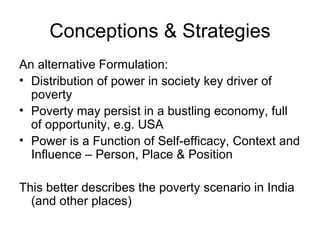
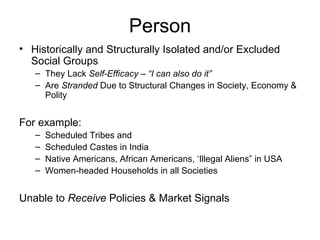
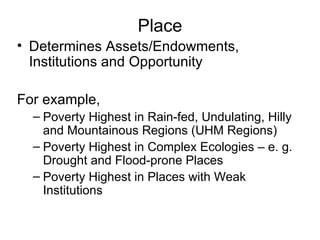
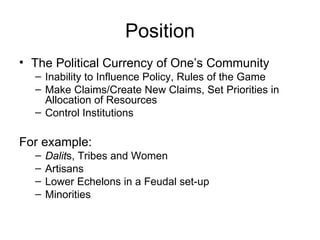
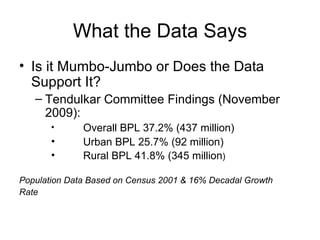
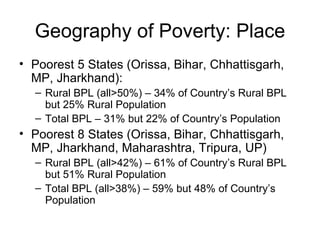
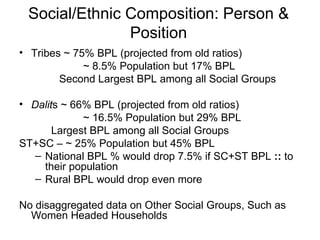
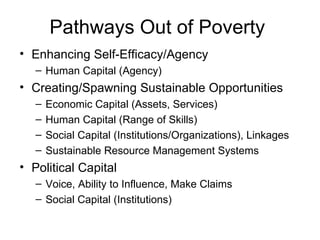
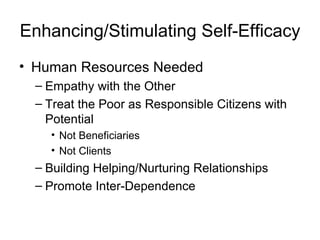
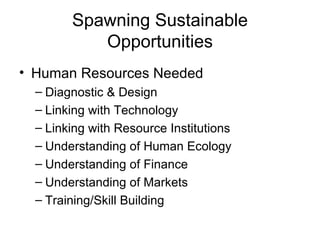
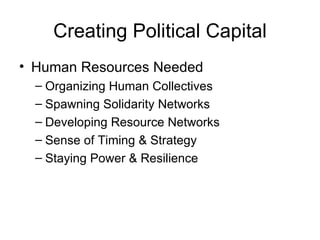
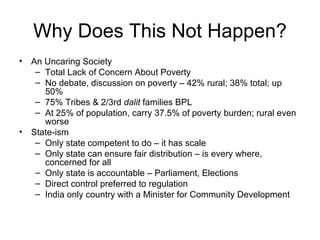
Removing Poverty: Role of HR & POs Deep Joshi 29 January 2010
Conceptions & Strategies Classical View of Poverty: A material or economic condition caused by past economic circumstance  lack of assets & income sources, lack of access to services, infrastructure, lack of access to technology, etc Market Failure Exacerbates it for Some Solution: ‘ Trickle Down’ with Growth and  Market Correctives & Policy Tweaking to Create a Level Playing Field
Conceptions & Strategies An alternative Formulation: Distribution of power in society key driver of poverty Poverty may persist in a bustling economy, full of opportunity, e.g. USA Power is a Function of Self-efficacy, Context and Influence – Person, Place & Position This better describes the poverty scenario in India (and other places)
Person Historically and Structurally Isolated and/or Excluded Social Groups They Lack  Self-Efficacy – “I can also do it” Are  Stranded  Due to Structural Changes in Society, Economy & Polity For example: Scheduled Tribes and Scheduled Castes in India Native Americans, African Americans, ‘Illegal Aliens” in USA Women-headed Households in all Societies Unable to  Receive  Policies & Market Signals
Place Determines Assets/Endowments, Institutions and Opportunity For example, Poverty Highest in Rain-fed, Undulating, Hilly and Mountainous Regions (UHM Regions) Poverty Highest in Complex Ecologies – e. g. Drought and Flood-prone Places Poverty Highest in Places with Weak Institutions
Position The Political Currency of One’s Community Inability to Influence Policy, Rules of the Game Make Claims/Create New Claims, Set Priorities in Allocation of Resources Control Institutions For example: Dalit s, Tribes and Women Artisans Lower Echelons in a Feudal set-up Minorities
What the Data Says Is it Mumbo-Jumbo or Does the Data Support It? Tendulkar Committee Findings (November 2009): Overall BPL 37.2% (437 million) Urban BPL 25.7% (92 million) Rural BPL 41.8% (345 million ) Population Data Based on Census 2001 & 16% Decadal Growth Rate
Geography of Poverty: Place Poorest 5 States (Orissa, Bihar, Chhattisgarh, MP, Jharkhand): Rural BPL (all>50%) – 34% of Country’s Rural BPL but 25% Rural Population Total BPL – 31% but 22% of Country’s Population Poorest 8 States (Orissa, Bihar, Chhattisgarh, MP, Jharkhand, Maharashtra, Tripura, UP) Rural BPL (all>42%) – 61% of Country’s Rural BPL but 51% Rural Population Total BPL (all>38%) – 59% but 48% of Country’s Population
Social/Ethnic Composition: Person & Position Tribes ~ 75% BPL (projected from old ratios)   ~ 8.5% Population but 17% BPL Second Largest BPL among all Social Groups Dalit s ~ 66% BPL (projected from old ratios) ~ 16.5% Population but 29% BPL Largest BPL among all Social Groups ST+SC – ~ 25% Population but 45% BPL National BPL % would drop 7.5% if SC+ST BPL  ::  to their population Rural BPL would drop even more No disaggregated data on Other Social Groups, Such as Women Headed Households
The Poor are also Heterogeneous  Declining Poor Consumption deficits ‘ Stranded’ due to structural changes No Assets Accumulate social and economic deficits Without hope Behaviour and Practices Unsustainable in the Market Coping Poor Subsist but stagnant Locked in unsustainable production systems Limited and Fragile Asset Base Low self-confidence Dynamic Poor Can take risks Lack Access Classical Victims of Market Failure Therefore, Strategies Need to be Tailored to the Context
Journey Out of Poverty Access to entitlements Confidence – building (public goods) Extreme poor Most vulnerable Least resilient Least able to take risk Less vulnerable More resilient More able to take risk Assets, skills, access to entitlements (private and  public goods) Coping poor BDS, access to market Financial services (private goods) Improving poor Range of Strategies
Segmented Strategies to Remove Poverty
Pathways Out of Poverty  Enhancing Self-Efficacy/Agency Human Capital (Agency) Creating/Spawning Sustainable Opportunities Economic Capital (Assets, Services) Human Capital (Range of Skills) Social Capital (Institutions/Organizations), Linkages Sustainable Resource Management Systems Political Capital Voice, Ability to Influence, Make Claims Social Capital (Institutions)
Enhancing/Stimulating Self-Efficacy Human Resources Needed Empathy with the Other Treat the Poor as Responsible Citizens with Potential Not Beneficiaries Not Clients Building Helping/Nurturing Relationships Promote Inter-Dependence
Spawning Sustainable Opportunities Human Resources Needed Diagnostic & Design Linking with Technology Linking with Resource Institutions Understanding of Human Ecology Understanding of Finance Understanding of Markets Training/Skill Building
Creating Political Capital Human Resources Needed Organizing Human Collectives Spawning Solidarity Networks Developing Resource Networks Sense of Timing & Strategy Staying Power & Resilience
Role of People’s Organisations Enhancing Self-efficacy Learning from and with Peers Assurance from Others Scale Economies For Sharing Services For Dealing with the Market Political Capital Claiming & Creating Entitlements Constructive Collectives & Commons Work Against Tragedy of the Commons
Why Does This Not Happen? An Uncaring Society Total Lack of Concern About Poverty No debate, discussion on poverty – 42% rural; 38% total; up 50% 75% Tribes & 2/3rd  dalit  families BPL At 25% of population, carry 37.5% of poverty burden; rural even worse State-ism Only state competent to do – it has scale Only state can ensure fair distribution – is every where, concerned for all Only state is accountable – Parliament, Elections Direct control preferred to regulation India only country with a Minister for Community Development
Why …? No Appreciation of the Complexity of Rural Development Treated as an intellectually inferiors activity Only a ‘holding operation’ till every one joins the urban industrial economy For instance, no RD institute comparable to IITs, IIMs. No Rational Conception of the India of Future Nature of Indian Society – Urban vs. Rural Income Distribution Conception of ‘good life’ Conception of Human Development
Thank You

Padmashri Deep Joshi Seminar at IFMR

  • 1.
    Removing Poverty: Roleof HR & POs Deep Joshi 29 January 2010
  • 2.
    Conceptions & StrategiesClassical View of Poverty: A material or economic condition caused by past economic circumstance lack of assets & income sources, lack of access to services, infrastructure, lack of access to technology, etc Market Failure Exacerbates it for Some Solution: ‘ Trickle Down’ with Growth and Market Correctives & Policy Tweaking to Create a Level Playing Field
  • 3.
    Conceptions & StrategiesAn alternative Formulation: Distribution of power in society key driver of poverty Poverty may persist in a bustling economy, full of opportunity, e.g. USA Power is a Function of Self-efficacy, Context and Influence – Person, Place & Position This better describes the poverty scenario in India (and other places)
  • 4.
    Person Historically andStructurally Isolated and/or Excluded Social Groups They Lack Self-Efficacy – “I can also do it” Are Stranded Due to Structural Changes in Society, Economy & Polity For example: Scheduled Tribes and Scheduled Castes in India Native Americans, African Americans, ‘Illegal Aliens” in USA Women-headed Households in all Societies Unable to Receive Policies & Market Signals
  • 5.
    Place Determines Assets/Endowments,Institutions and Opportunity For example, Poverty Highest in Rain-fed, Undulating, Hilly and Mountainous Regions (UHM Regions) Poverty Highest in Complex Ecologies – e. g. Drought and Flood-prone Places Poverty Highest in Places with Weak Institutions
  • 6.
    Position The PoliticalCurrency of One’s Community Inability to Influence Policy, Rules of the Game Make Claims/Create New Claims, Set Priorities in Allocation of Resources Control Institutions For example: Dalit s, Tribes and Women Artisans Lower Echelons in a Feudal set-up Minorities
  • 7.
    What the DataSays Is it Mumbo-Jumbo or Does the Data Support It? Tendulkar Committee Findings (November 2009): Overall BPL 37.2% (437 million) Urban BPL 25.7% (92 million) Rural BPL 41.8% (345 million ) Population Data Based on Census 2001 & 16% Decadal Growth Rate
  • 8.
    Geography of Poverty:Place Poorest 5 States (Orissa, Bihar, Chhattisgarh, MP, Jharkhand): Rural BPL (all>50%) – 34% of Country’s Rural BPL but 25% Rural Population Total BPL – 31% but 22% of Country’s Population Poorest 8 States (Orissa, Bihar, Chhattisgarh, MP, Jharkhand, Maharashtra, Tripura, UP) Rural BPL (all>42%) – 61% of Country’s Rural BPL but 51% Rural Population Total BPL (all>38%) – 59% but 48% of Country’s Population
  • 9.
    Social/Ethnic Composition: Person& Position Tribes ~ 75% BPL (projected from old ratios) ~ 8.5% Population but 17% BPL Second Largest BPL among all Social Groups Dalit s ~ 66% BPL (projected from old ratios) ~ 16.5% Population but 29% BPL Largest BPL among all Social Groups ST+SC – ~ 25% Population but 45% BPL National BPL % would drop 7.5% if SC+ST BPL :: to their population Rural BPL would drop even more No disaggregated data on Other Social Groups, Such as Women Headed Households
  • 10.
    The Poor arealso Heterogeneous Declining Poor Consumption deficits ‘ Stranded’ due to structural changes No Assets Accumulate social and economic deficits Without hope Behaviour and Practices Unsustainable in the Market Coping Poor Subsist but stagnant Locked in unsustainable production systems Limited and Fragile Asset Base Low self-confidence Dynamic Poor Can take risks Lack Access Classical Victims of Market Failure Therefore, Strategies Need to be Tailored to the Context
  • 11.
    Journey Out ofPoverty Access to entitlements Confidence – building (public goods) Extreme poor Most vulnerable Least resilient Least able to take risk Less vulnerable More resilient More able to take risk Assets, skills, access to entitlements (private and public goods) Coping poor BDS, access to market Financial services (private goods) Improving poor Range of Strategies
  • 12.
  • 13.
    Pathways Out ofPoverty Enhancing Self-Efficacy/Agency Human Capital (Agency) Creating/Spawning Sustainable Opportunities Economic Capital (Assets, Services) Human Capital (Range of Skills) Social Capital (Institutions/Organizations), Linkages Sustainable Resource Management Systems Political Capital Voice, Ability to Influence, Make Claims Social Capital (Institutions)
  • 14.
    Enhancing/Stimulating Self-Efficacy HumanResources Needed Empathy with the Other Treat the Poor as Responsible Citizens with Potential Not Beneficiaries Not Clients Building Helping/Nurturing Relationships Promote Inter-Dependence
  • 15.
    Spawning Sustainable OpportunitiesHuman Resources Needed Diagnostic & Design Linking with Technology Linking with Resource Institutions Understanding of Human Ecology Understanding of Finance Understanding of Markets Training/Skill Building
  • 16.
    Creating Political CapitalHuman Resources Needed Organizing Human Collectives Spawning Solidarity Networks Developing Resource Networks Sense of Timing & Strategy Staying Power & Resilience
  • 17.
    Role of People’sOrganisations Enhancing Self-efficacy Learning from and with Peers Assurance from Others Scale Economies For Sharing Services For Dealing with the Market Political Capital Claiming & Creating Entitlements Constructive Collectives & Commons Work Against Tragedy of the Commons
  • 18.
    Why Does ThisNot Happen? An Uncaring Society Total Lack of Concern About Poverty No debate, discussion on poverty – 42% rural; 38% total; up 50% 75% Tribes & 2/3rd dalit families BPL At 25% of population, carry 37.5% of poverty burden; rural even worse State-ism Only state competent to do – it has scale Only state can ensure fair distribution – is every where, concerned for all Only state is accountable – Parliament, Elections Direct control preferred to regulation India only country with a Minister for Community Development
  • 19.
    Why …? NoAppreciation of the Complexity of Rural Development Treated as an intellectually inferiors activity Only a ‘holding operation’ till every one joins the urban industrial economy For instance, no RD institute comparable to IITs, IIMs. No Rational Conception of the India of Future Nature of Indian Society – Urban vs. Rural Income Distribution Conception of ‘good life’ Conception of Human Development
  • 20.