![million U.S. subscribers. This is more or less the whole landscape of pay TV subscribers.
Hastings also said, at the Morgan Stanley Technology, Media and Telecom Conference,
“Many (cable service providers) would like to have a competitor to HBO, and they
would bid us off of HBO. [For Netflix to become a premium TV network] “…is not in
the short term, but it is the natural direction for us in the long term.” Hastings said,
in a public presentation, that the total estimated market for Netflix was 90 million U.S.
subscribers - meaning Netflix thinks it can be in almost every TV household in the U.S.
He emphasized the importance for Netflix to maintain its brand, but basically opened the door
to a future partnership with pay TV operators that could - similarly to what they currently do
for premium networks such as HBO - bundle Netflix with a pay TV, broadband, or dual play
subscription. Comcast, the leading pay TV operator in the US, said on the record that it
wasn’t interested in such a partnership; Comcast announced its own multi device SVOD
service, Streampix, available for Comcast subscribers only (and therefore not OTT according
to our definition).
8.2
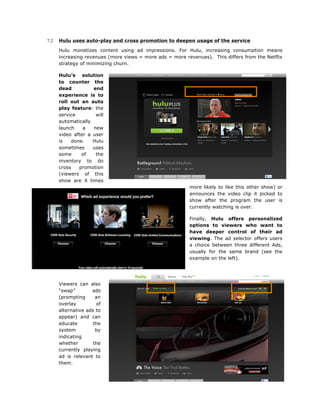
Hulu should be dissolved in the different operators’ catch up TV/free VOD offers - a
$6B opportunity
Hulu, however, is a different animal: a joint venture between three leading broadcast
networks, Hulu was designed to keep control over premium programming (distribution,
quality and online ad revenues) by creating a legal alternative to YouTube. As such, it
succeeded brilliantly. The website has a fifth of the unique viewers YouTube manages to
gather in a month. A Hulu viewer spends 3h10m/month on the site, compared to 7h30m for
the average YouTube viewer. But Hulu ranks as the first online video network in terms of
number of ads served. Thanks to its primetime TV programming, Hulu gets the advertising
dollars of the major marketers. Hulu proved that there was a market for time-shifted ondemand programming. Moreover, it defused the threat of DVR - a key problem for
broadcasters - by satisfying viewers’ appetite for time-shifting, while preventing users from
fast-forwarding through content. It protected the existing business model.
There is no clear long term strategy for Hulu, a joint venture headed by three different
media moguls with diverging views on the terms according to which they should put content
online. Fox wants to reserve the full-week window-of-availability for pay TV subscribers only.
A more logical approach for pay TV operators would be to design a better catch-up TV service
that would mirror Hulu. Comcast is already licensing TV content from the major broadcasters
for day-after airing availability, but these deals are not comprehensive, and are by no means
standard. As insiders in the TV world with deep pockets, pay TV operators could license the
content of their existing partners, and create a comprehensive catch-up VOD offer for their
subscribers. A recent report by research firm The Diffusion Group came to the same
conclusion, adding that pay TV operators had “fumbled a $6B opportunity” by not
working on ad supported VOD.](https://image.slidesharecdn.com/ottvideoreport-131225104902-phpapp01/85/Ott-video-report-15-320.jpg)

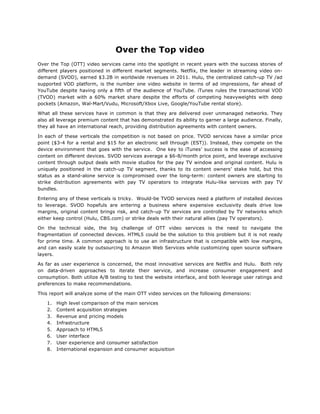
1. The document compares several major OTT video services including Netflix, Amazon Prime, iTunes, Hulu, and YouTube. It discusses their positioning in the market, content catalogs, pricing models, users/usage, revenues, device availability, and international presence. 2. Content acquisition is key for OTT services given the competitive landscape. Transactional VOD services like iTunes and Amazon VOD are welcomed by studios as an additional sales channel. SVOD services must spend heavily on exclusive content through output deals to attract subscribers willing to pay monthly fees. Hulu has an advantage through content owner stakes but faces challenges as owners strike deals with pay TV providers. 3. Technical challenges include navigating the fragmentation of connected devices


