Downloaded 260 times


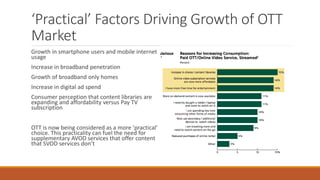


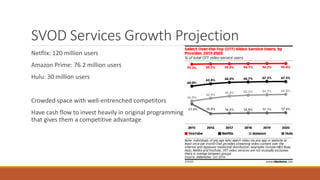

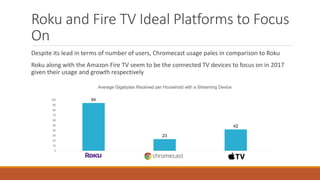

This document analyzes trends in the OTT market. It finds that broadband-only homes are growing and adopting multiple OTT services like Netflix and Hulu. Original content and large libraries are driving growth in SVOD services, while free ad-supported content is fueling the AVOD market. Younger consumers are watching less traditional TV and more content via connected devices like Roku and Fire TV, which are mirroring linear TV viewing patterns. There is an opportunity for an AVOD service that provides premium TV content and a wide library for free.


