Download as PDF, PPTX
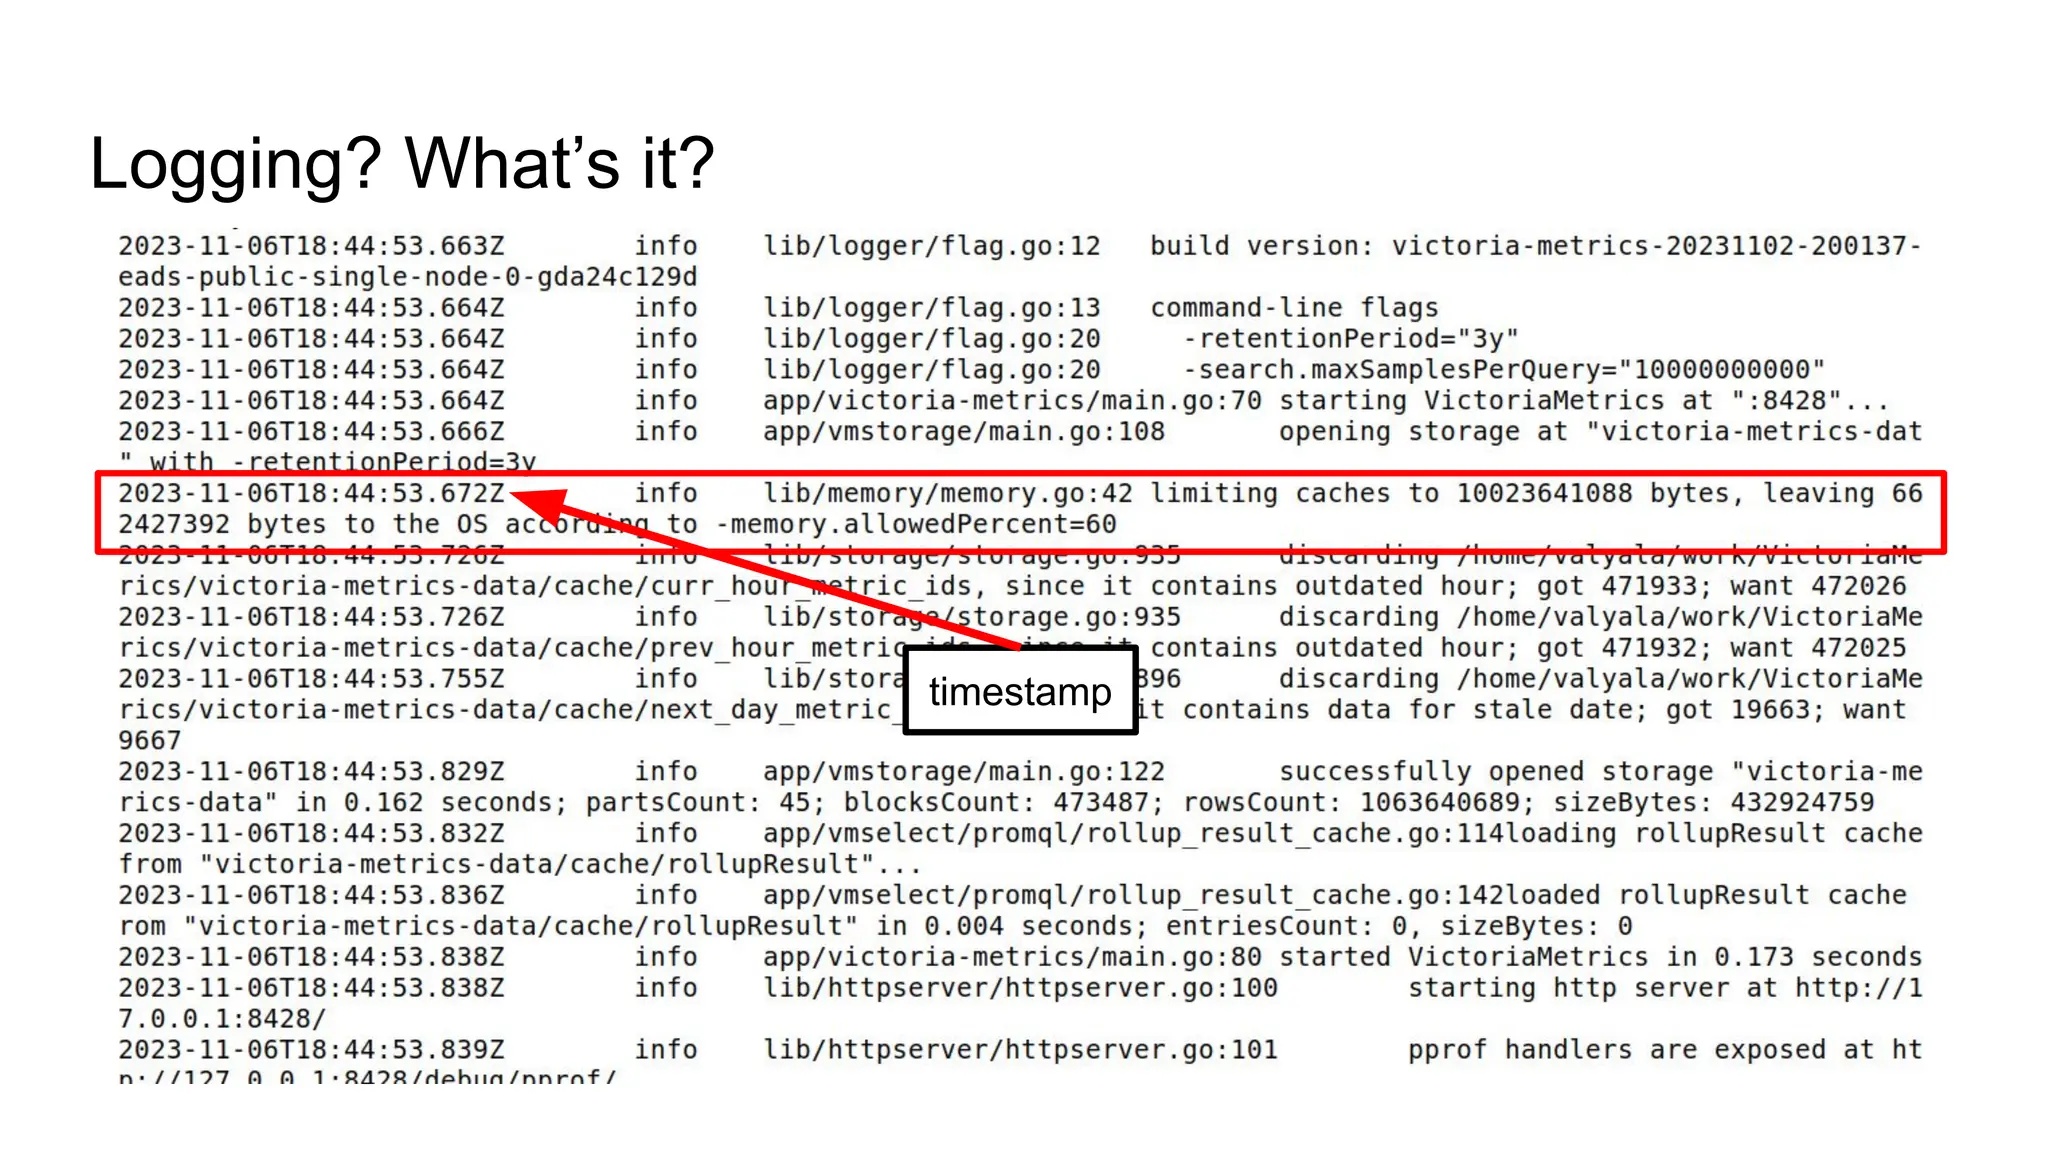


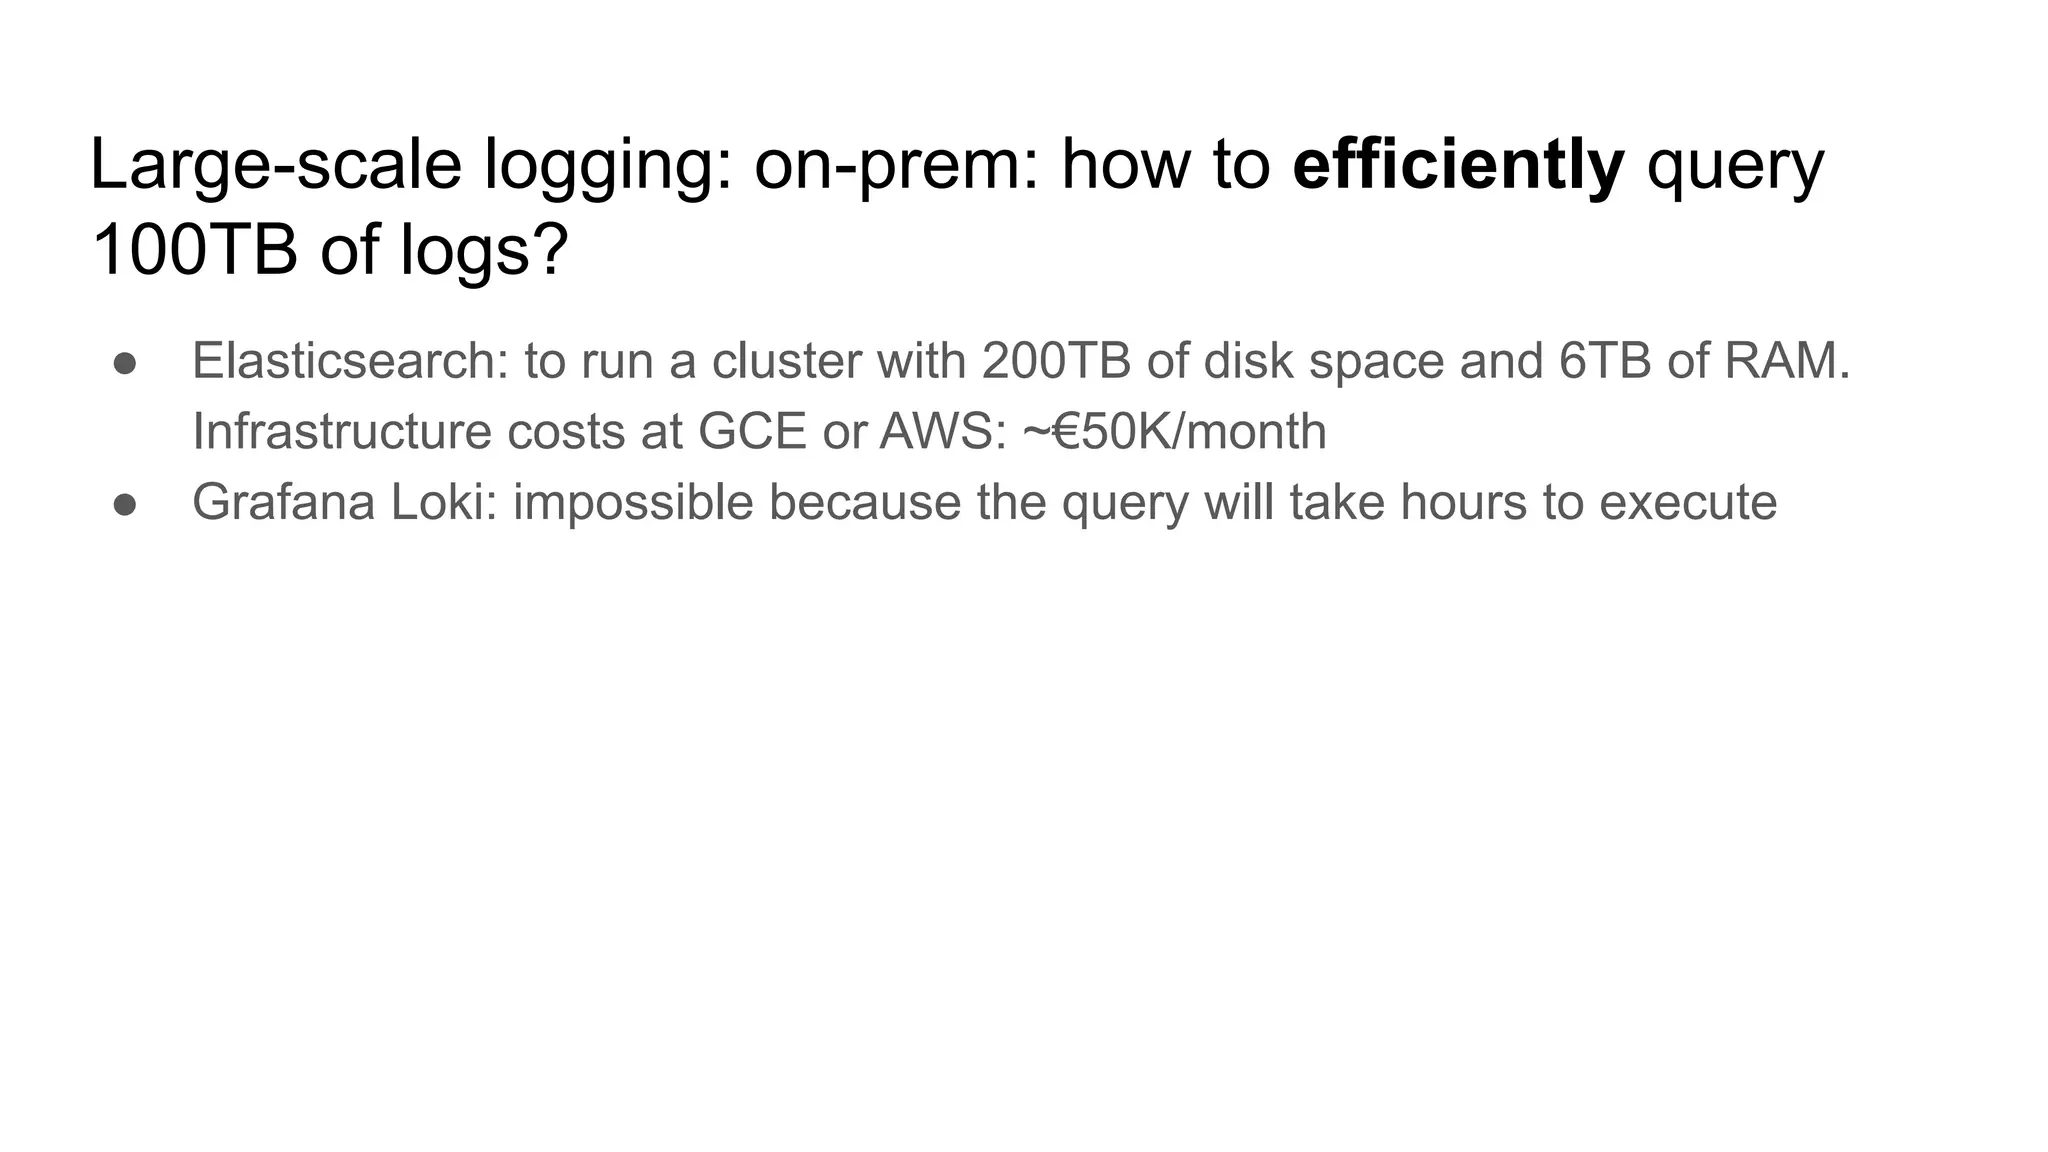
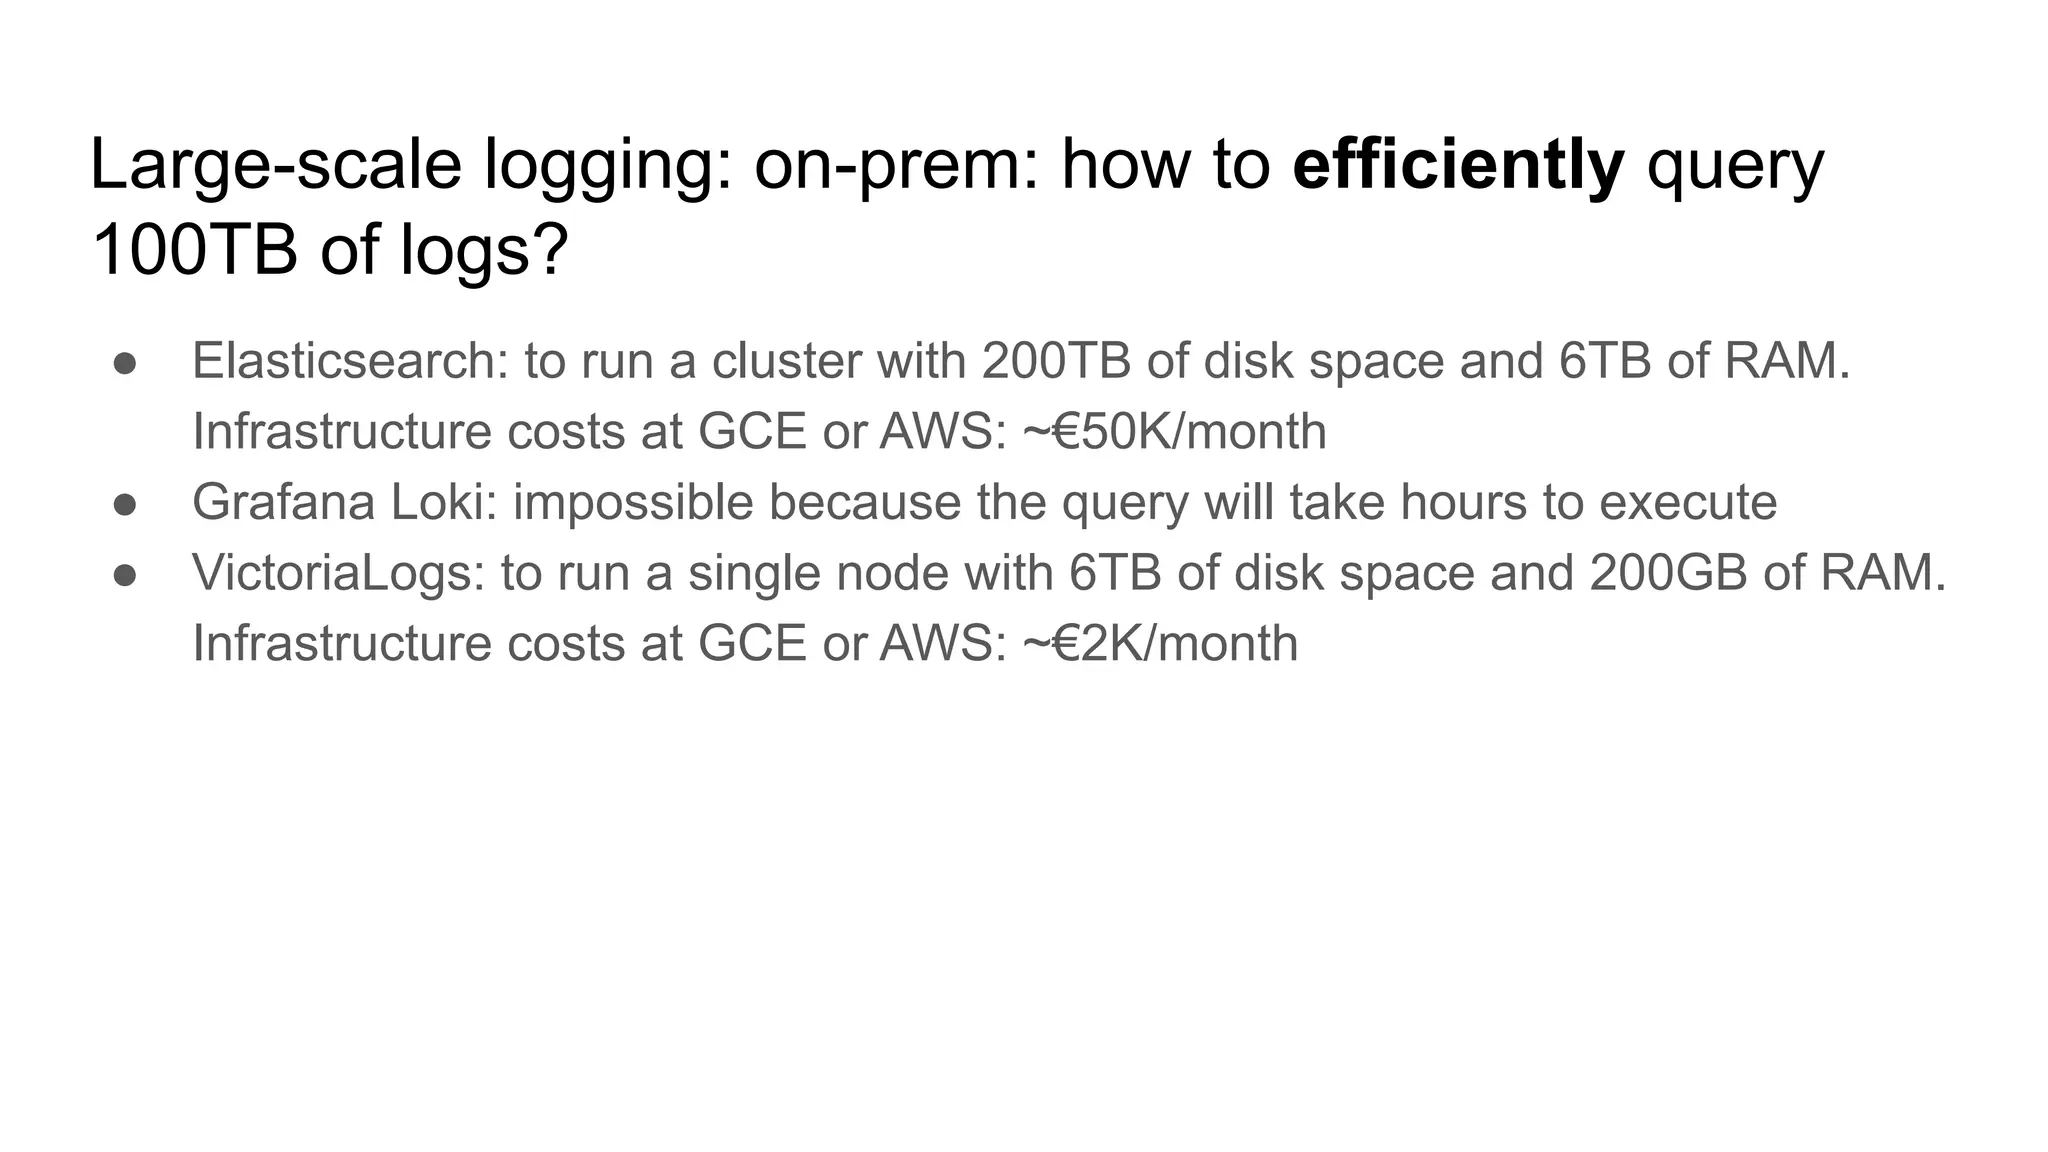
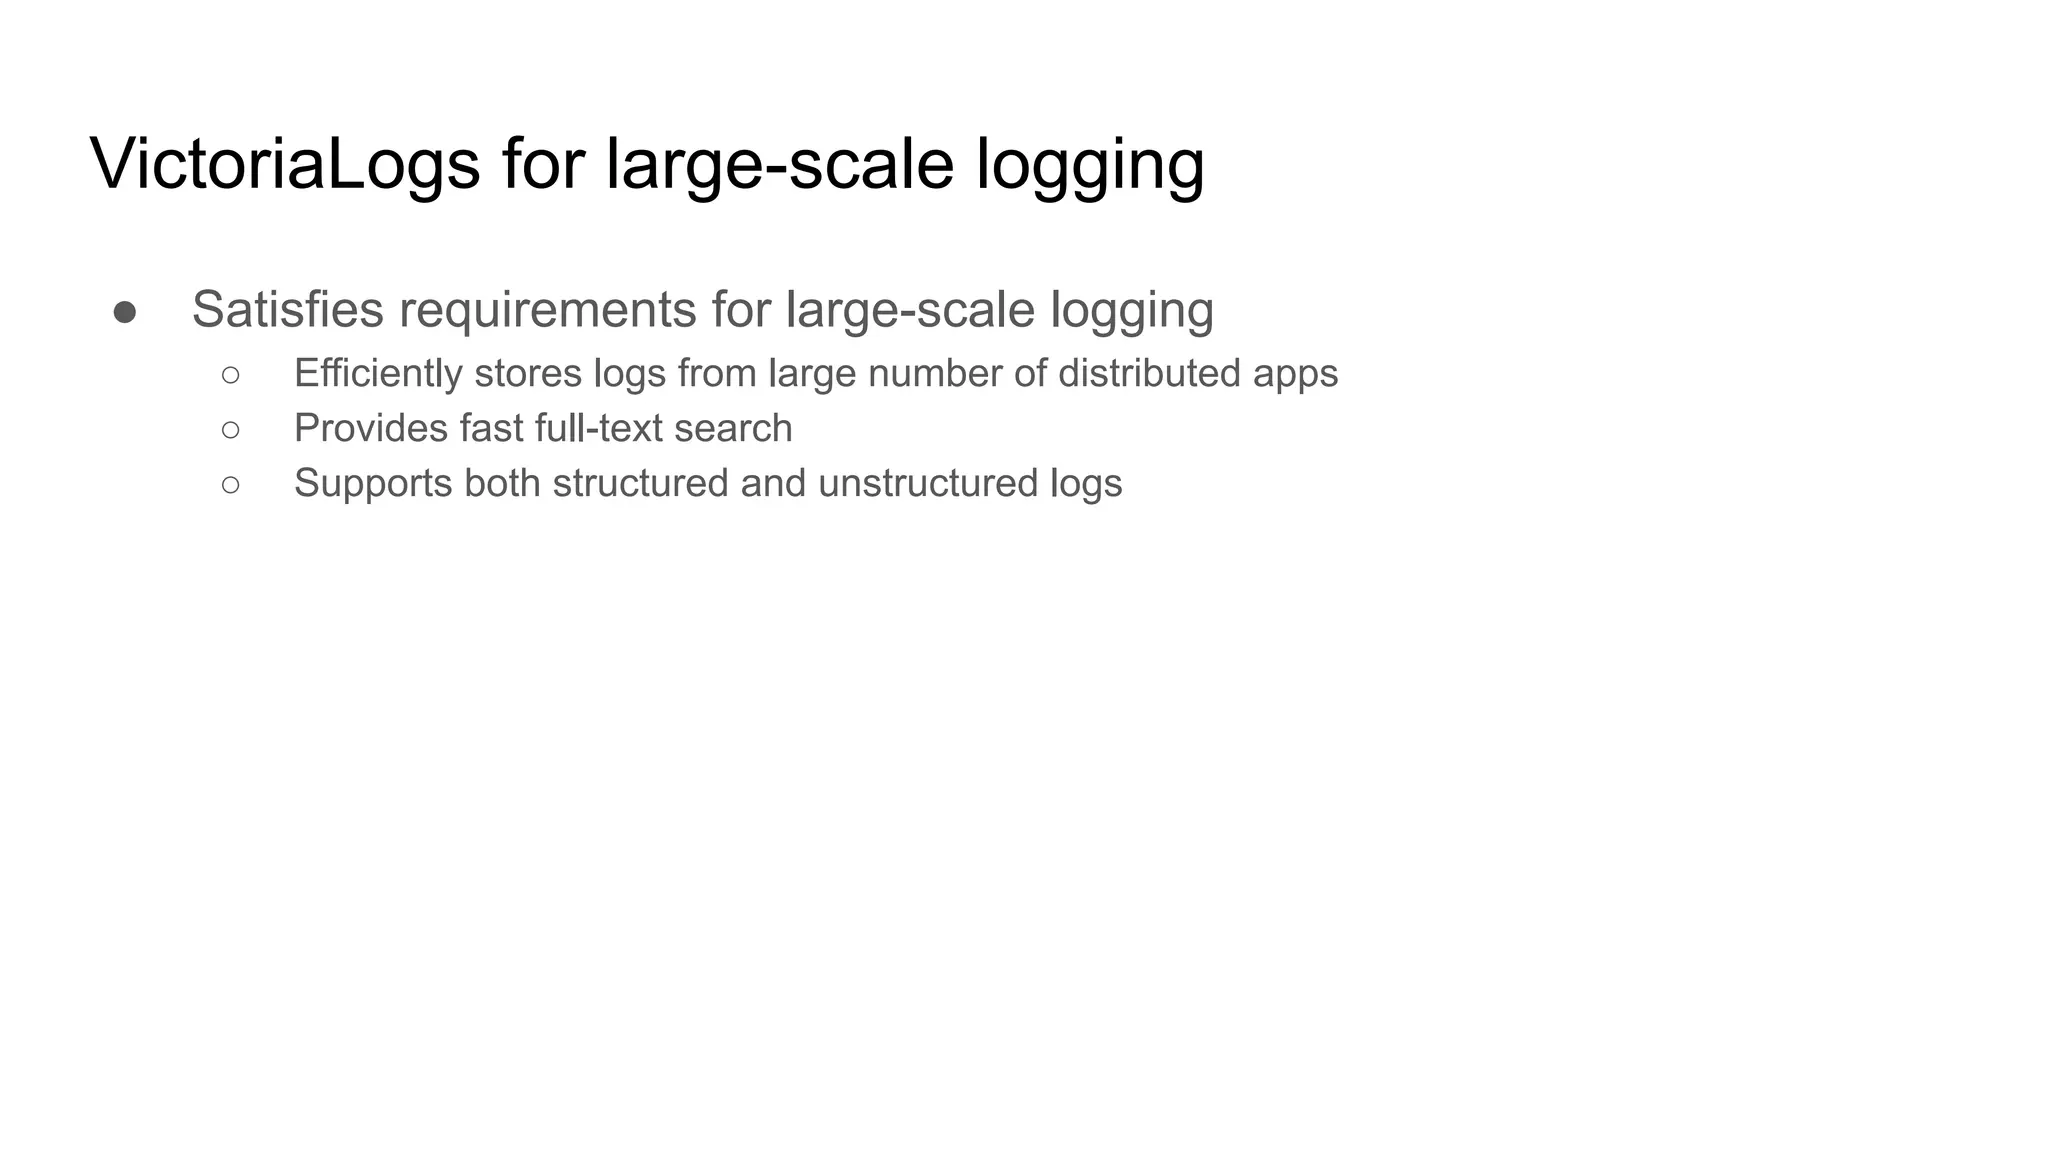
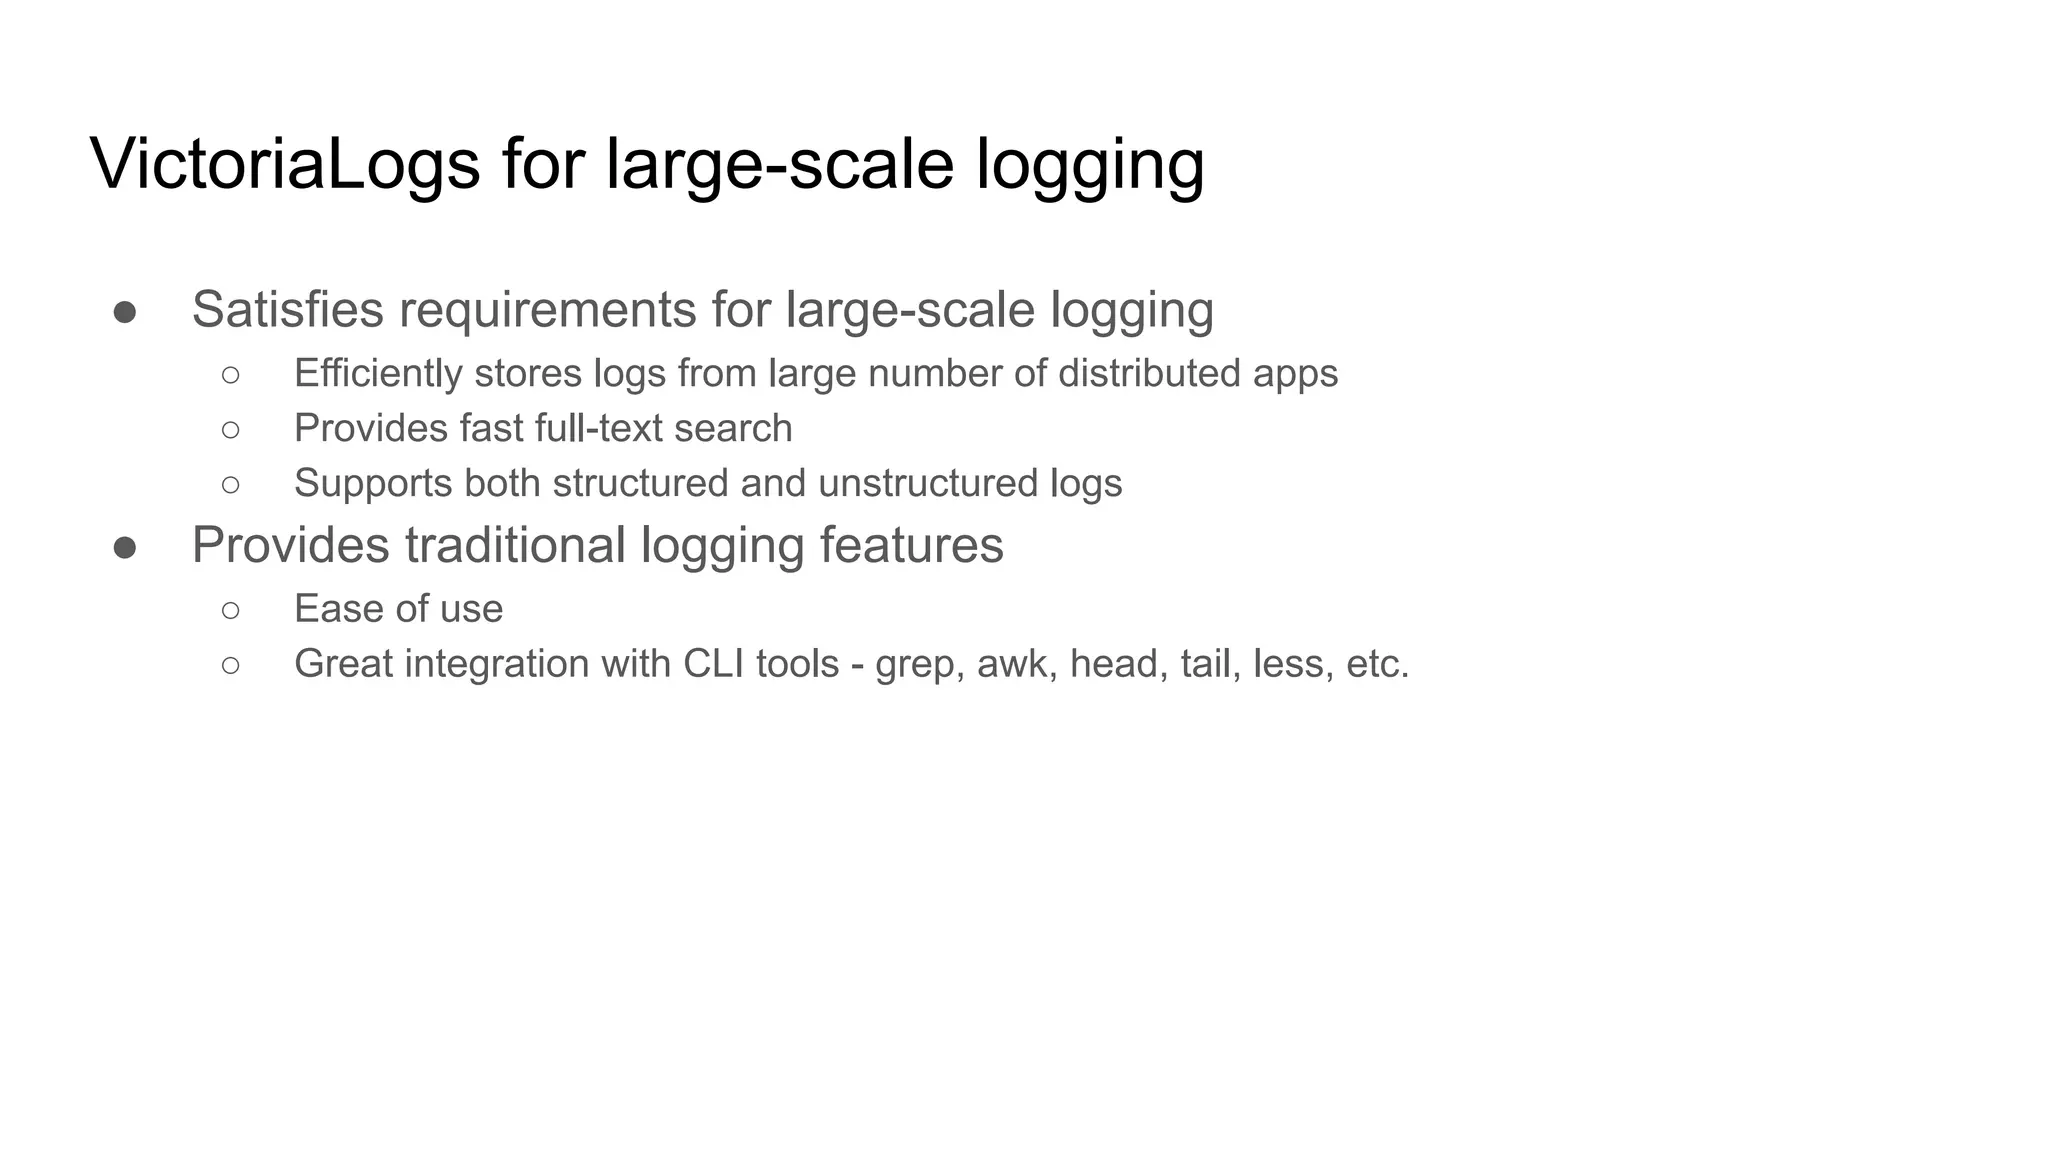
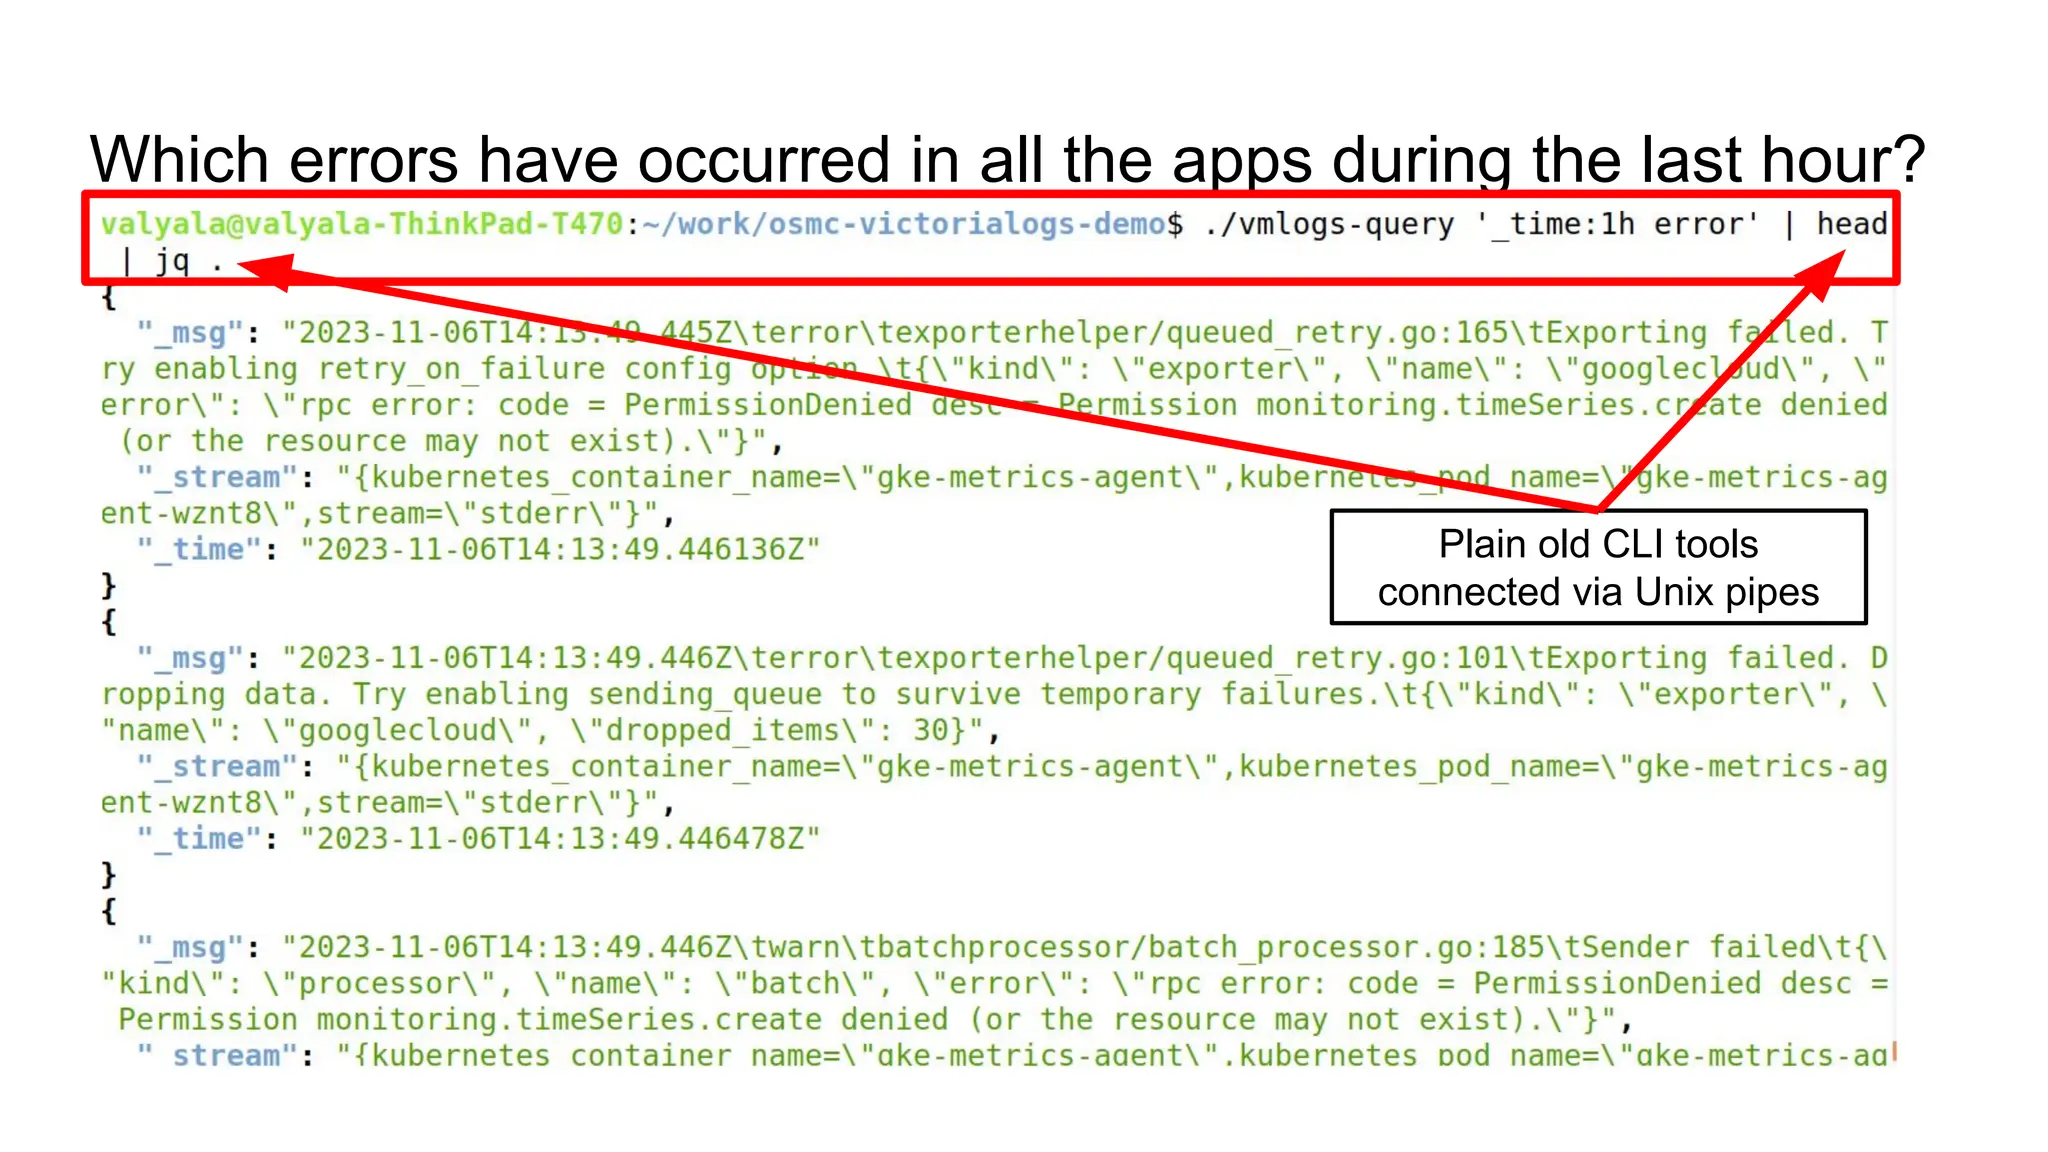
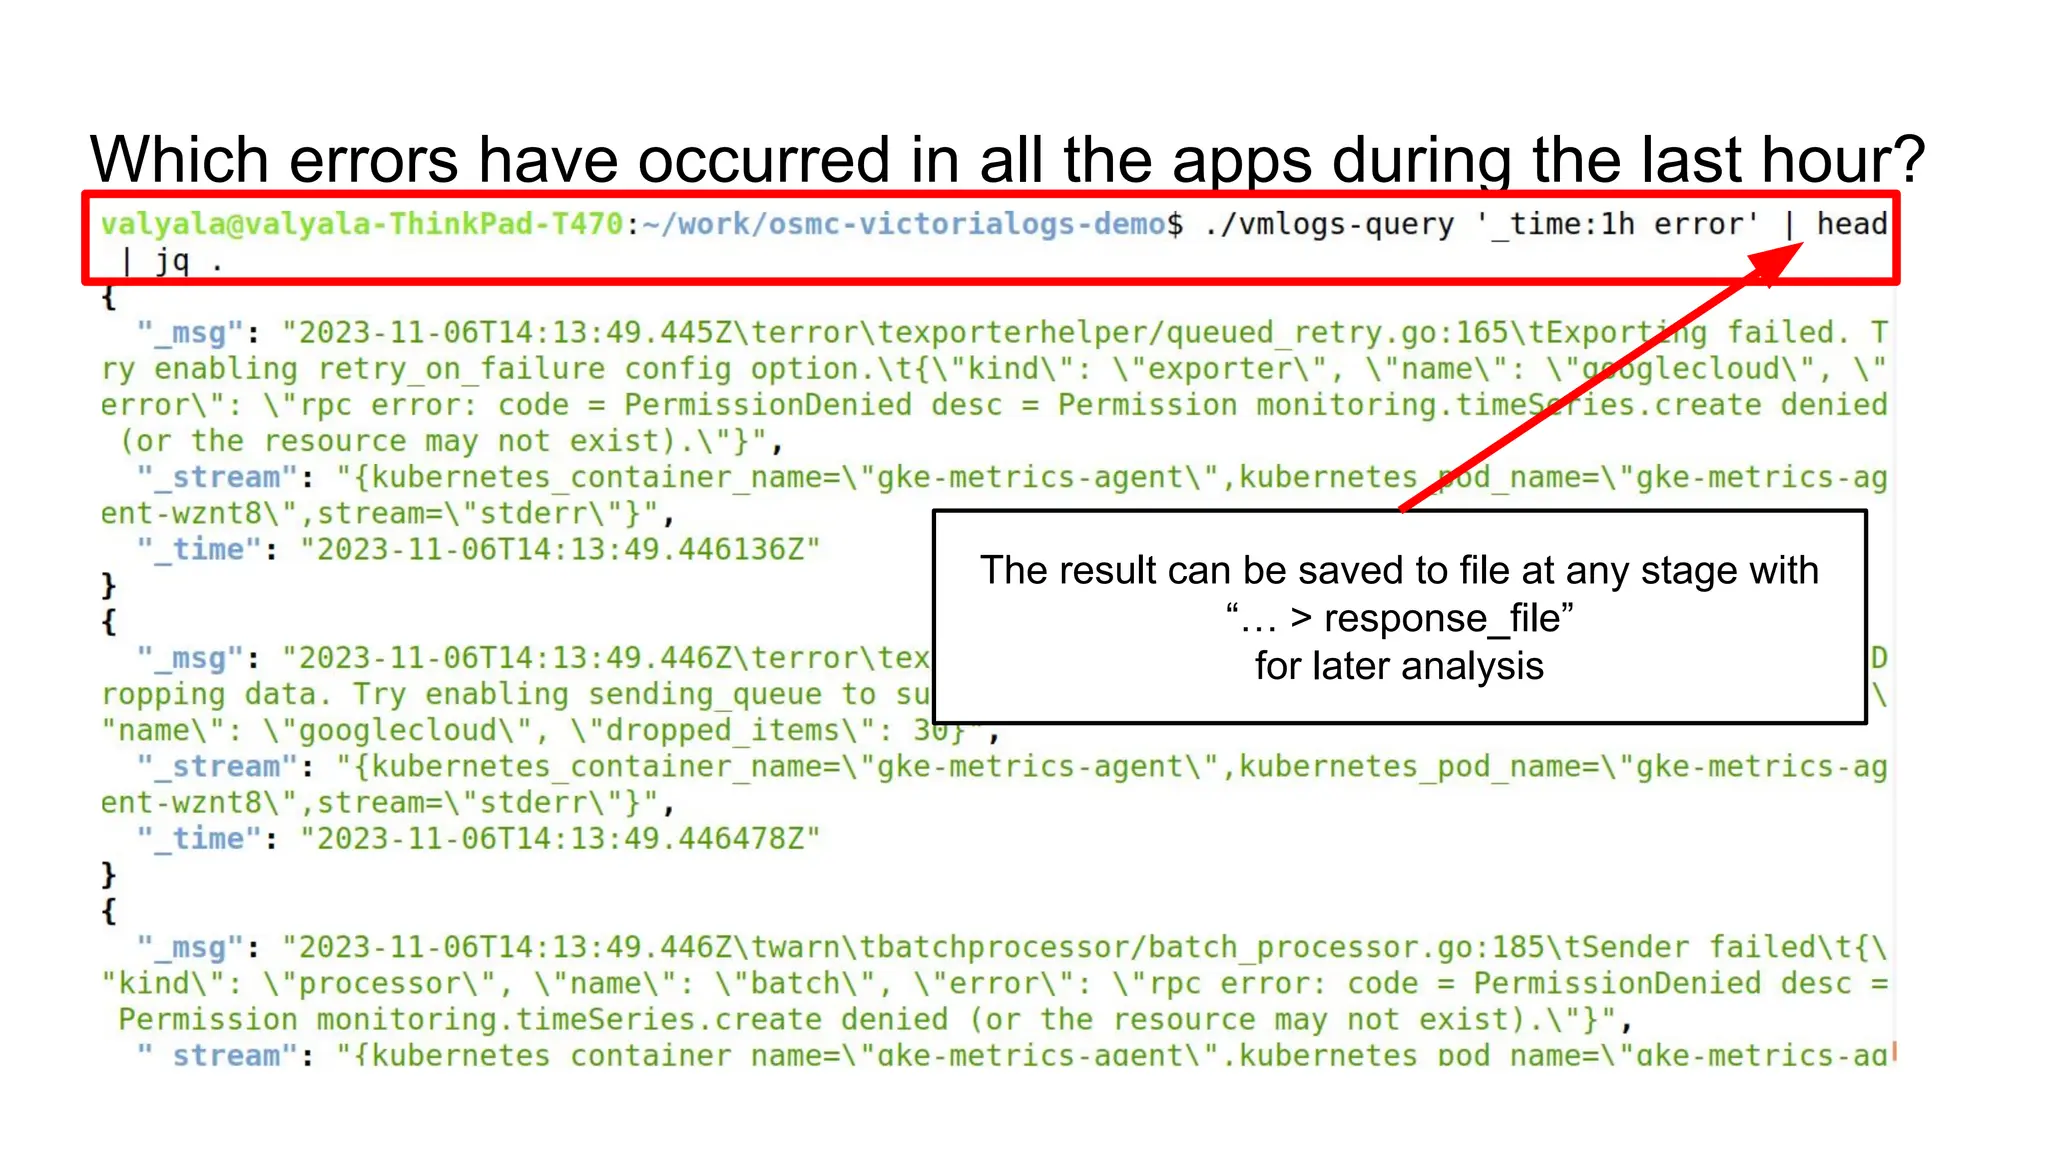
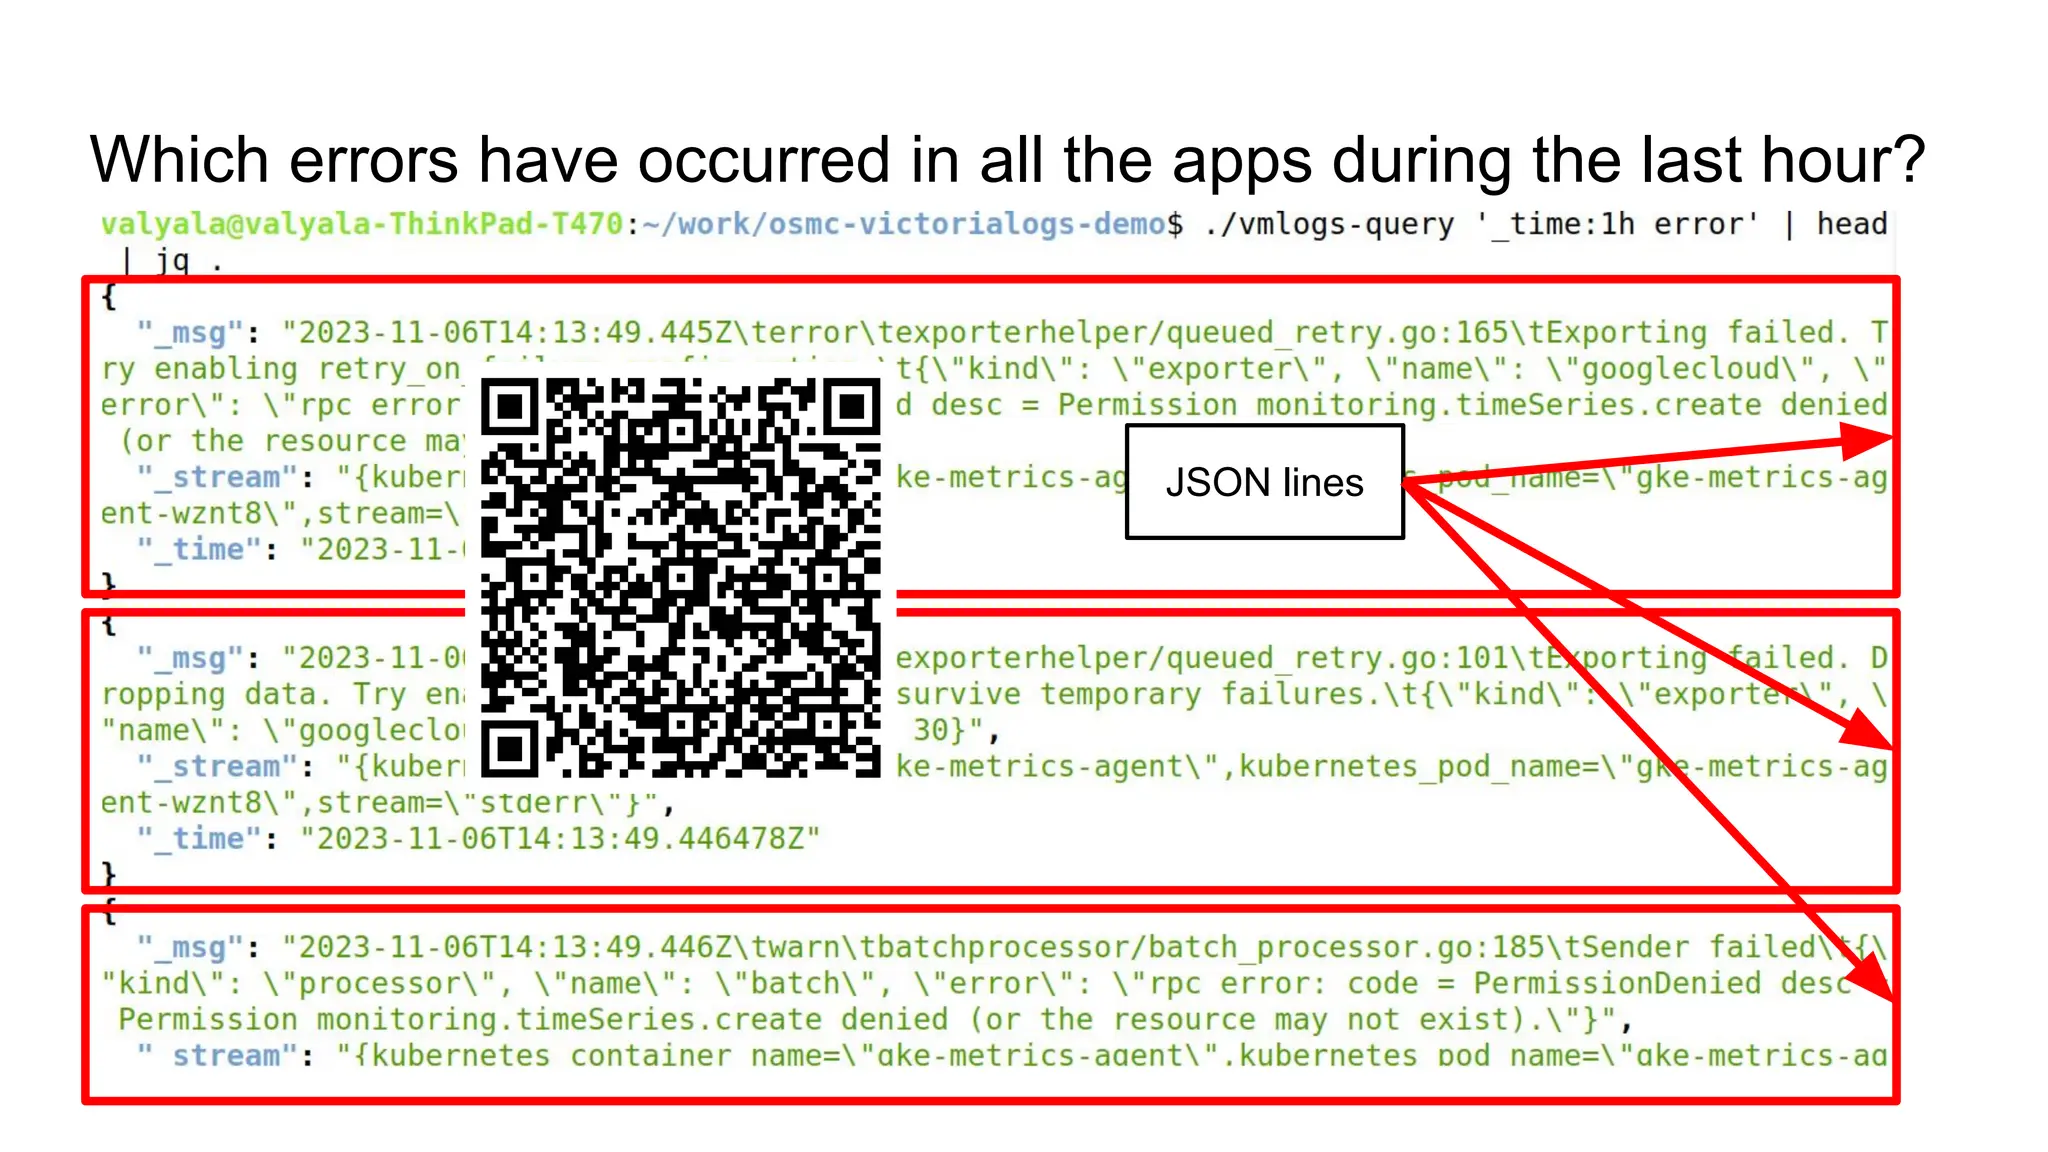
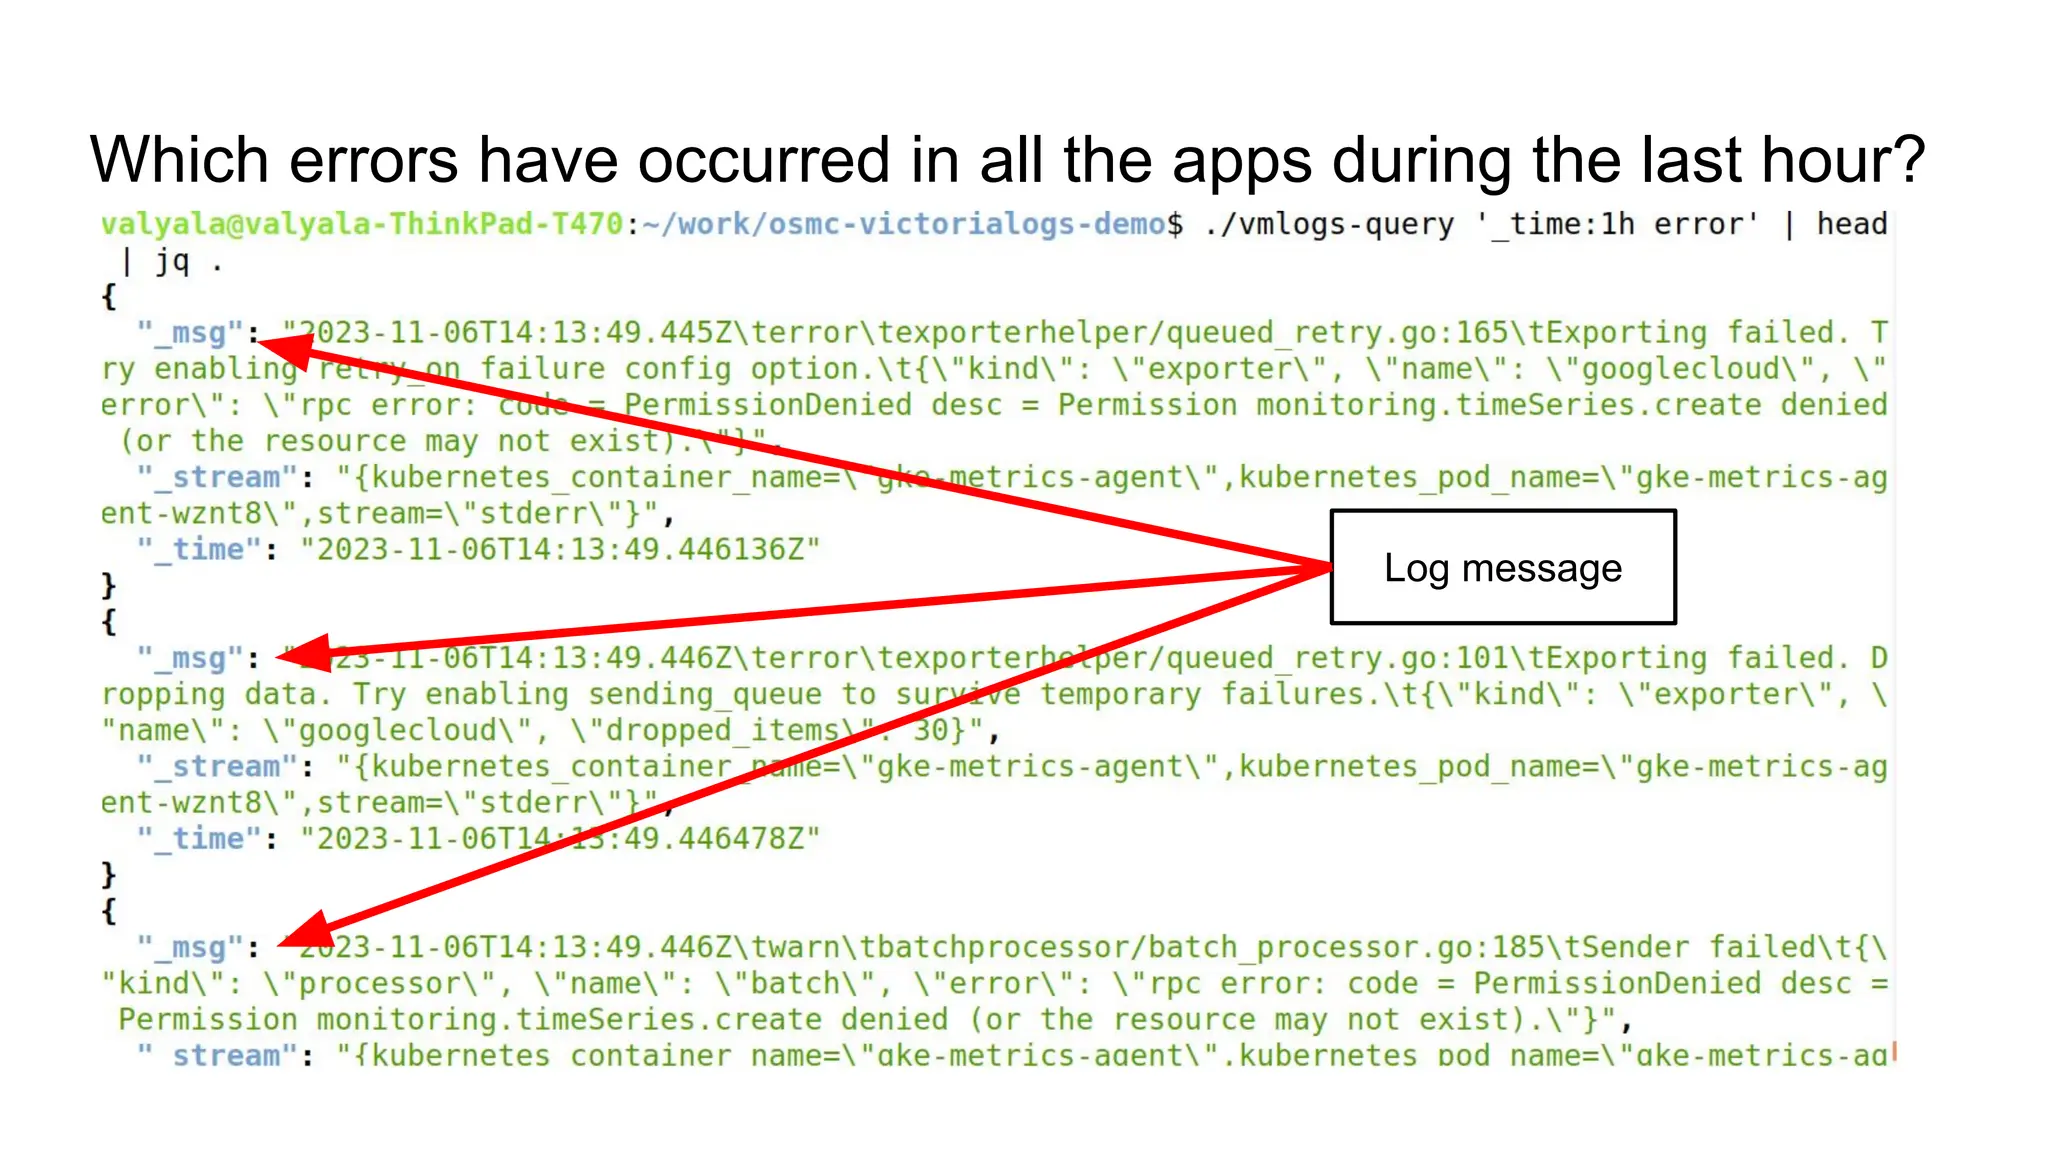
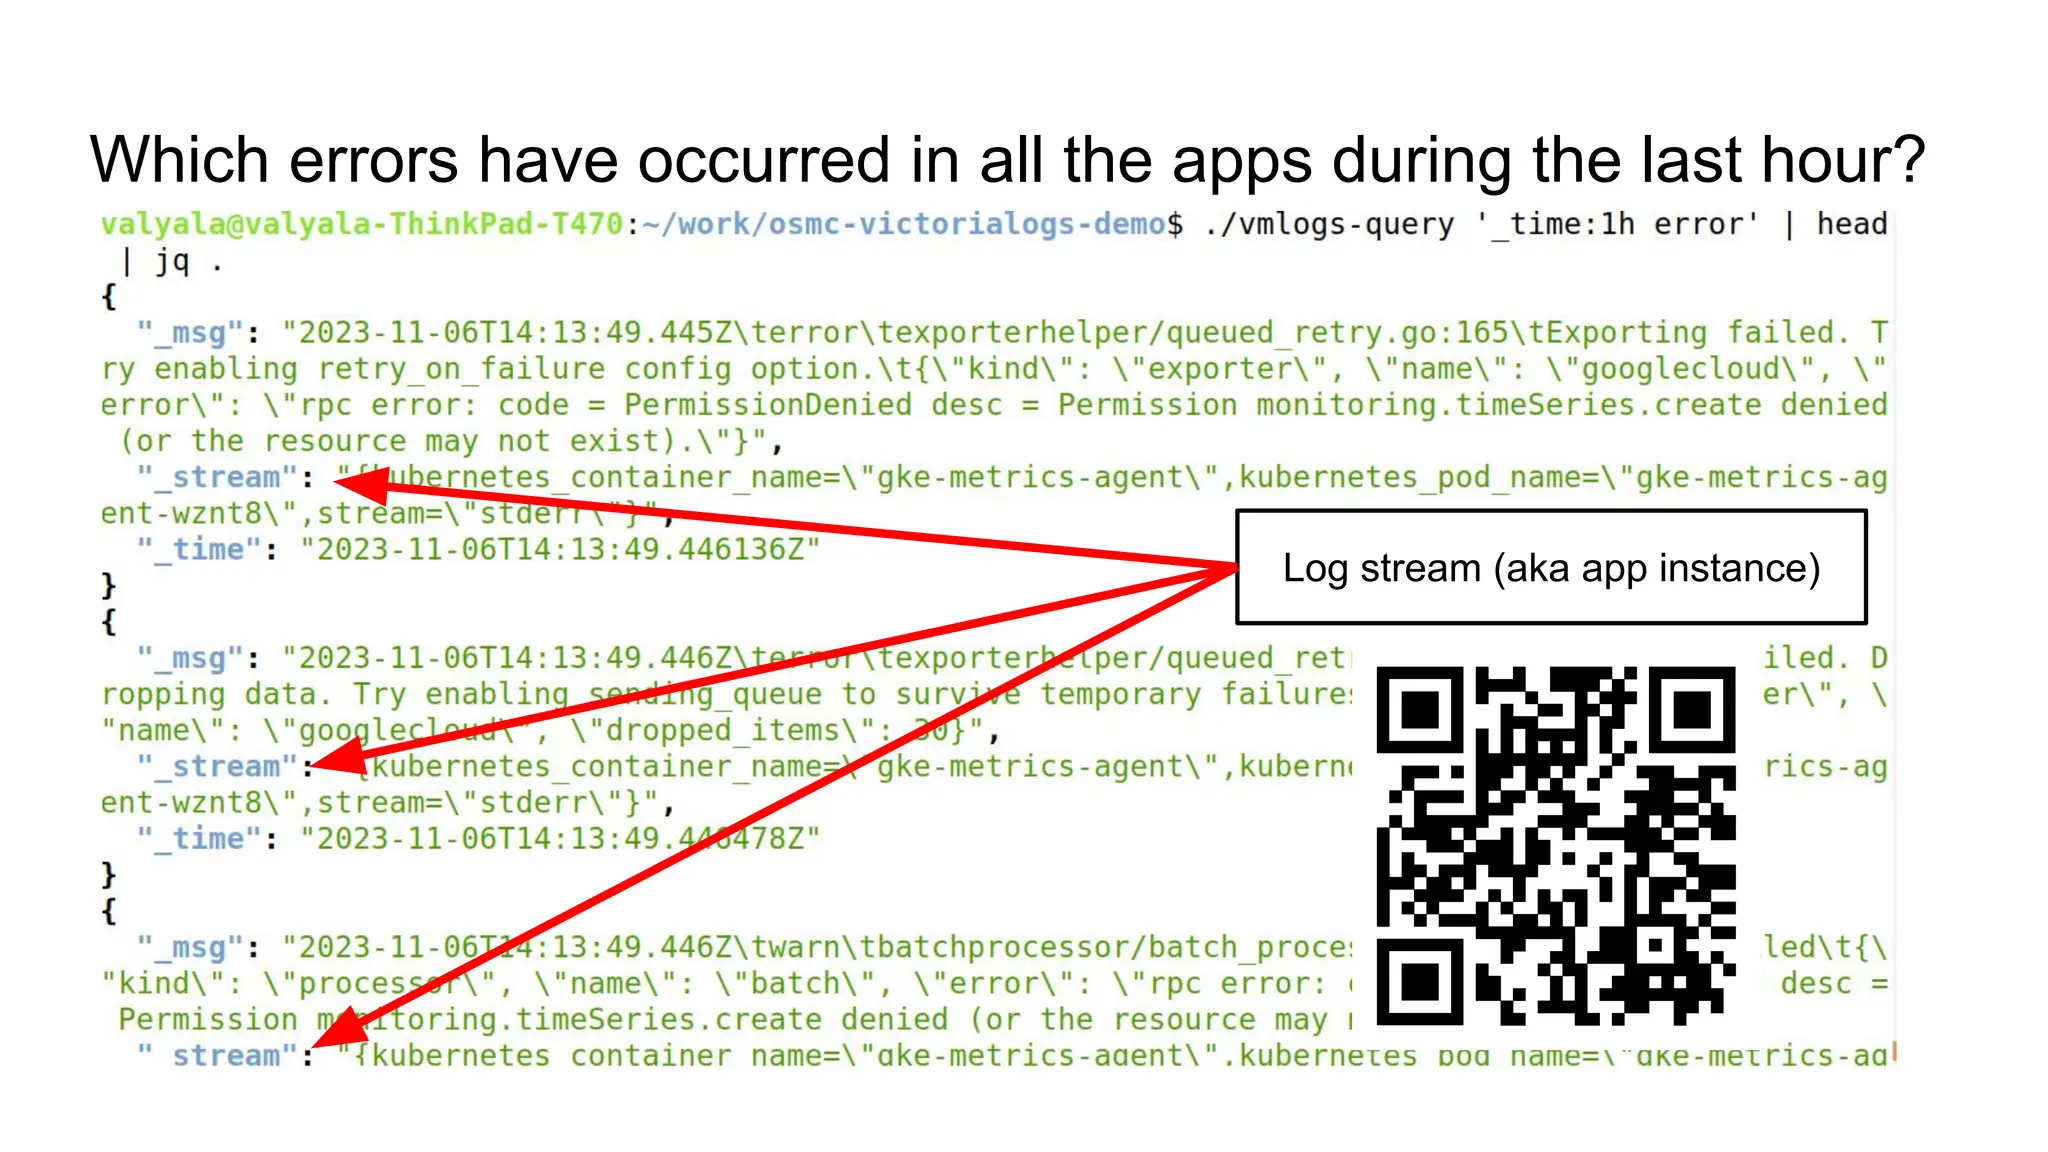
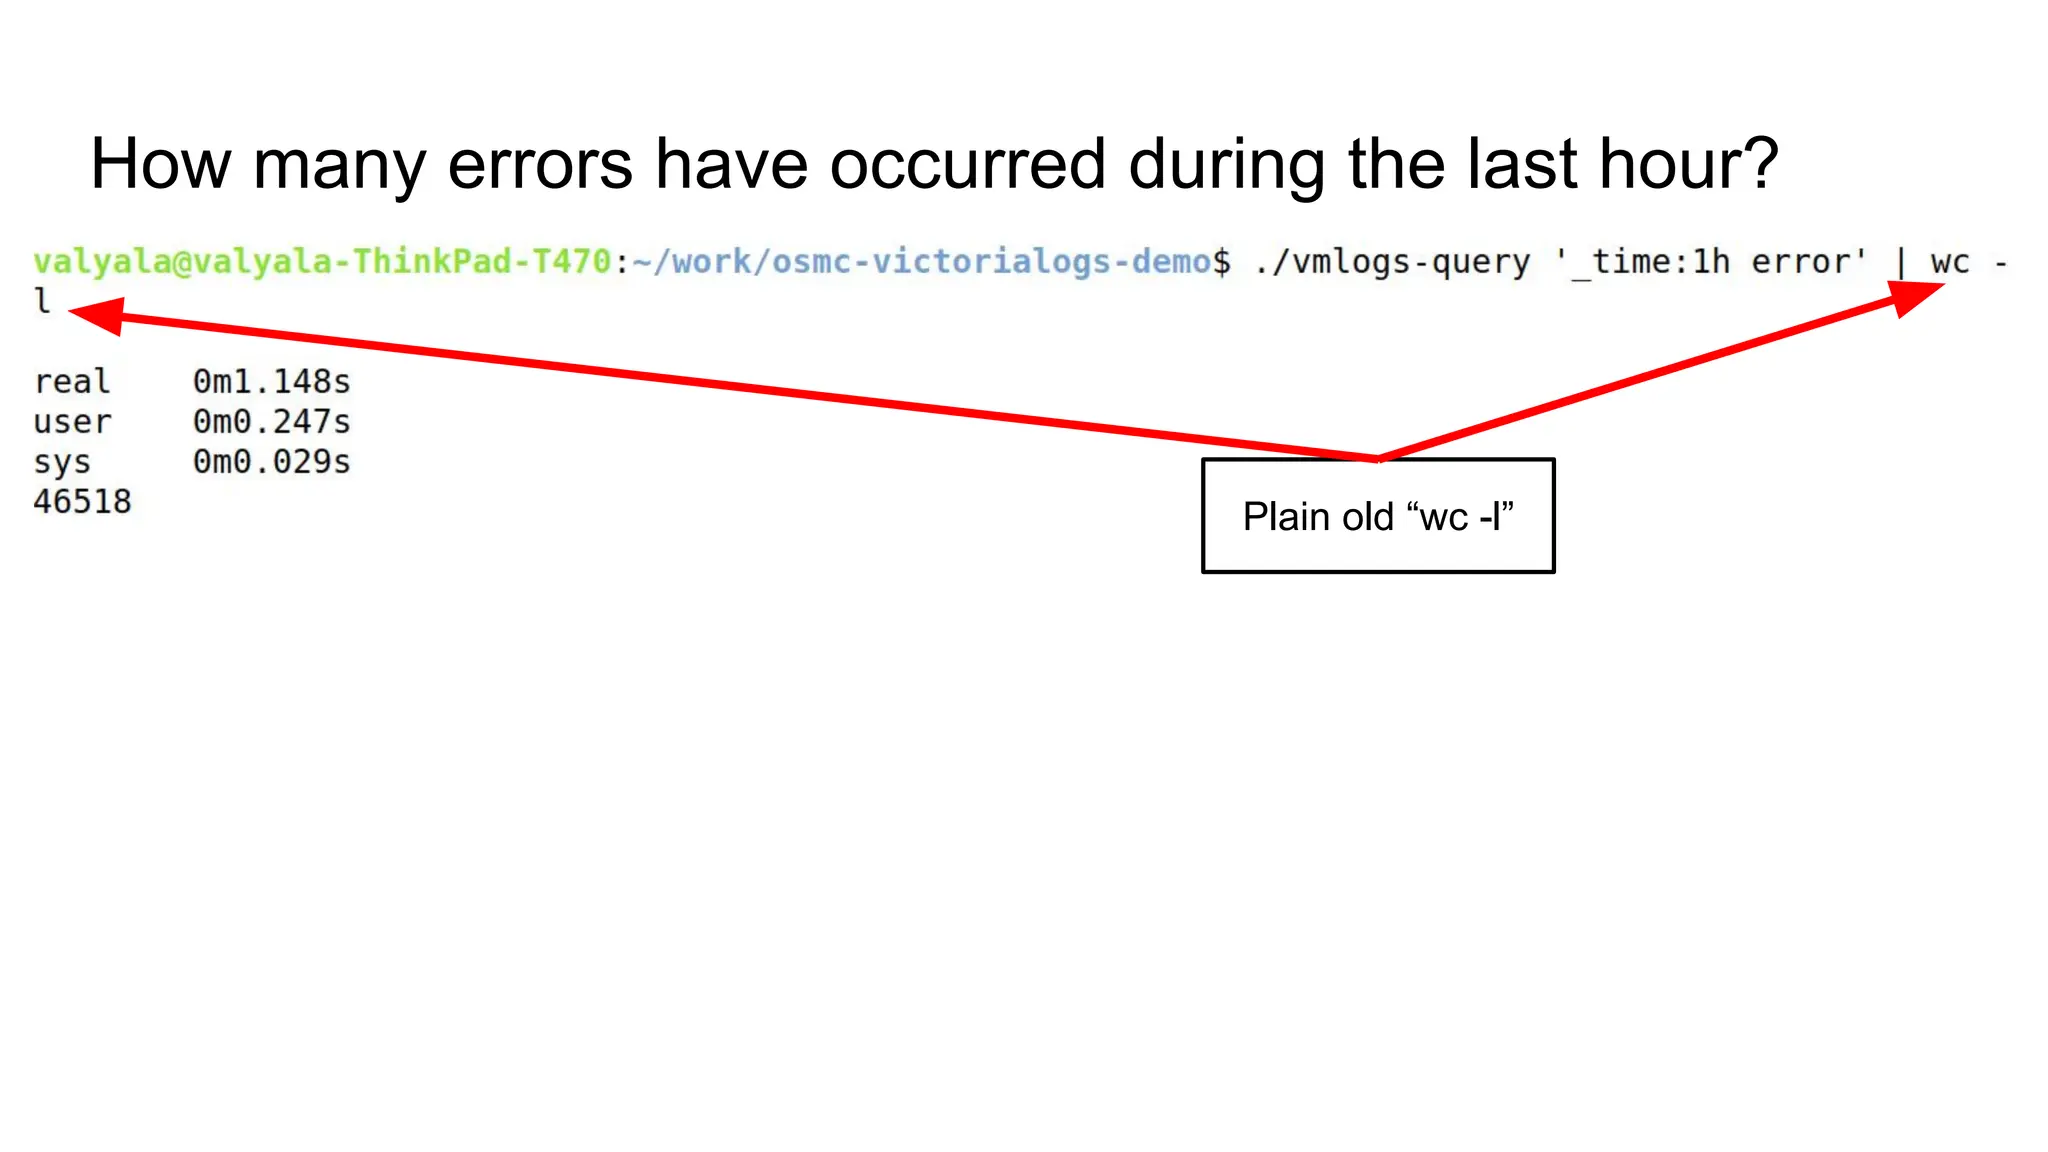
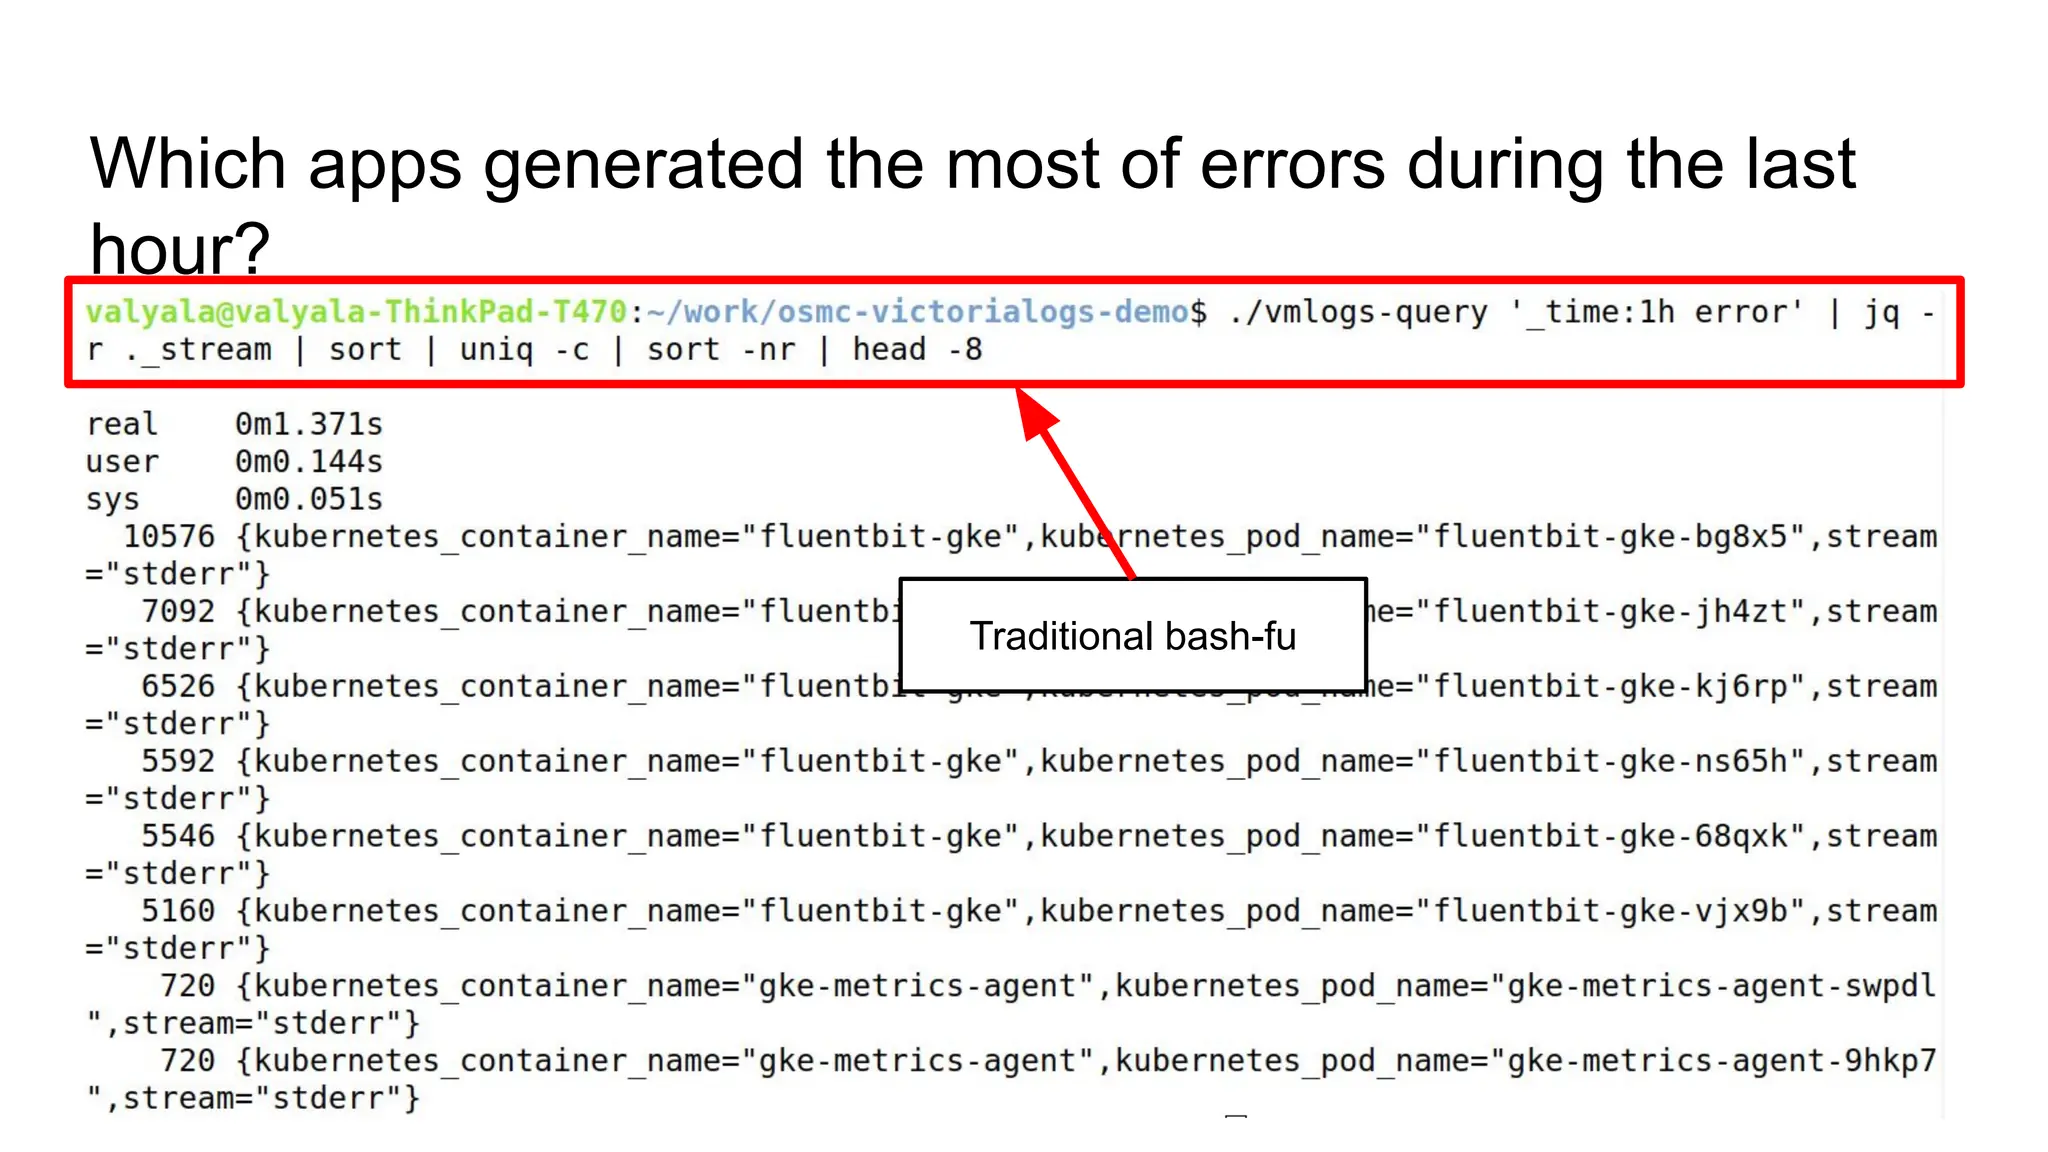
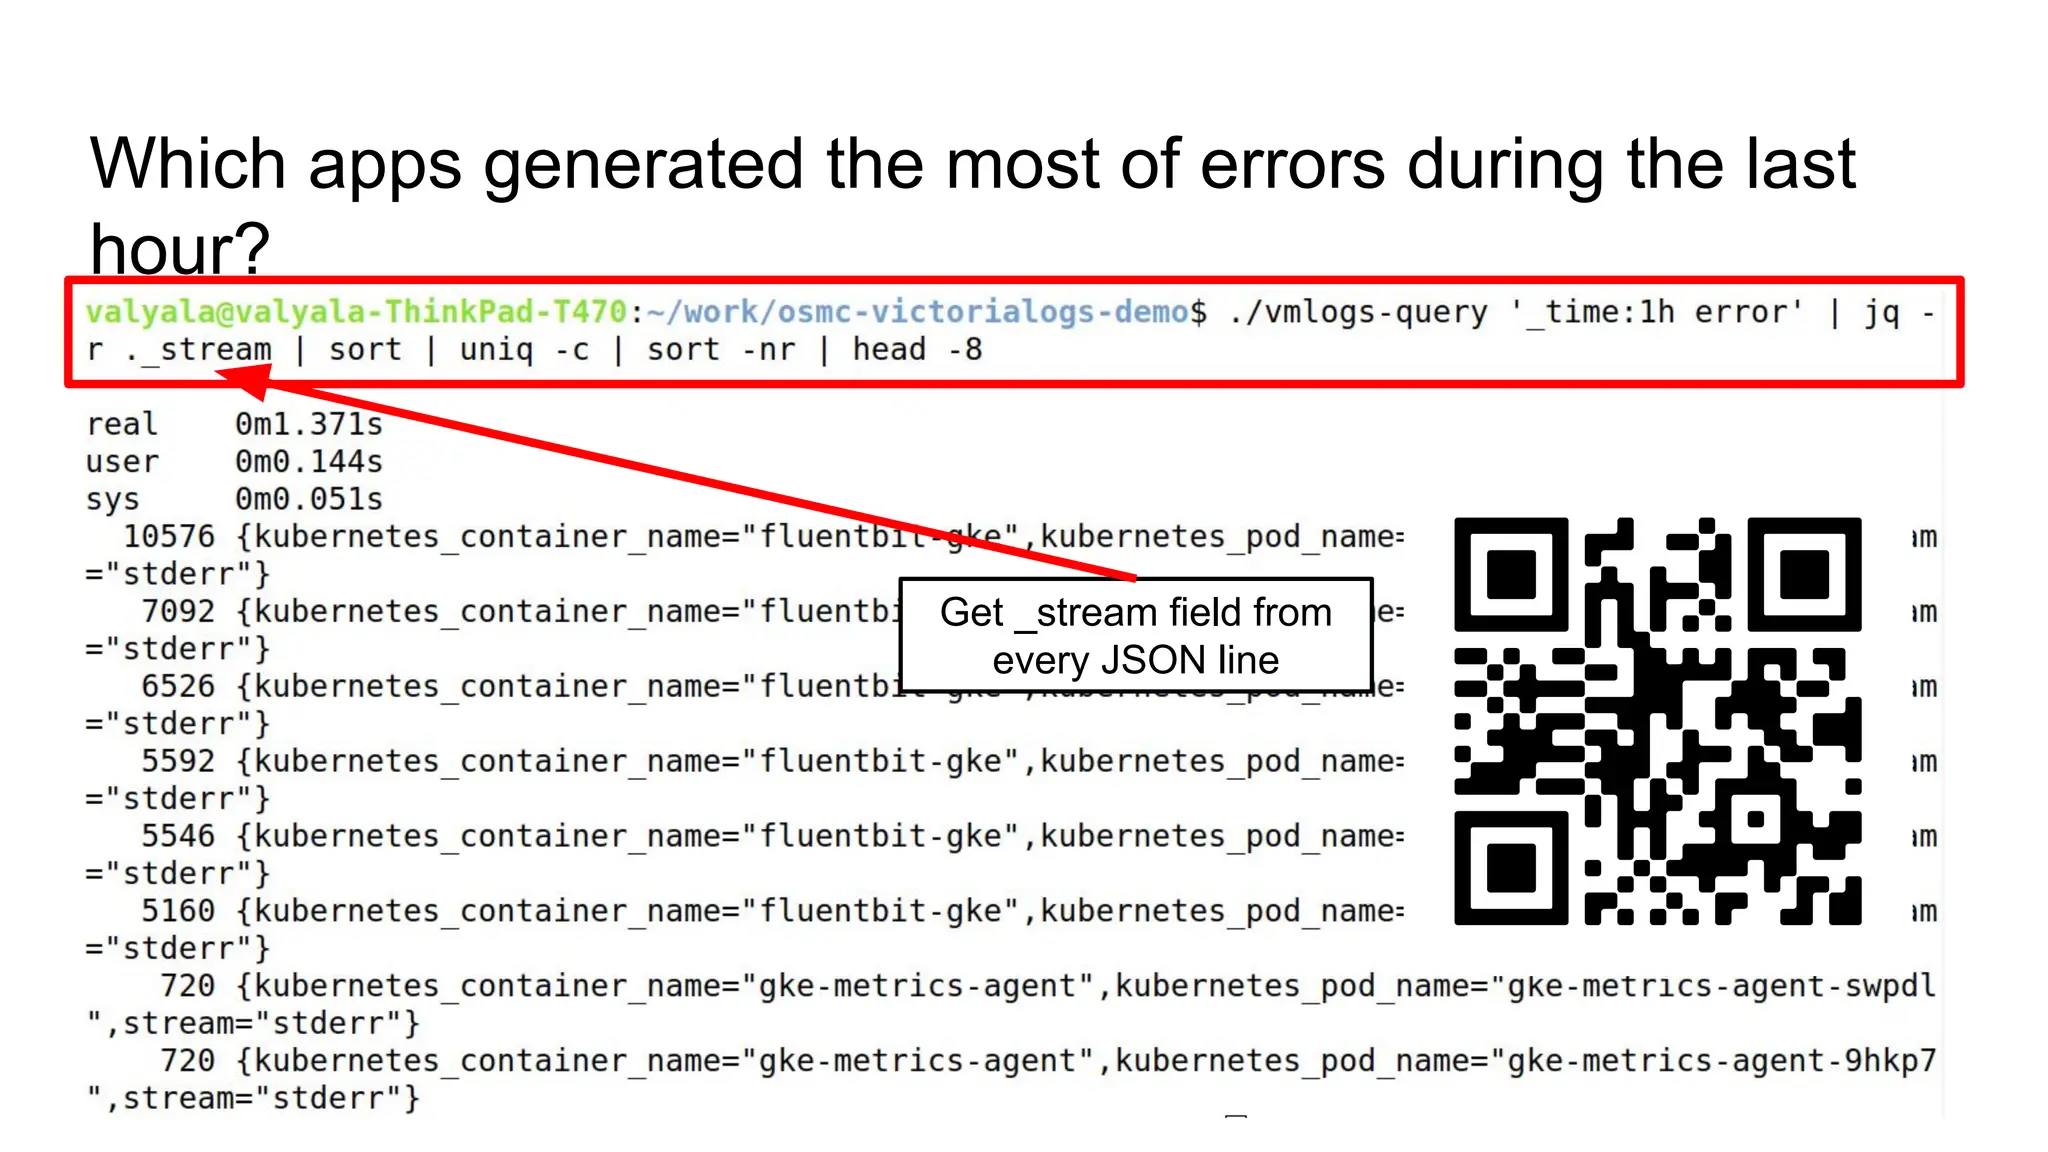
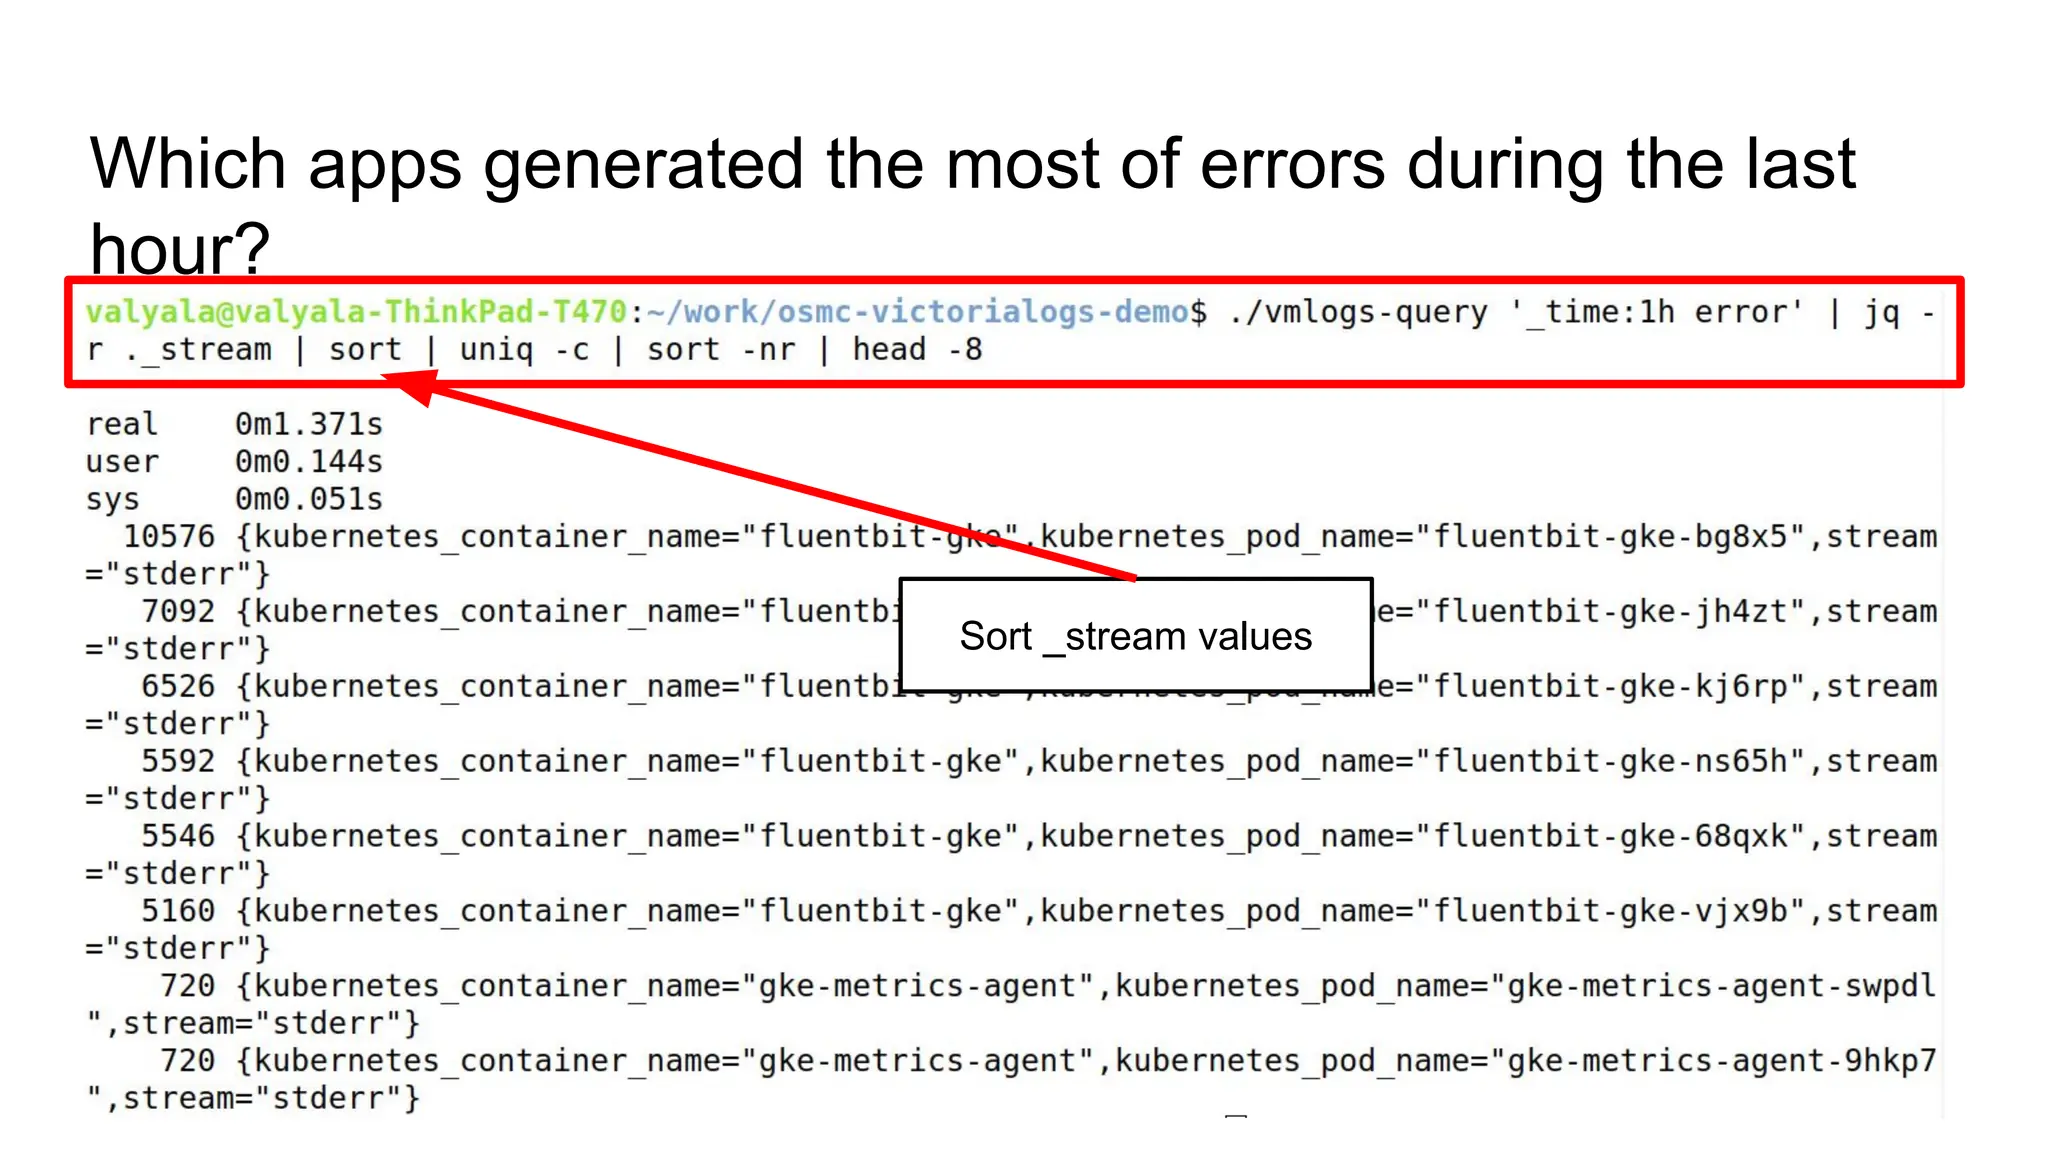
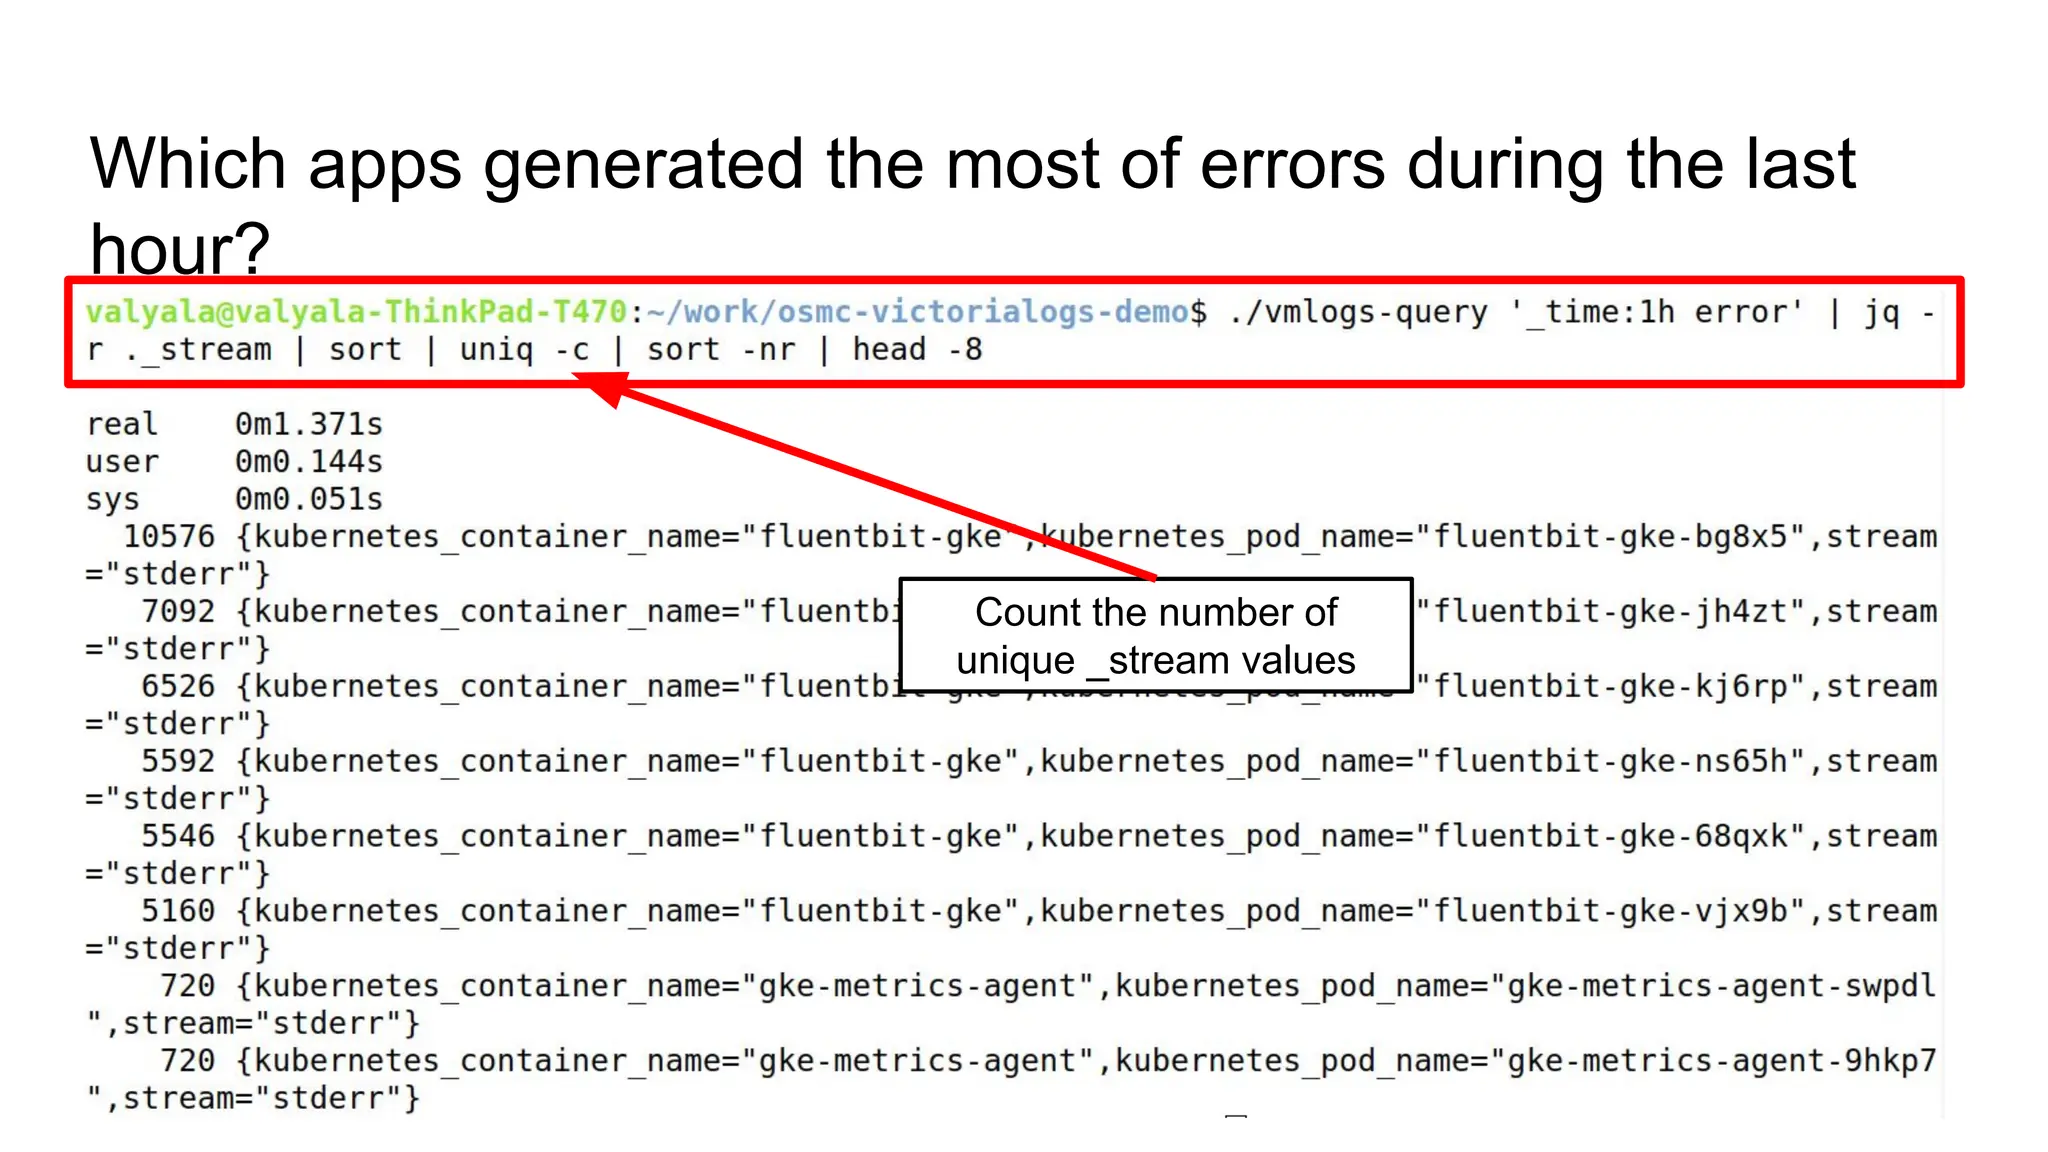

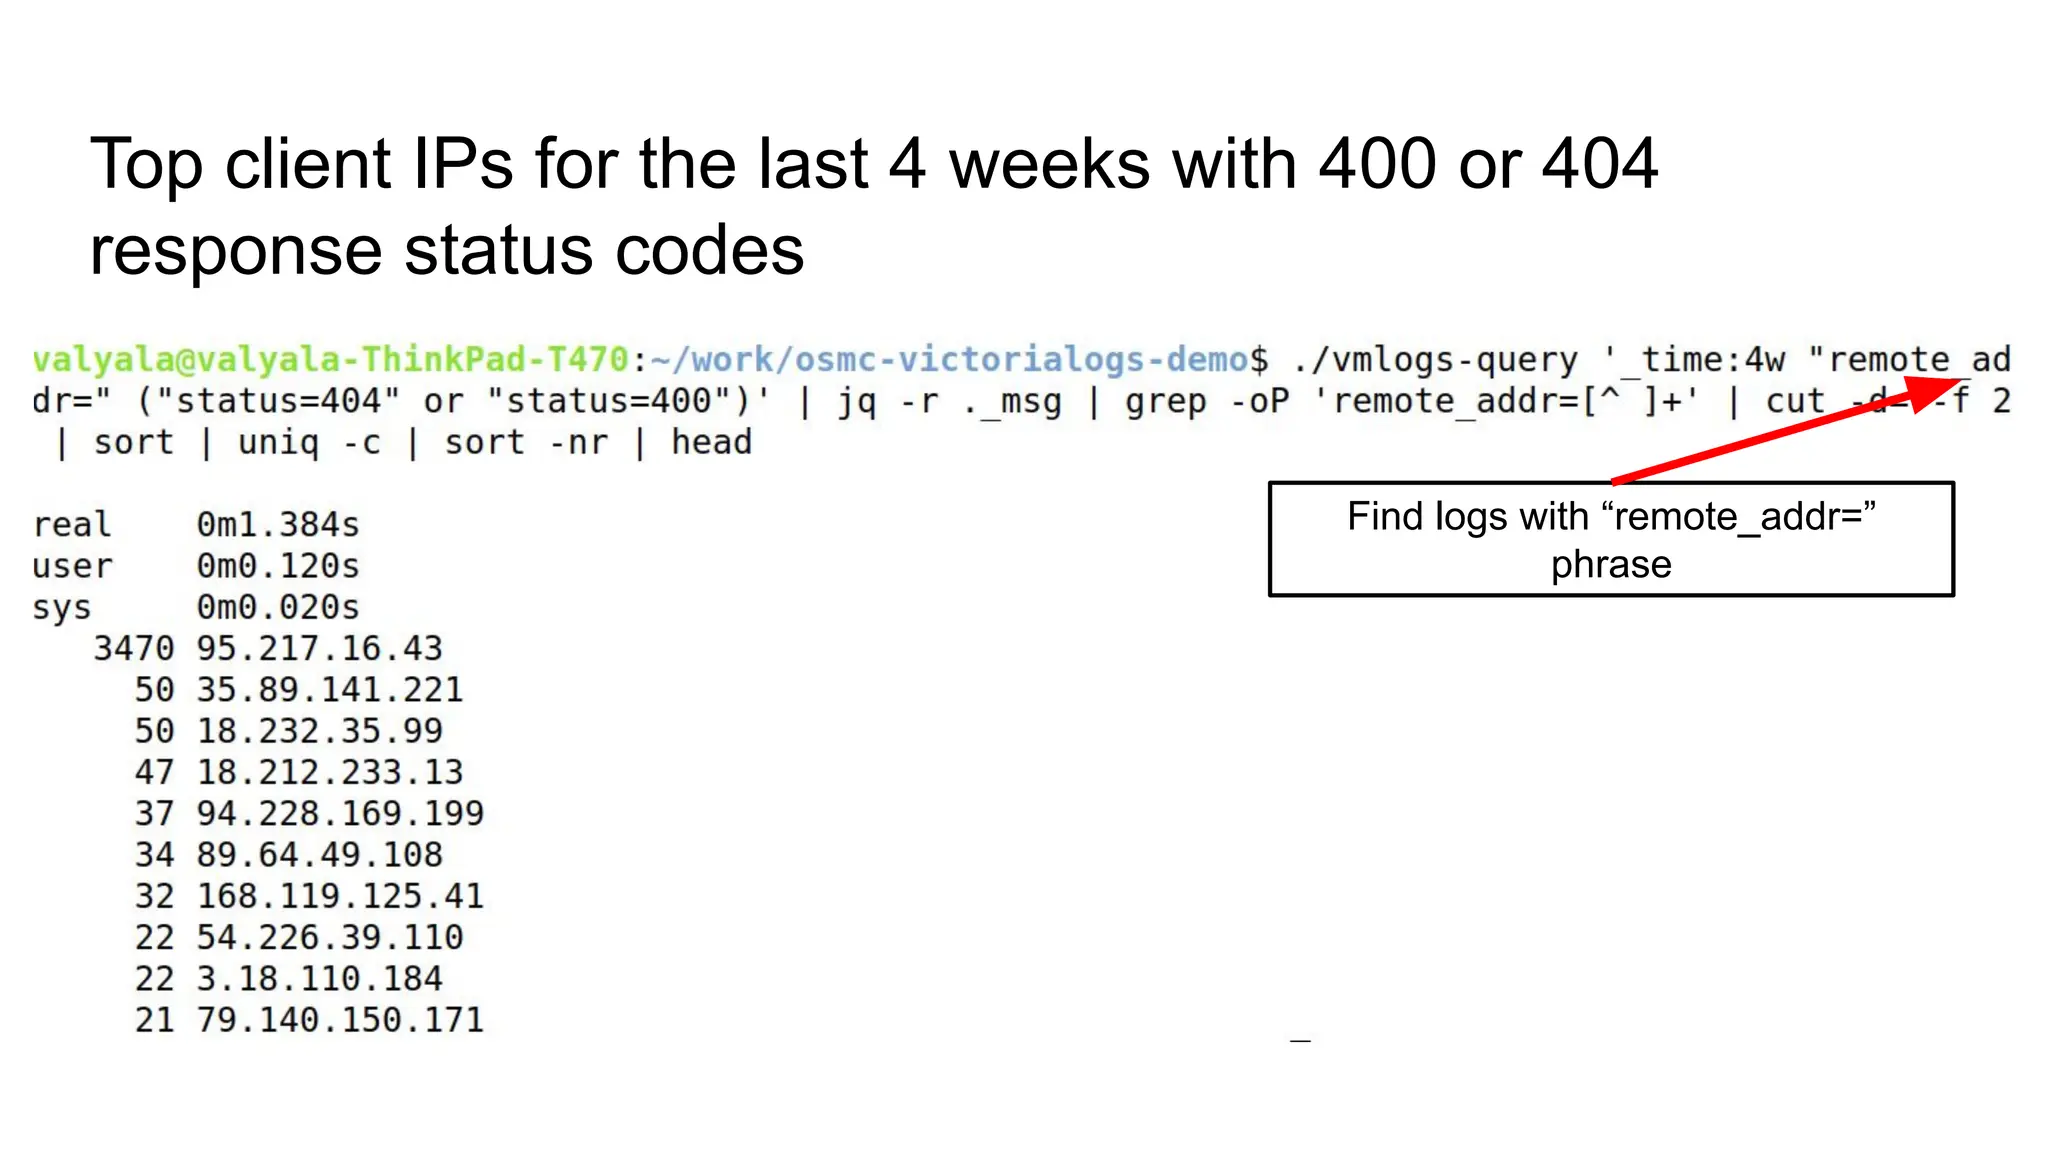
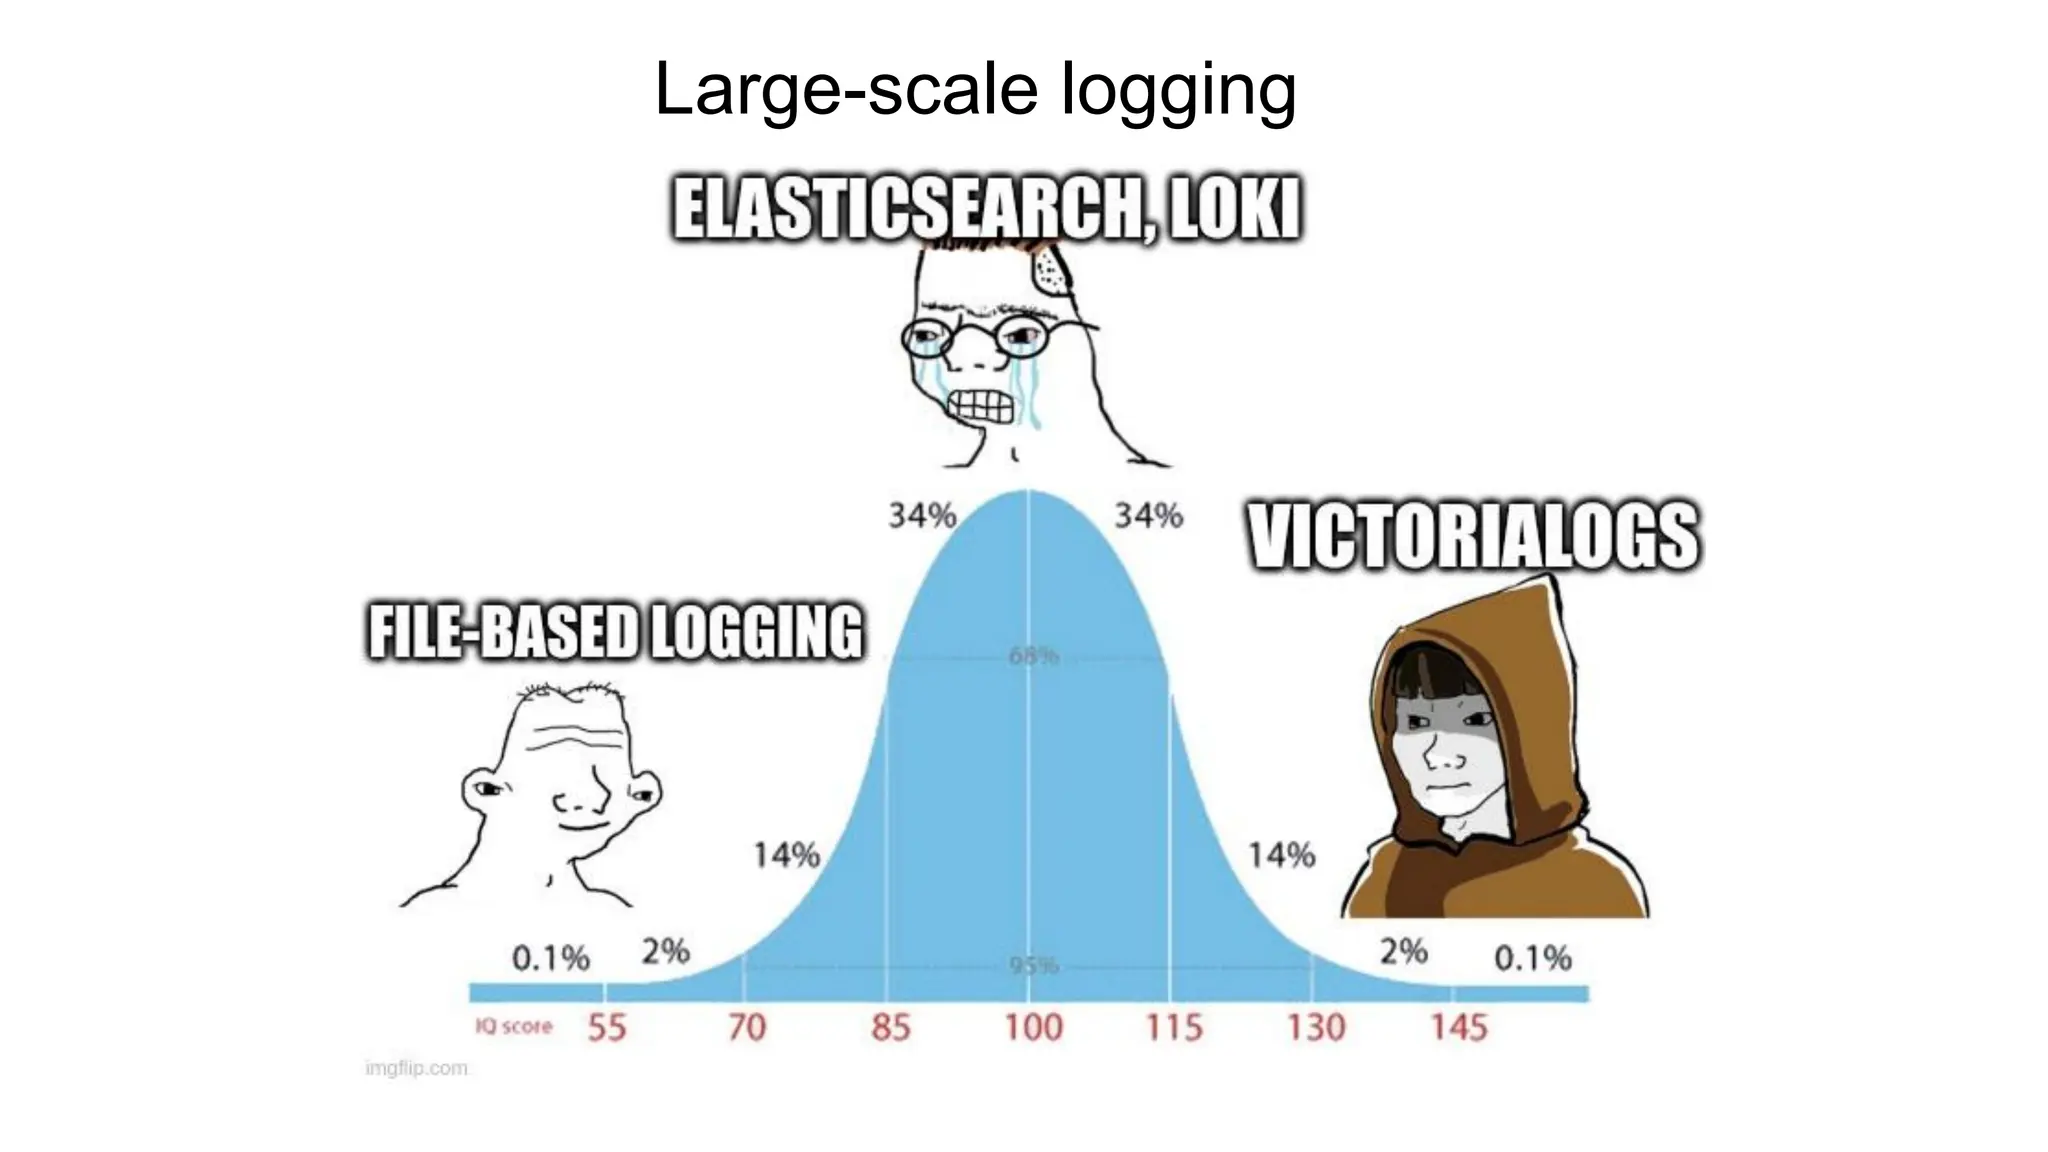
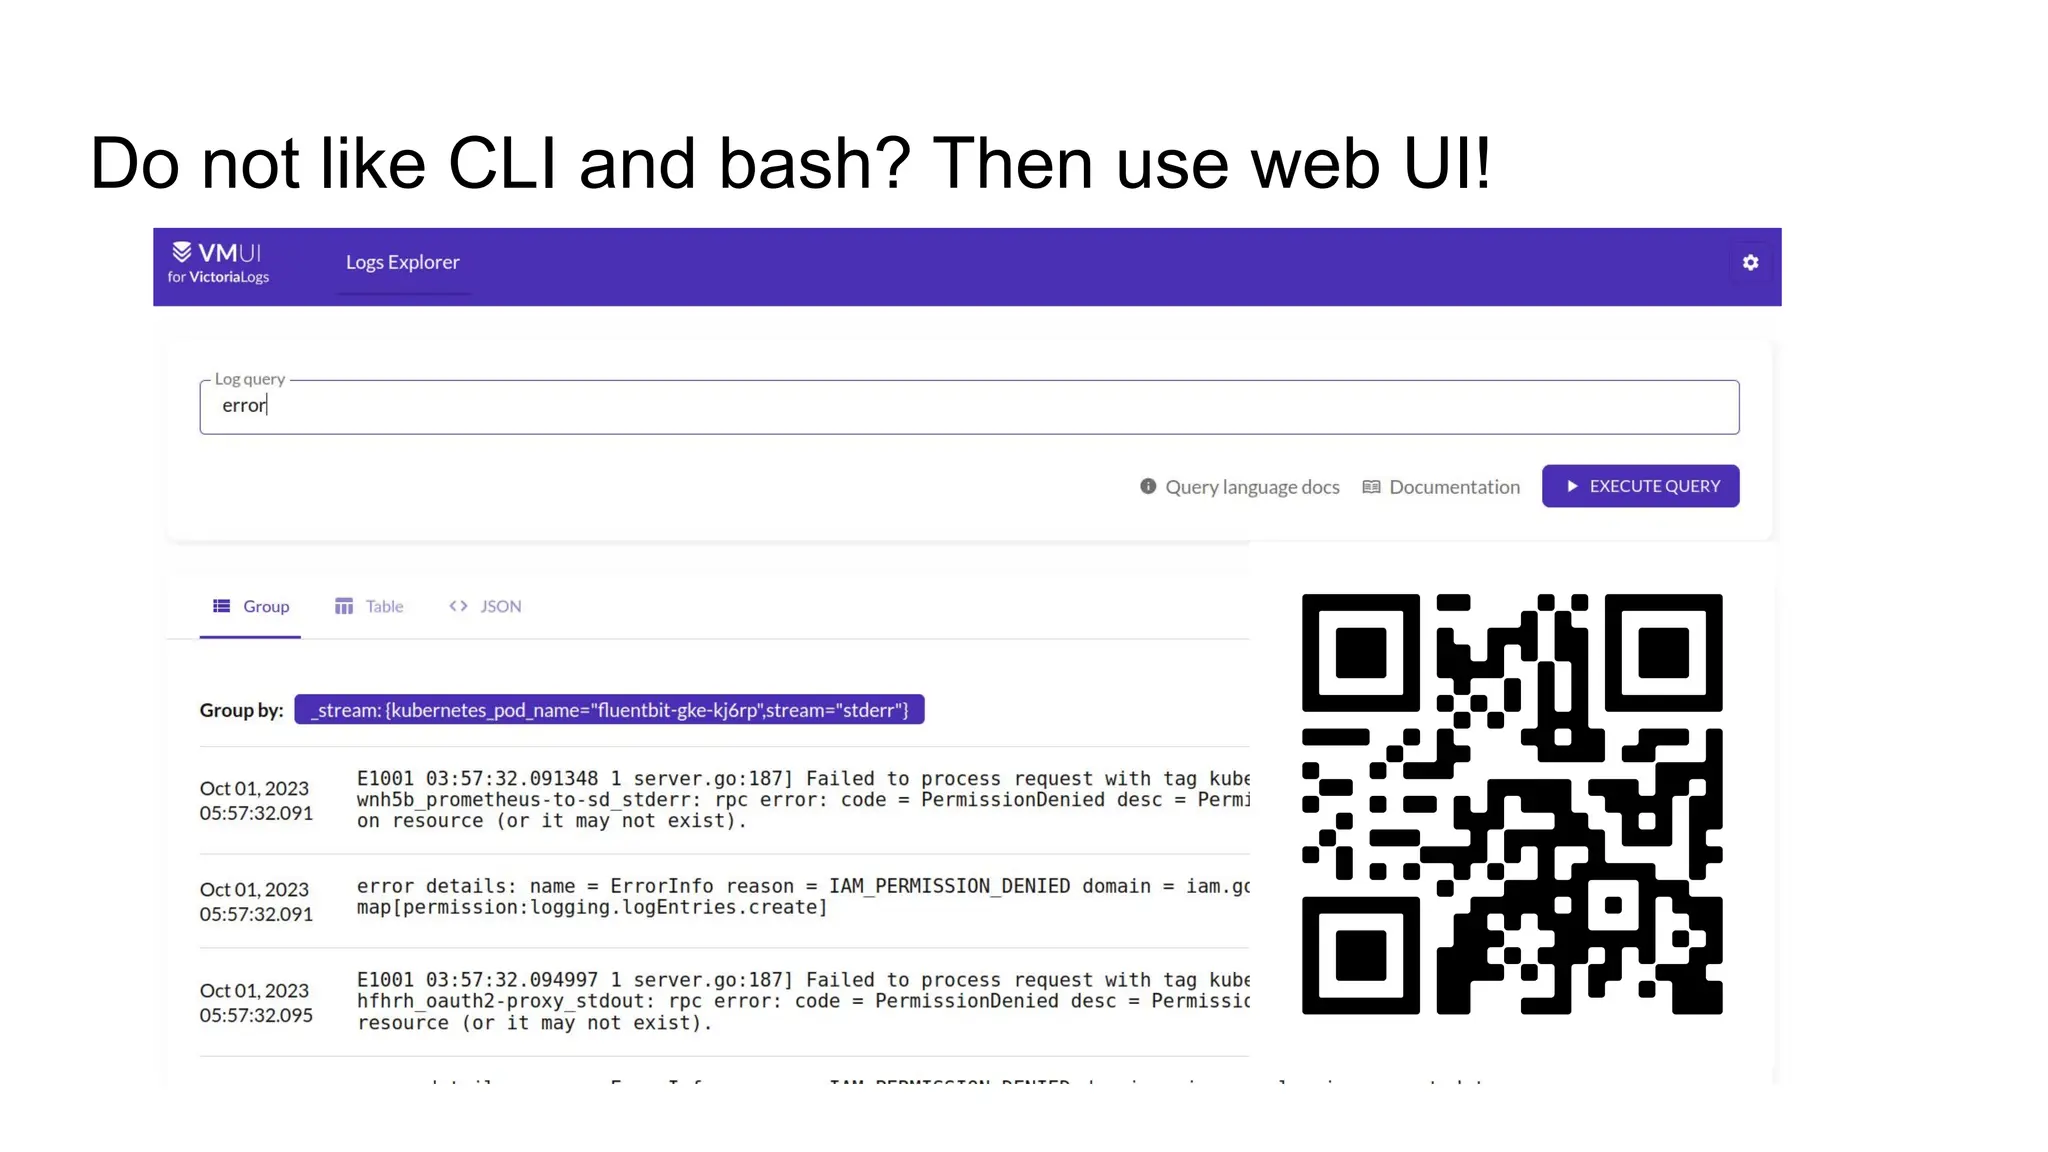
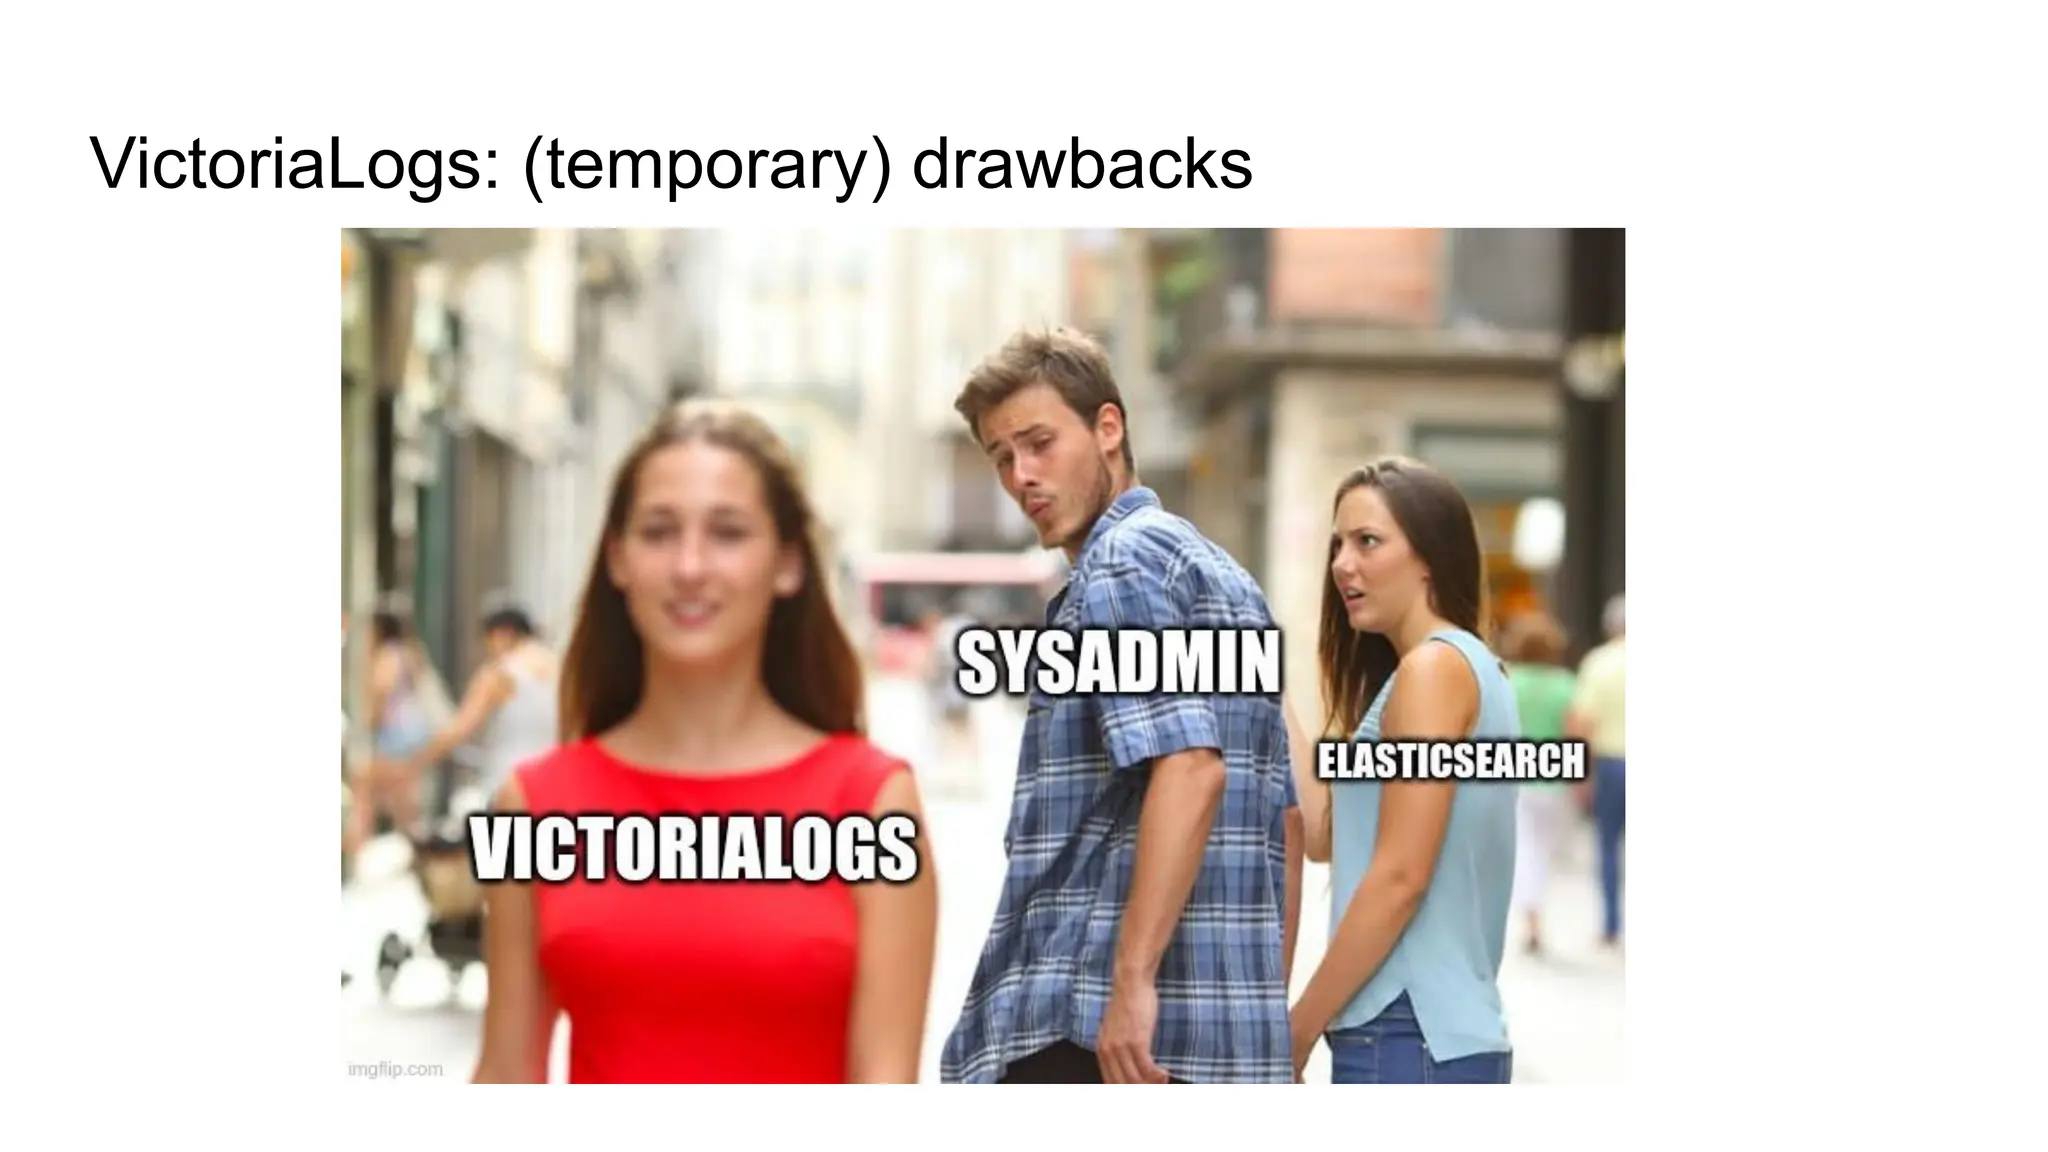

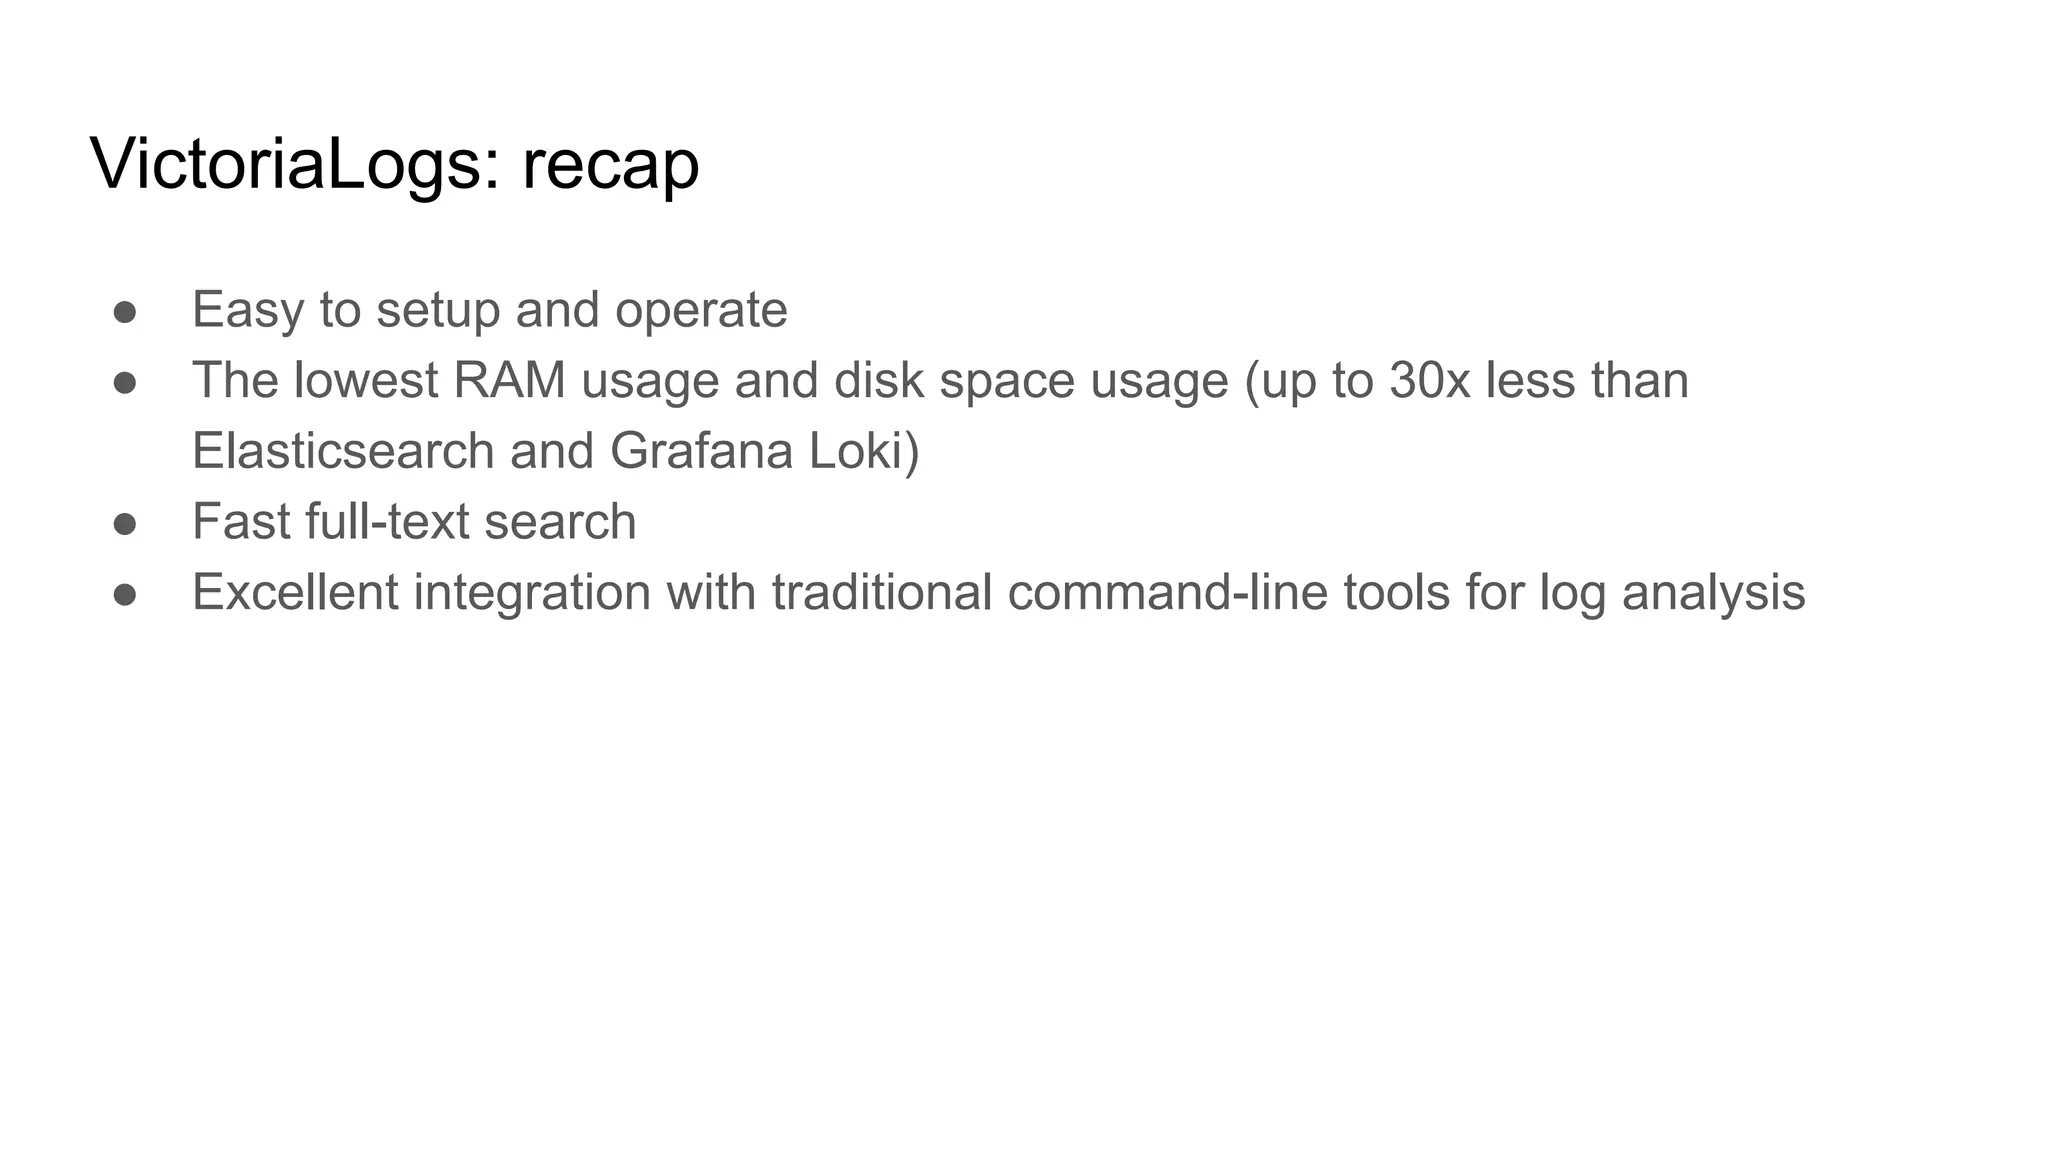
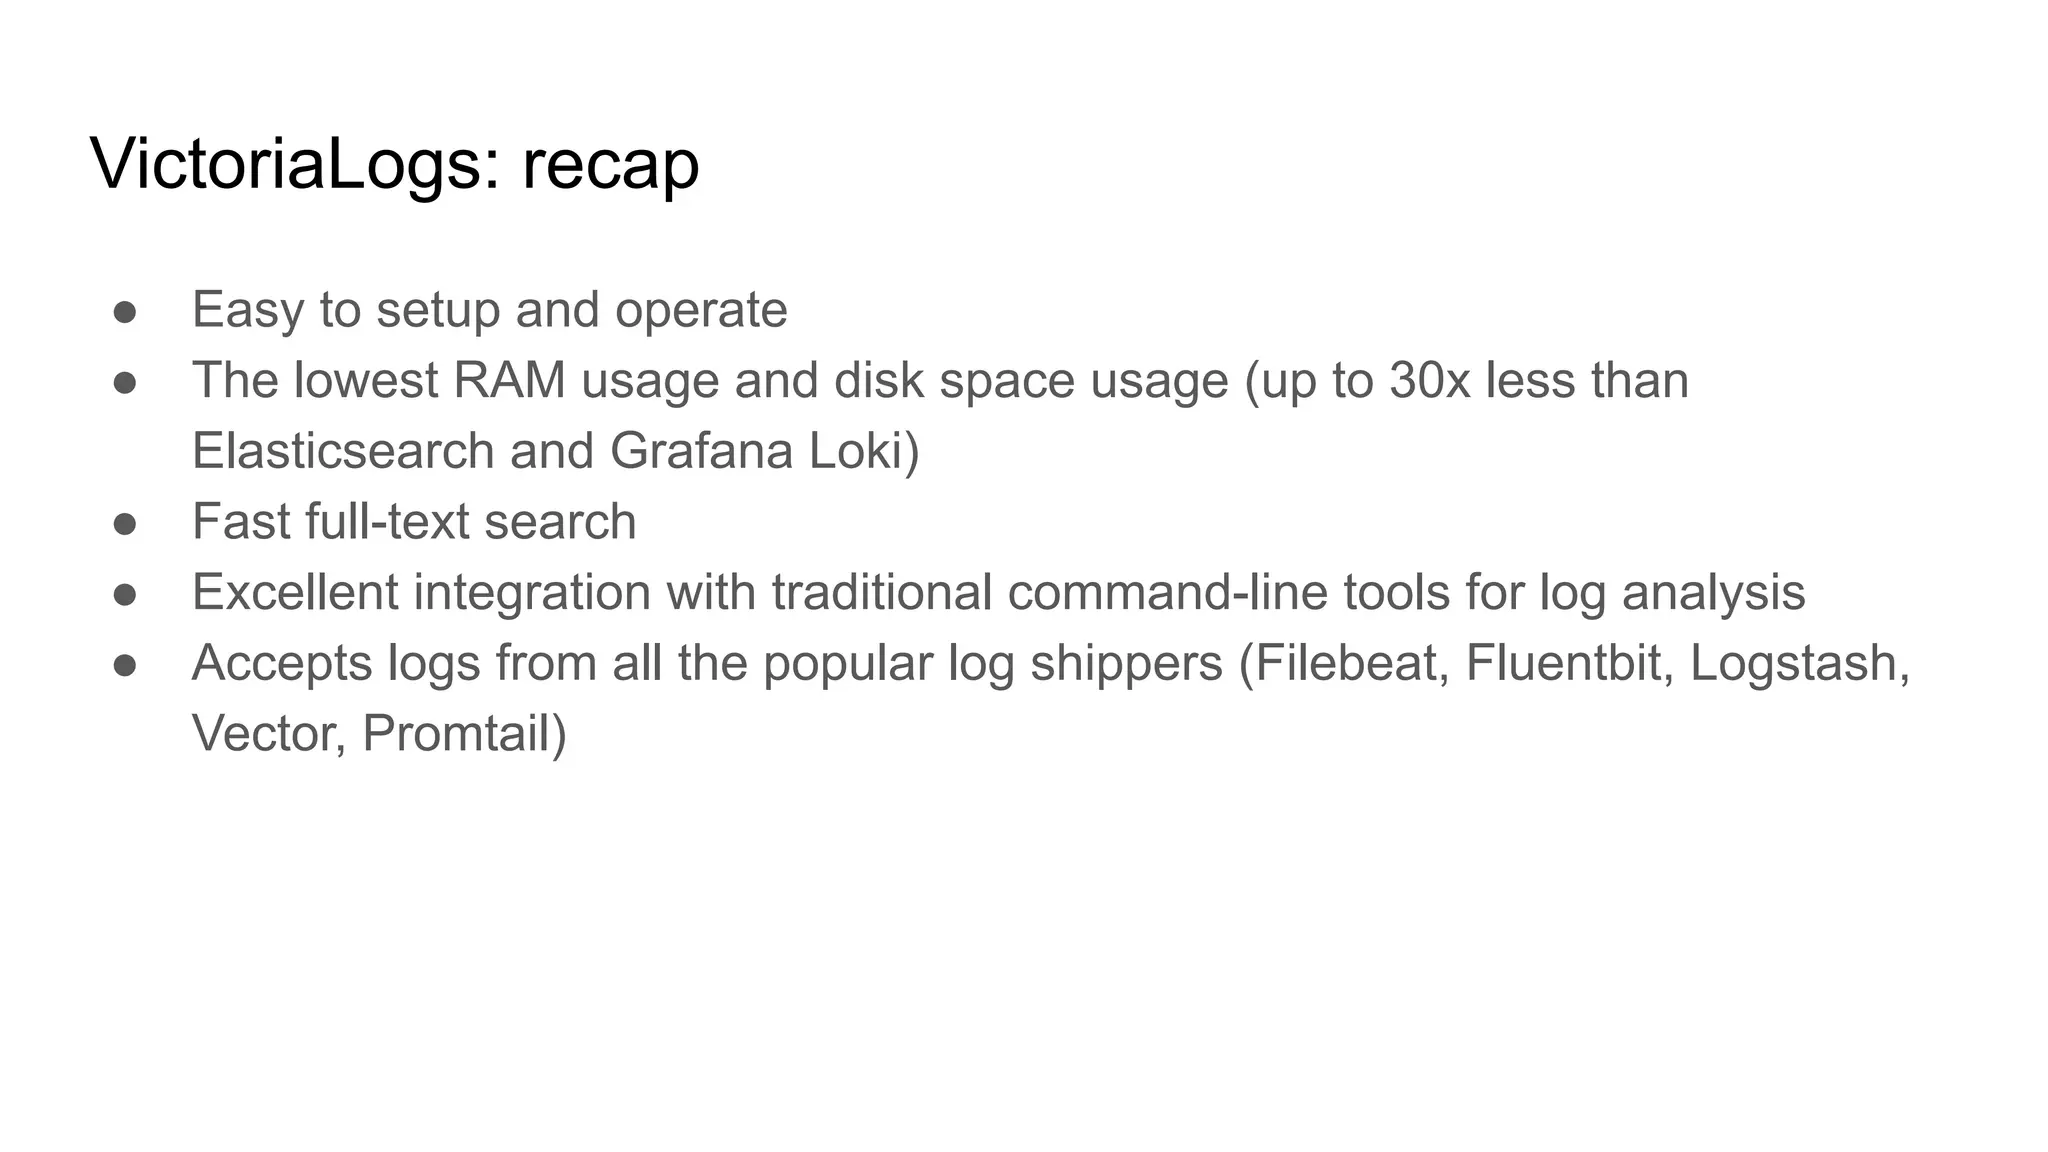
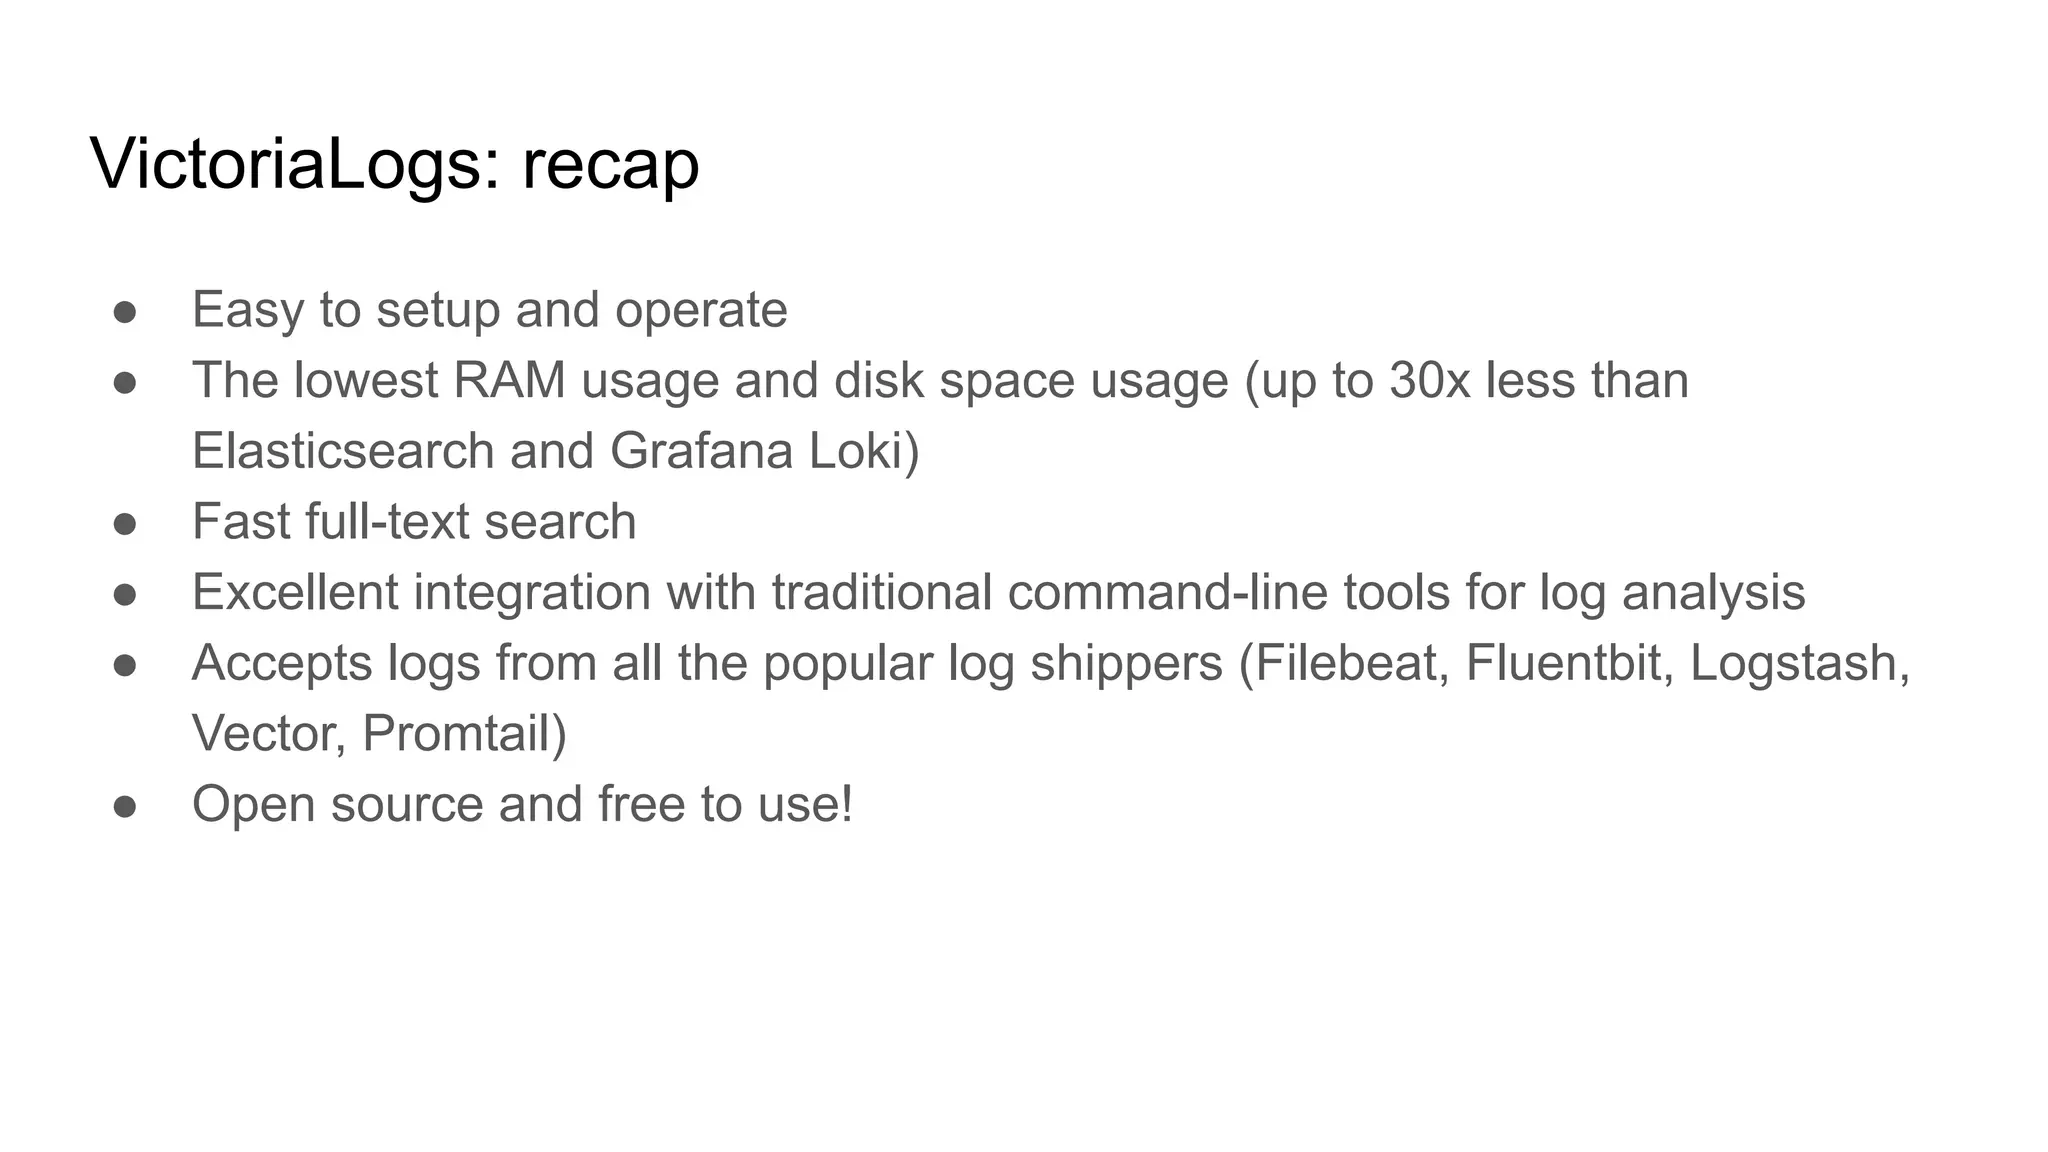


The document discusses large-scale logging and its critical role in debugging, security, and metrics analysis. It contrasts traditional logging with large-scale solutions, outlining the challenges of traditional methods and the advantages of modern systems like Victorialogs, which is easy to set up, resource-efficient, and provides fast querying capabilities. It also covers the integration of command-line tools and highlights the benefits of structured and unstructured logging in modern applications.