Downloaded 36 times


![The wave power W ( per unit width )can be approximately obtained as
The appearance frequency of ocean waves is now assumed as ψ(H1/3, T1/3) using the significant wave height H1/3
and the significant wave period T1/3.
The year expected value E[Wa], which is in kW/m (kilo
watt per unit width), of the wave power can be expressed
as follows:
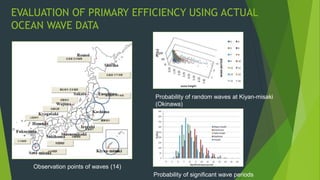
Expected values of wave power in every
season in an year at observation points
(unit: kilo watt per unit width)
The year expected value of the acquirable wave power
of the wave generation system is expressed as
Probability density function ϕ(H1/3, T1/3) can be defined as
On discretization
ESTIMATION OF YEAR EXPECTED VALUE OF POTENTIAL CAPACITY OF GENERATION POWER](https://image.slidesharecdn.com/oe12na30019-151113152717-lva1-app6891/85/Oscillating-Water-Column-OWC-with-Projecting-Walls-11-320.jpg)
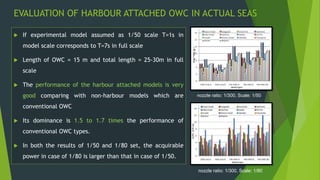


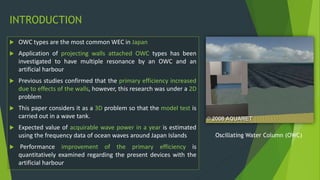
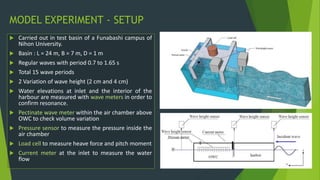
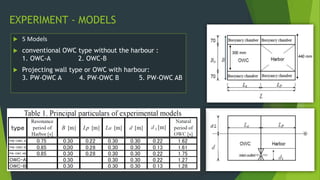
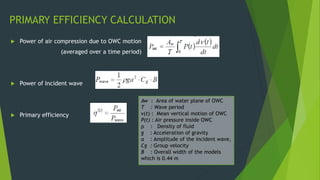
This document presents research on wave power absorption around the Japanese islands using oscillating water column (OWC) systems with artificial harbors. The study involved experiments in a wave tank to evaluate the efficiency of these systems, concluding that attaching an artificial harbor significantly improves the primary efficiency of wave power absorption. The findings suggest that the proposed fixed OWC system can generate several kilowatts per unit width, demonstrating its effectiveness in harnessing wave energy.