Download to read offline
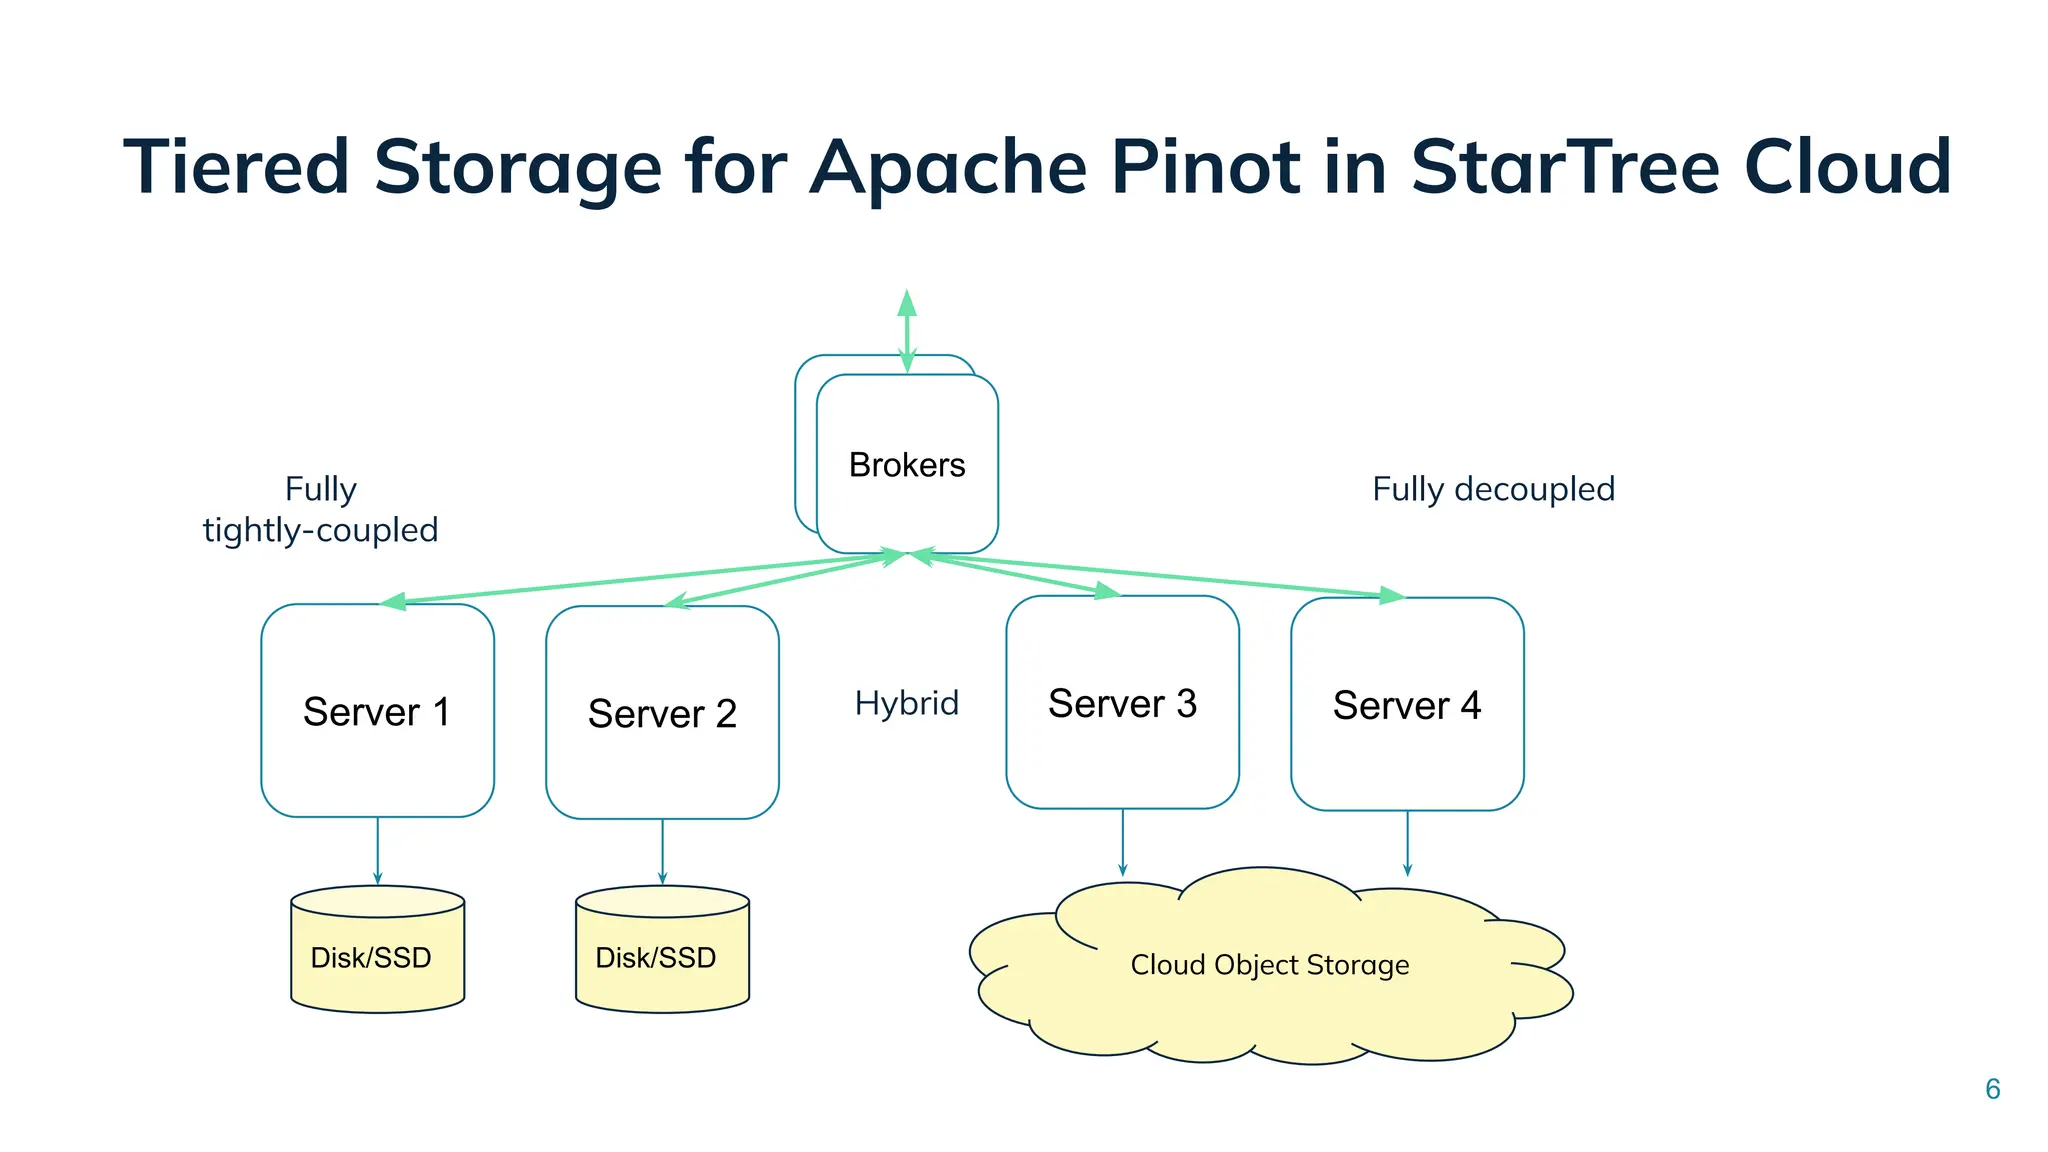
![Tiered Storage for Apache Pinot in StarTree Cloud
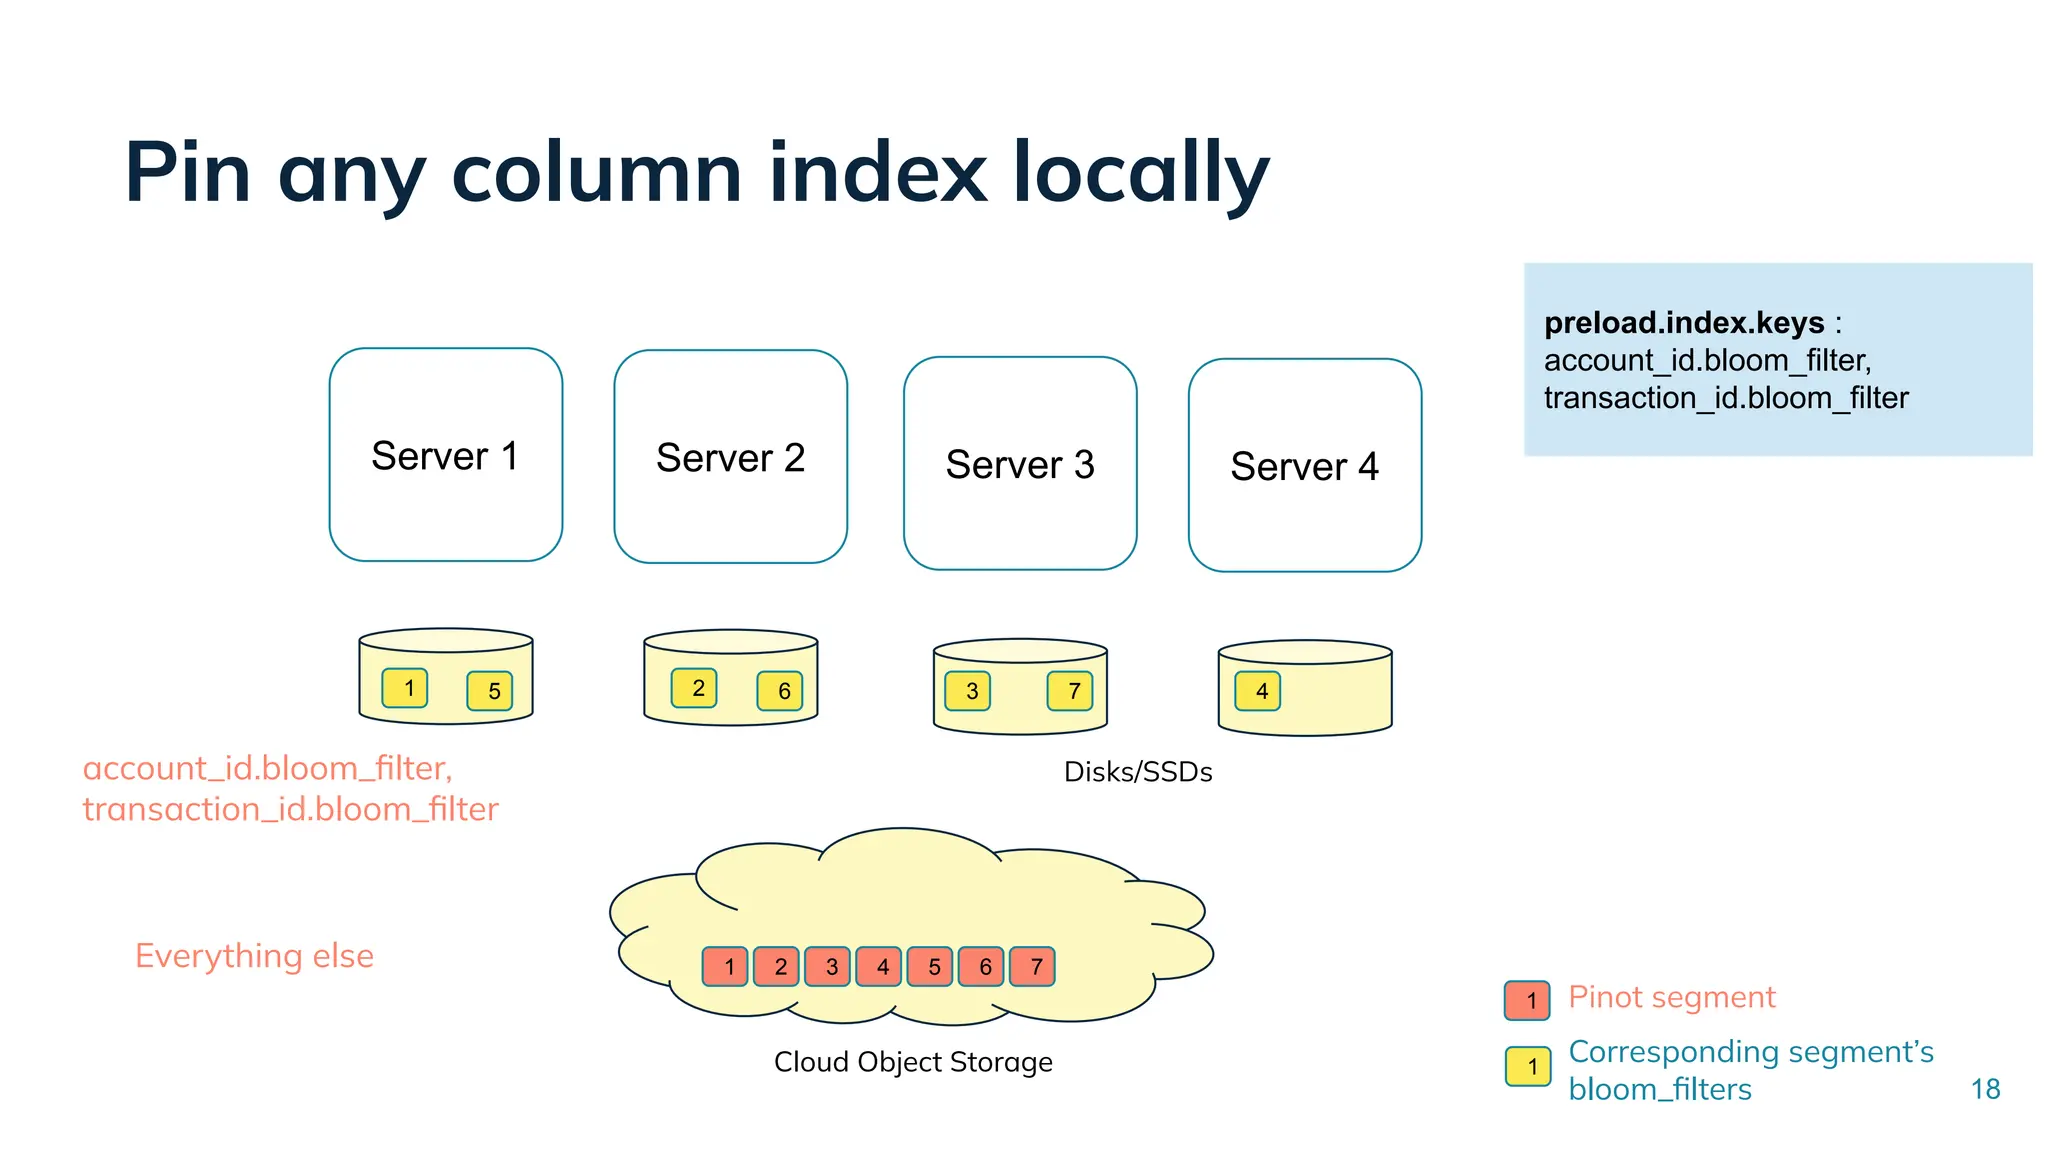
Server 3 Server 4
Server 1 Server 2
Disk/SSD
Brokers
Brokers
Disk/SSD Disk/SSD
Disk/SSD
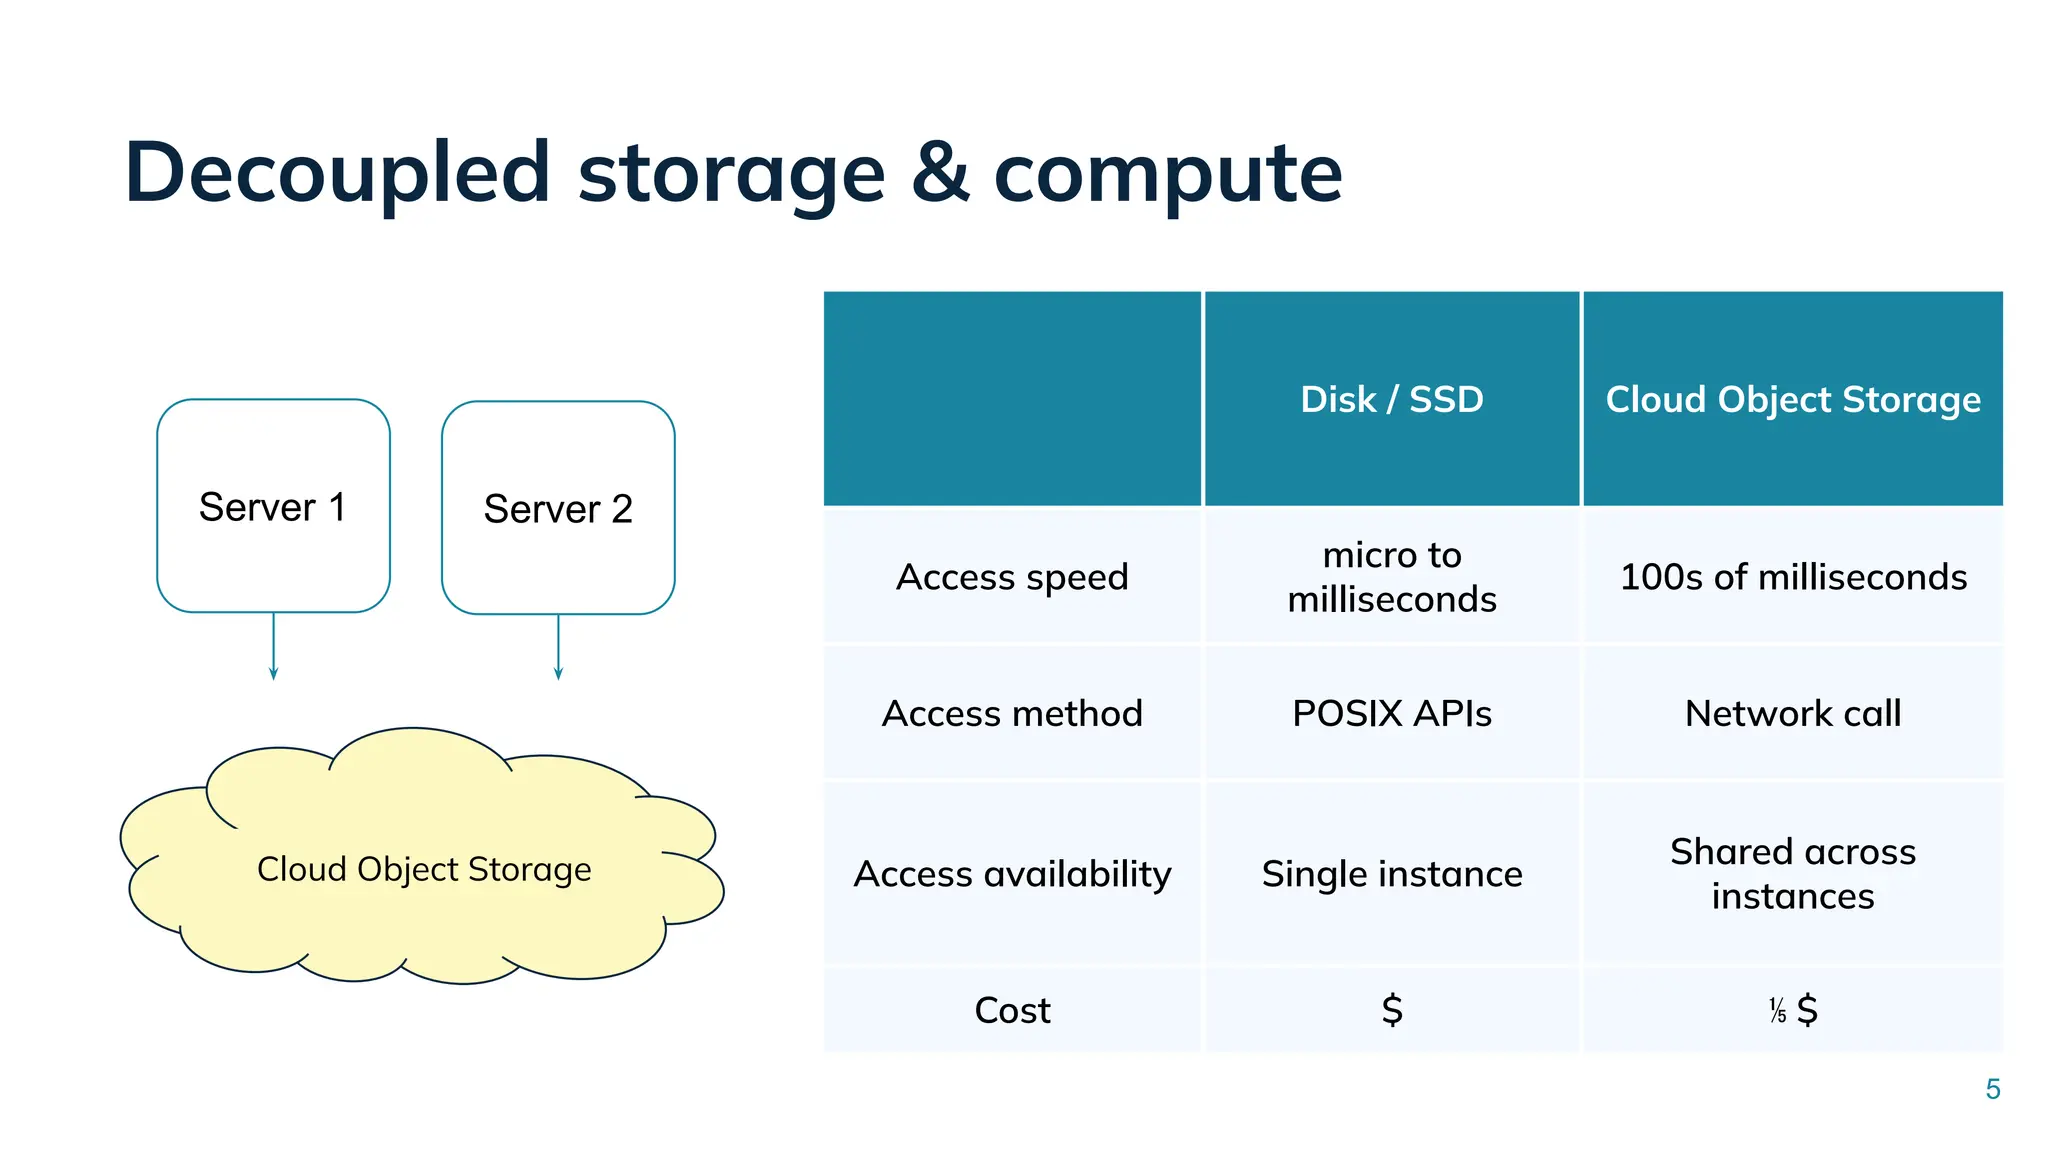
Cloud Object Storage
Recent data (eg. < =30 days)
Historical data (eg. >30 days)
tierConfigs: [{
tierS3: {
age: 30d
tierBackend: s3,
tierBackendProperties: {
region: us-west-2,
bucket: foo.bucket
}
}]
7](https://image.slidesharecdn.com/3optimizingtieredstorageforlow-latencyreal-timeanalyticsataiscale-250717191645-ba1e7ae4/75/Optimizing-Tiered-Storage-for-Low-Latency-Real-Time-Analytics-at-AI-Scale-7-2048.jpg)
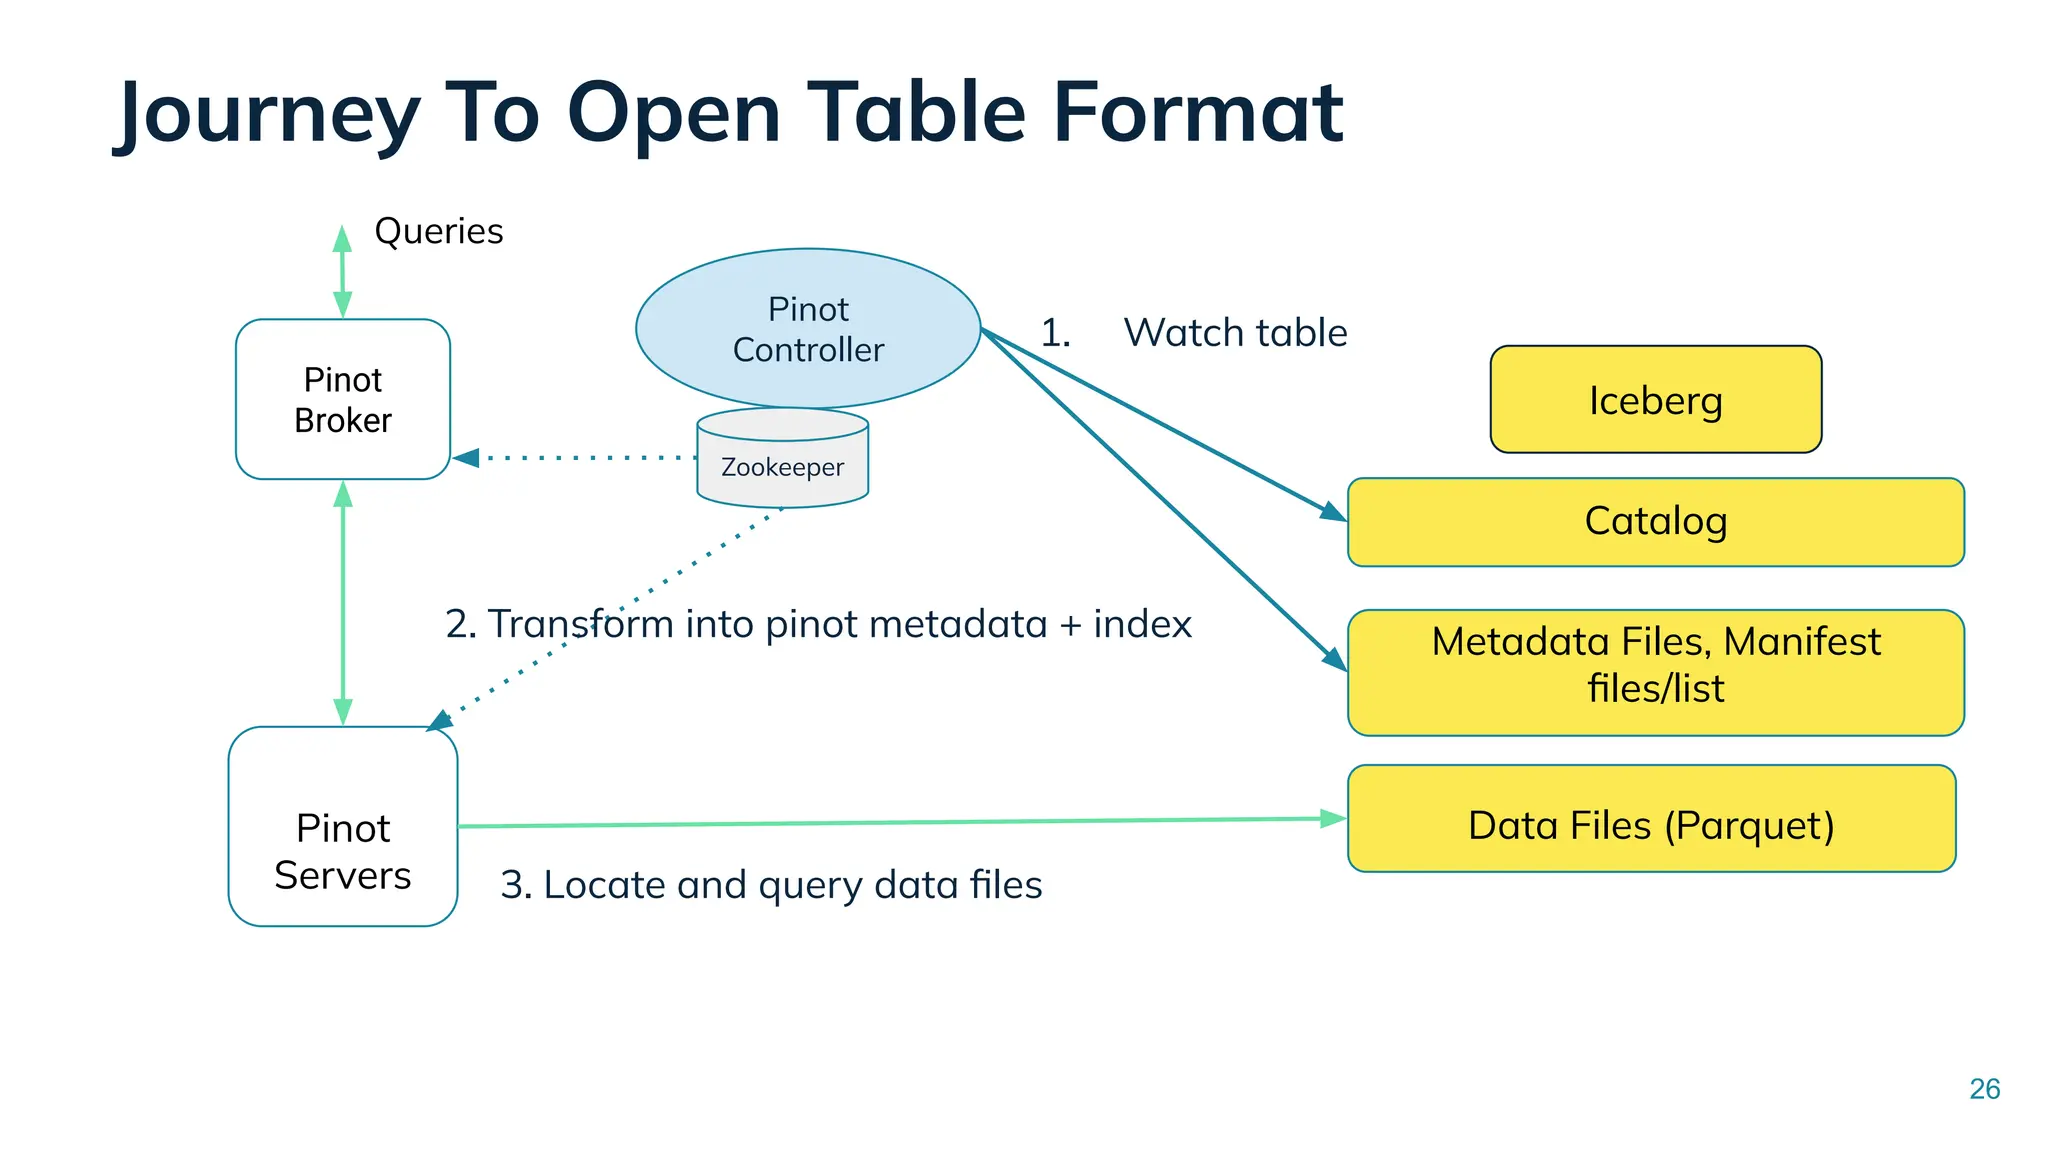

Low Latency Data Systems for Real-Time AI Meetup July 15, 2025 For more Alluxio Events: https://www.alluxio.io/events/ Speaker: - Songqiao Su(Staff Software Engineer @ StarTree) In this talk, Songqiao Su from StarTree will explore the engineering challenges of extending Apache Pinot—a real-time OLAP system—onto cloud object storage while still maintaining sub-second P99 latencies.