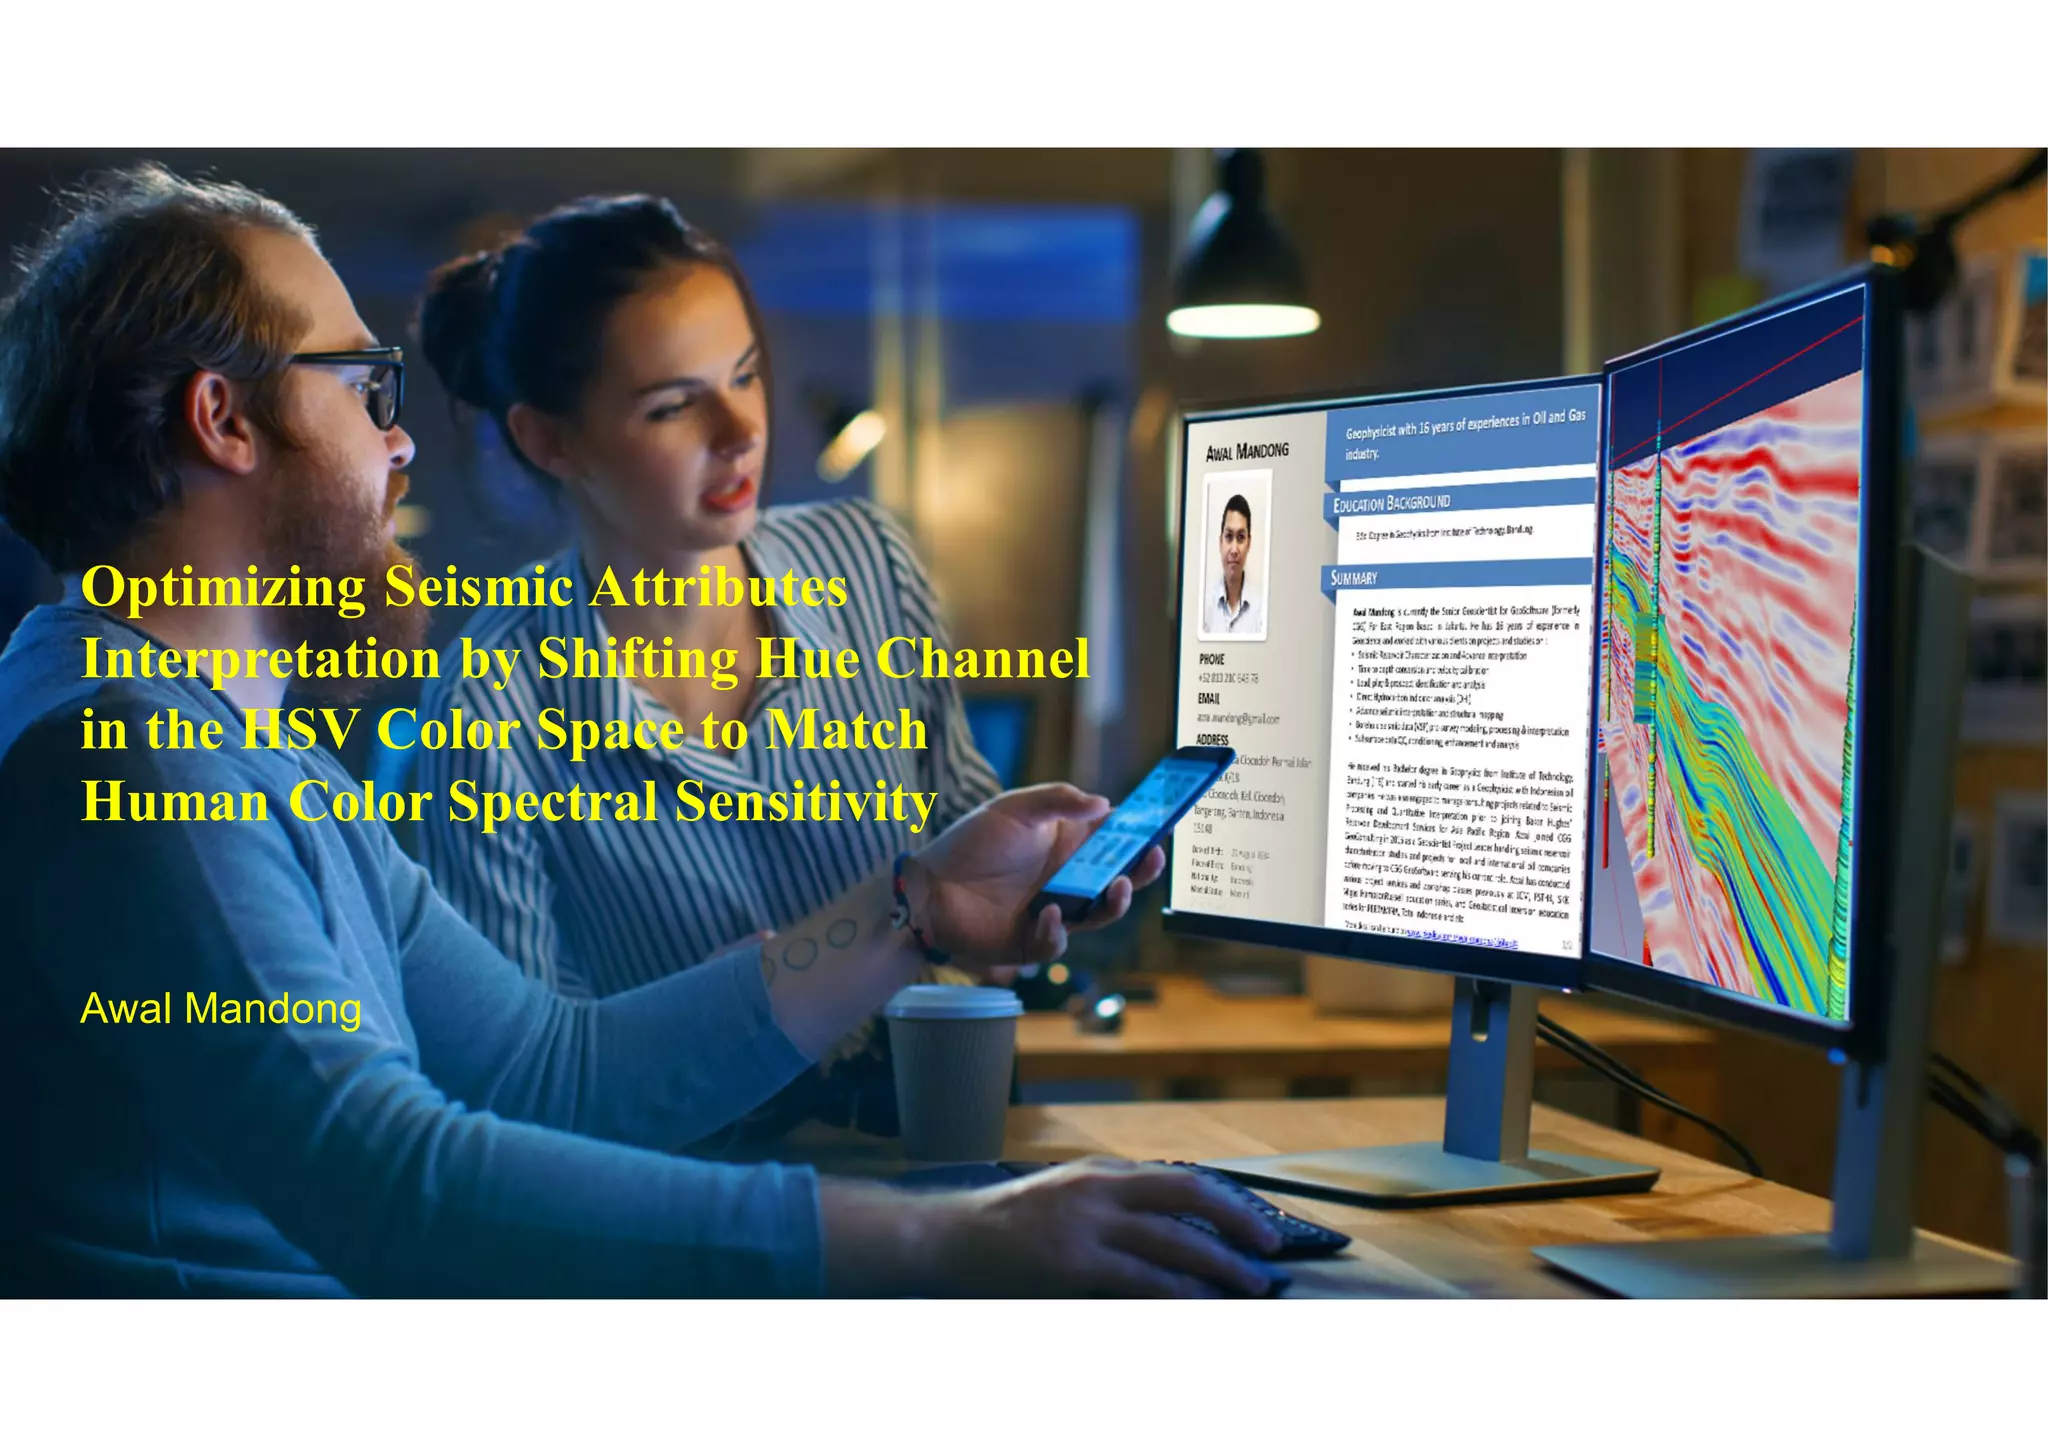
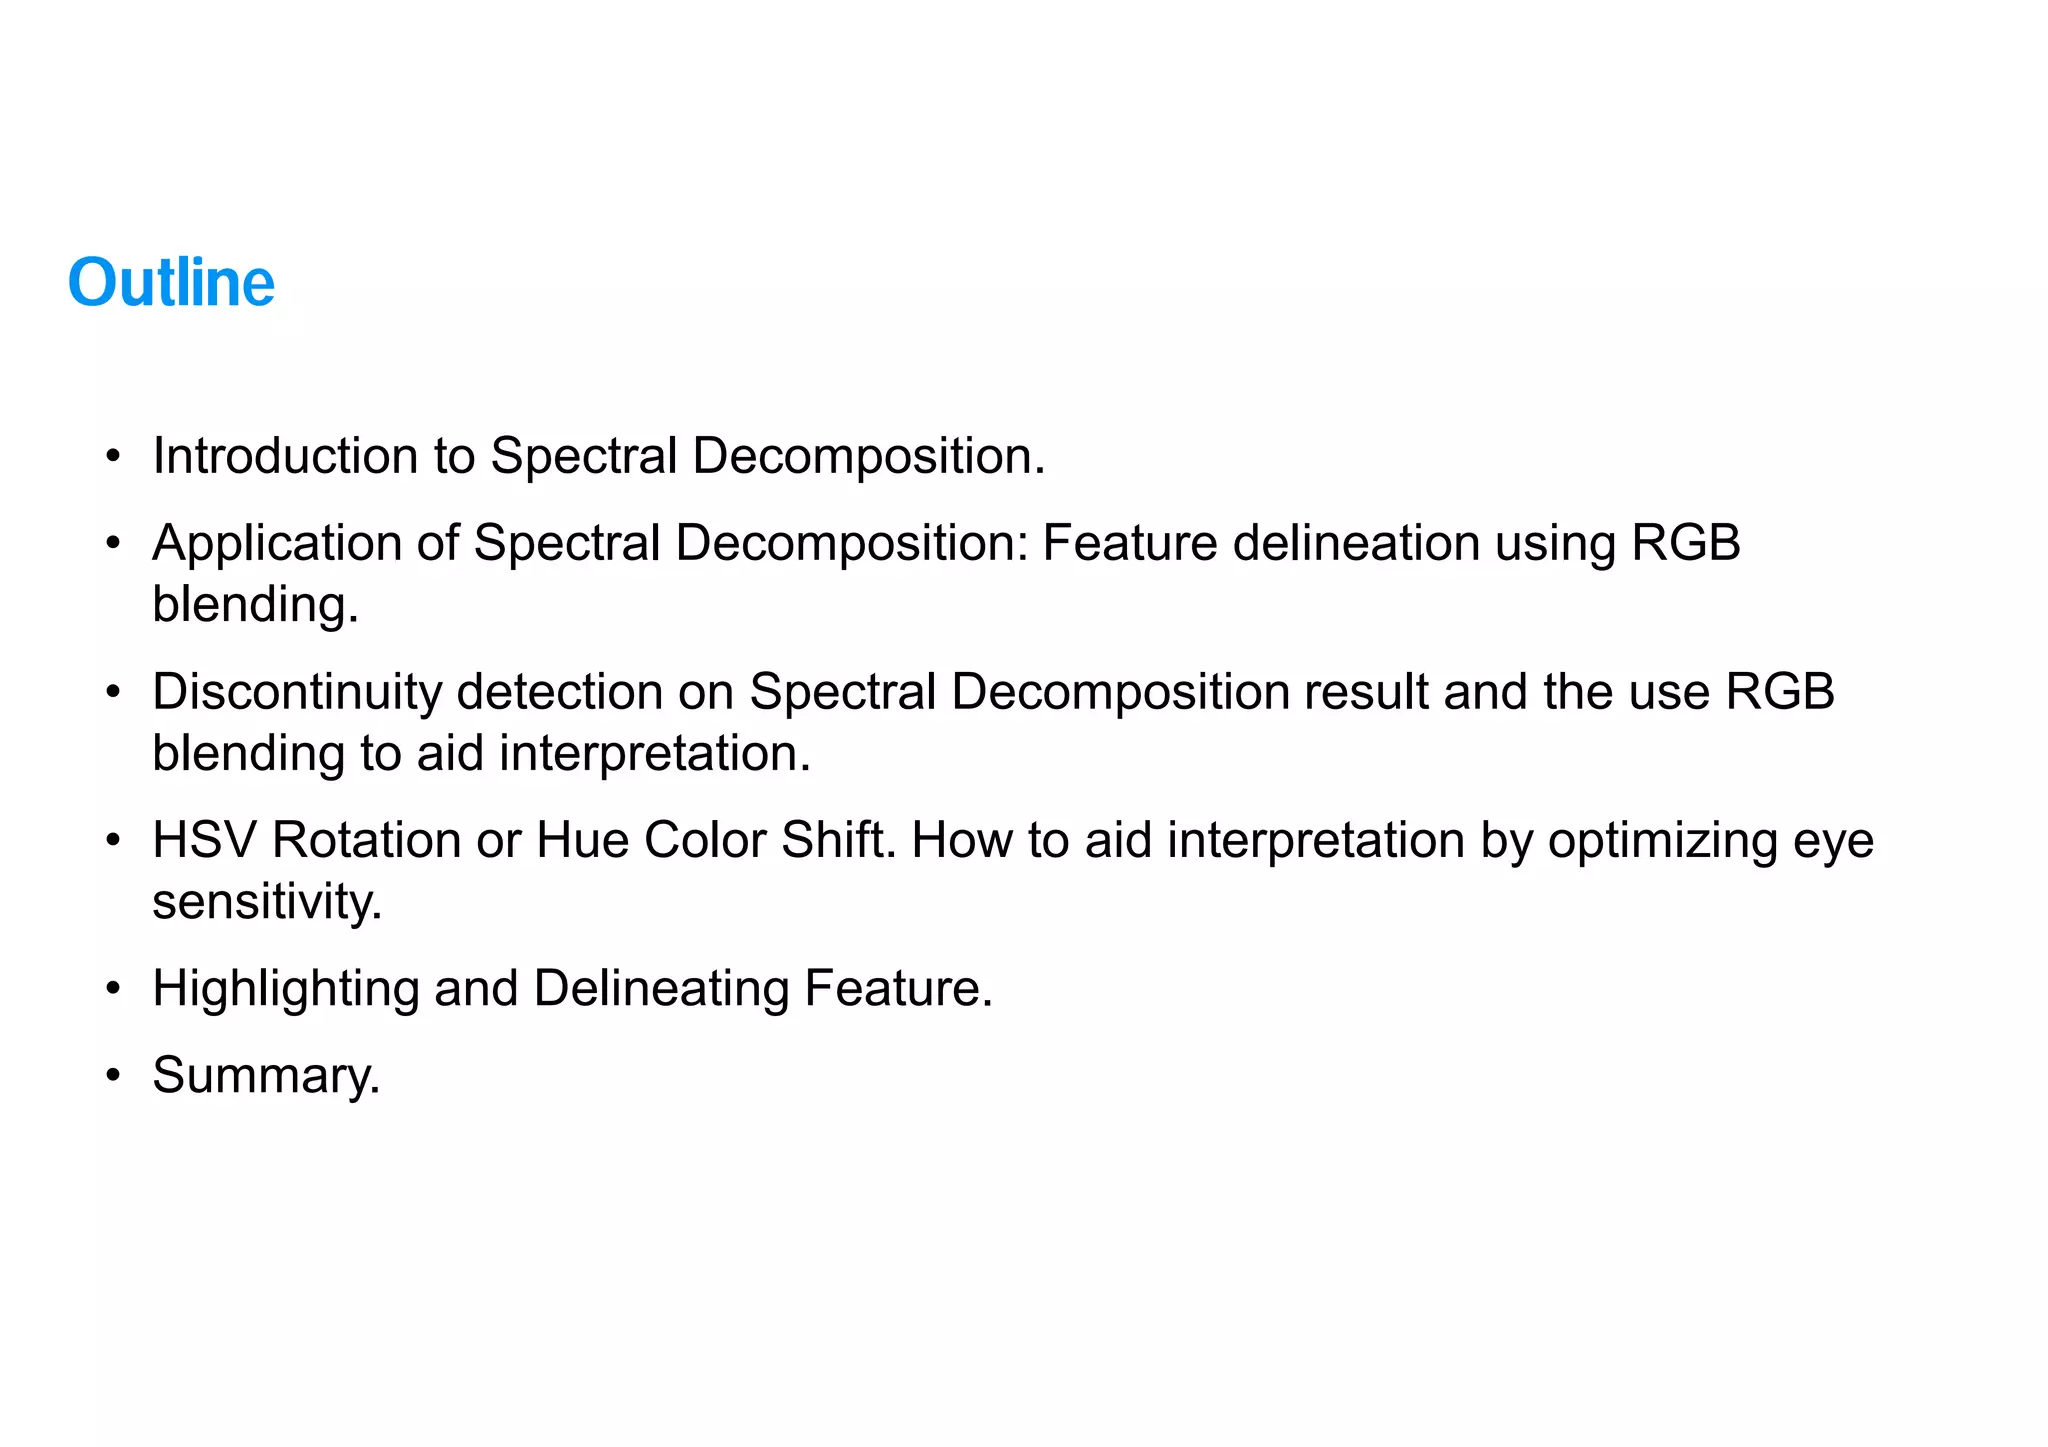
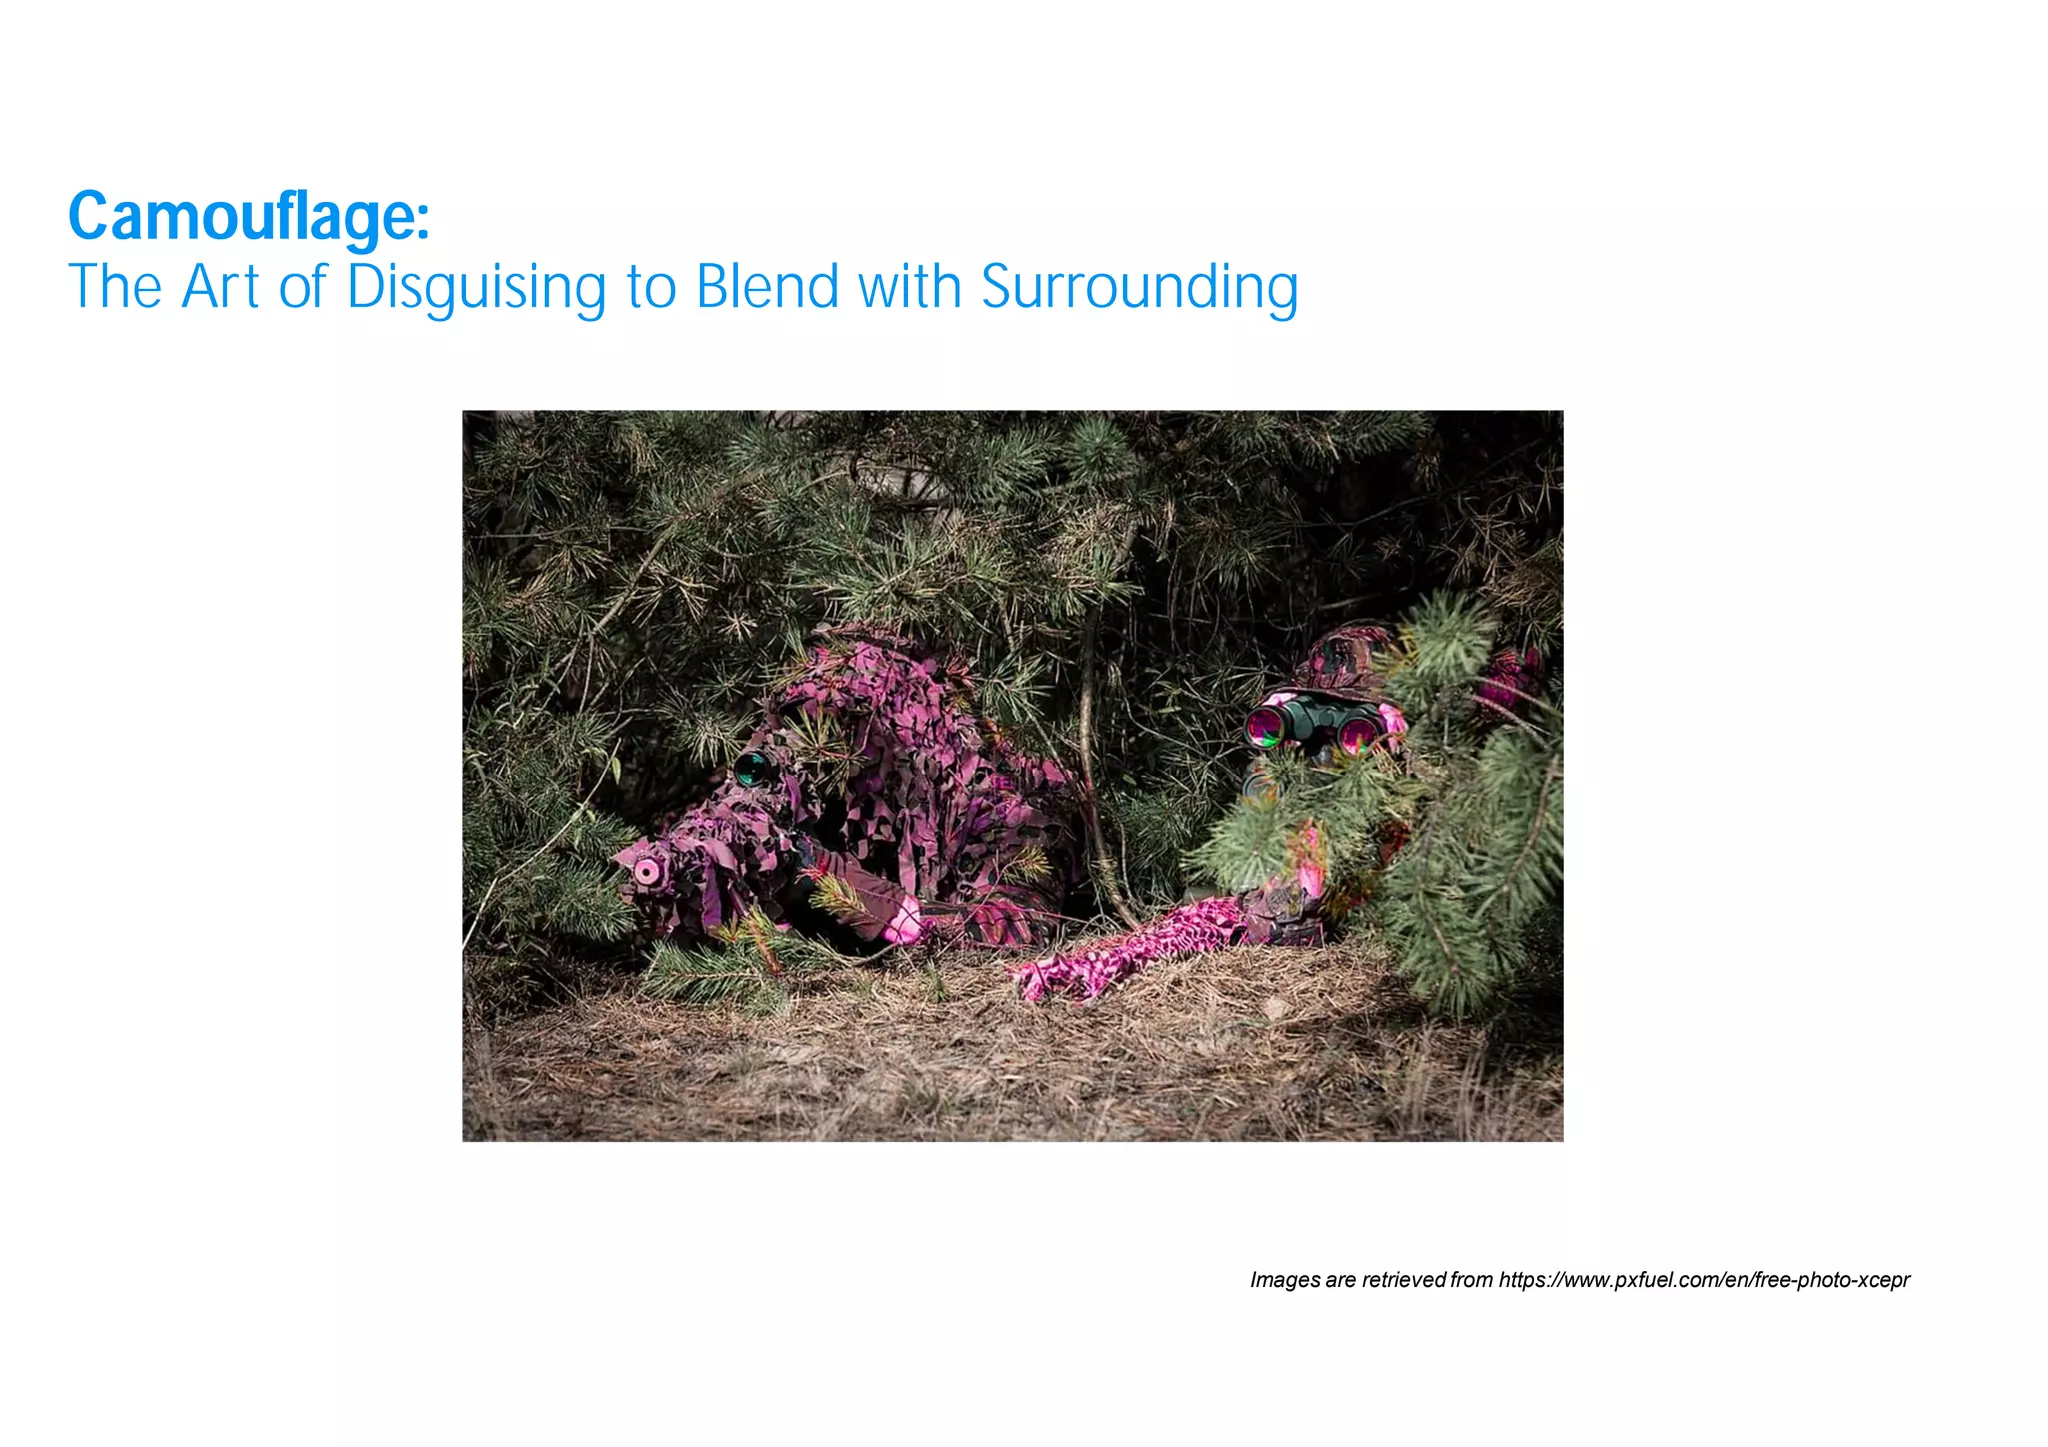
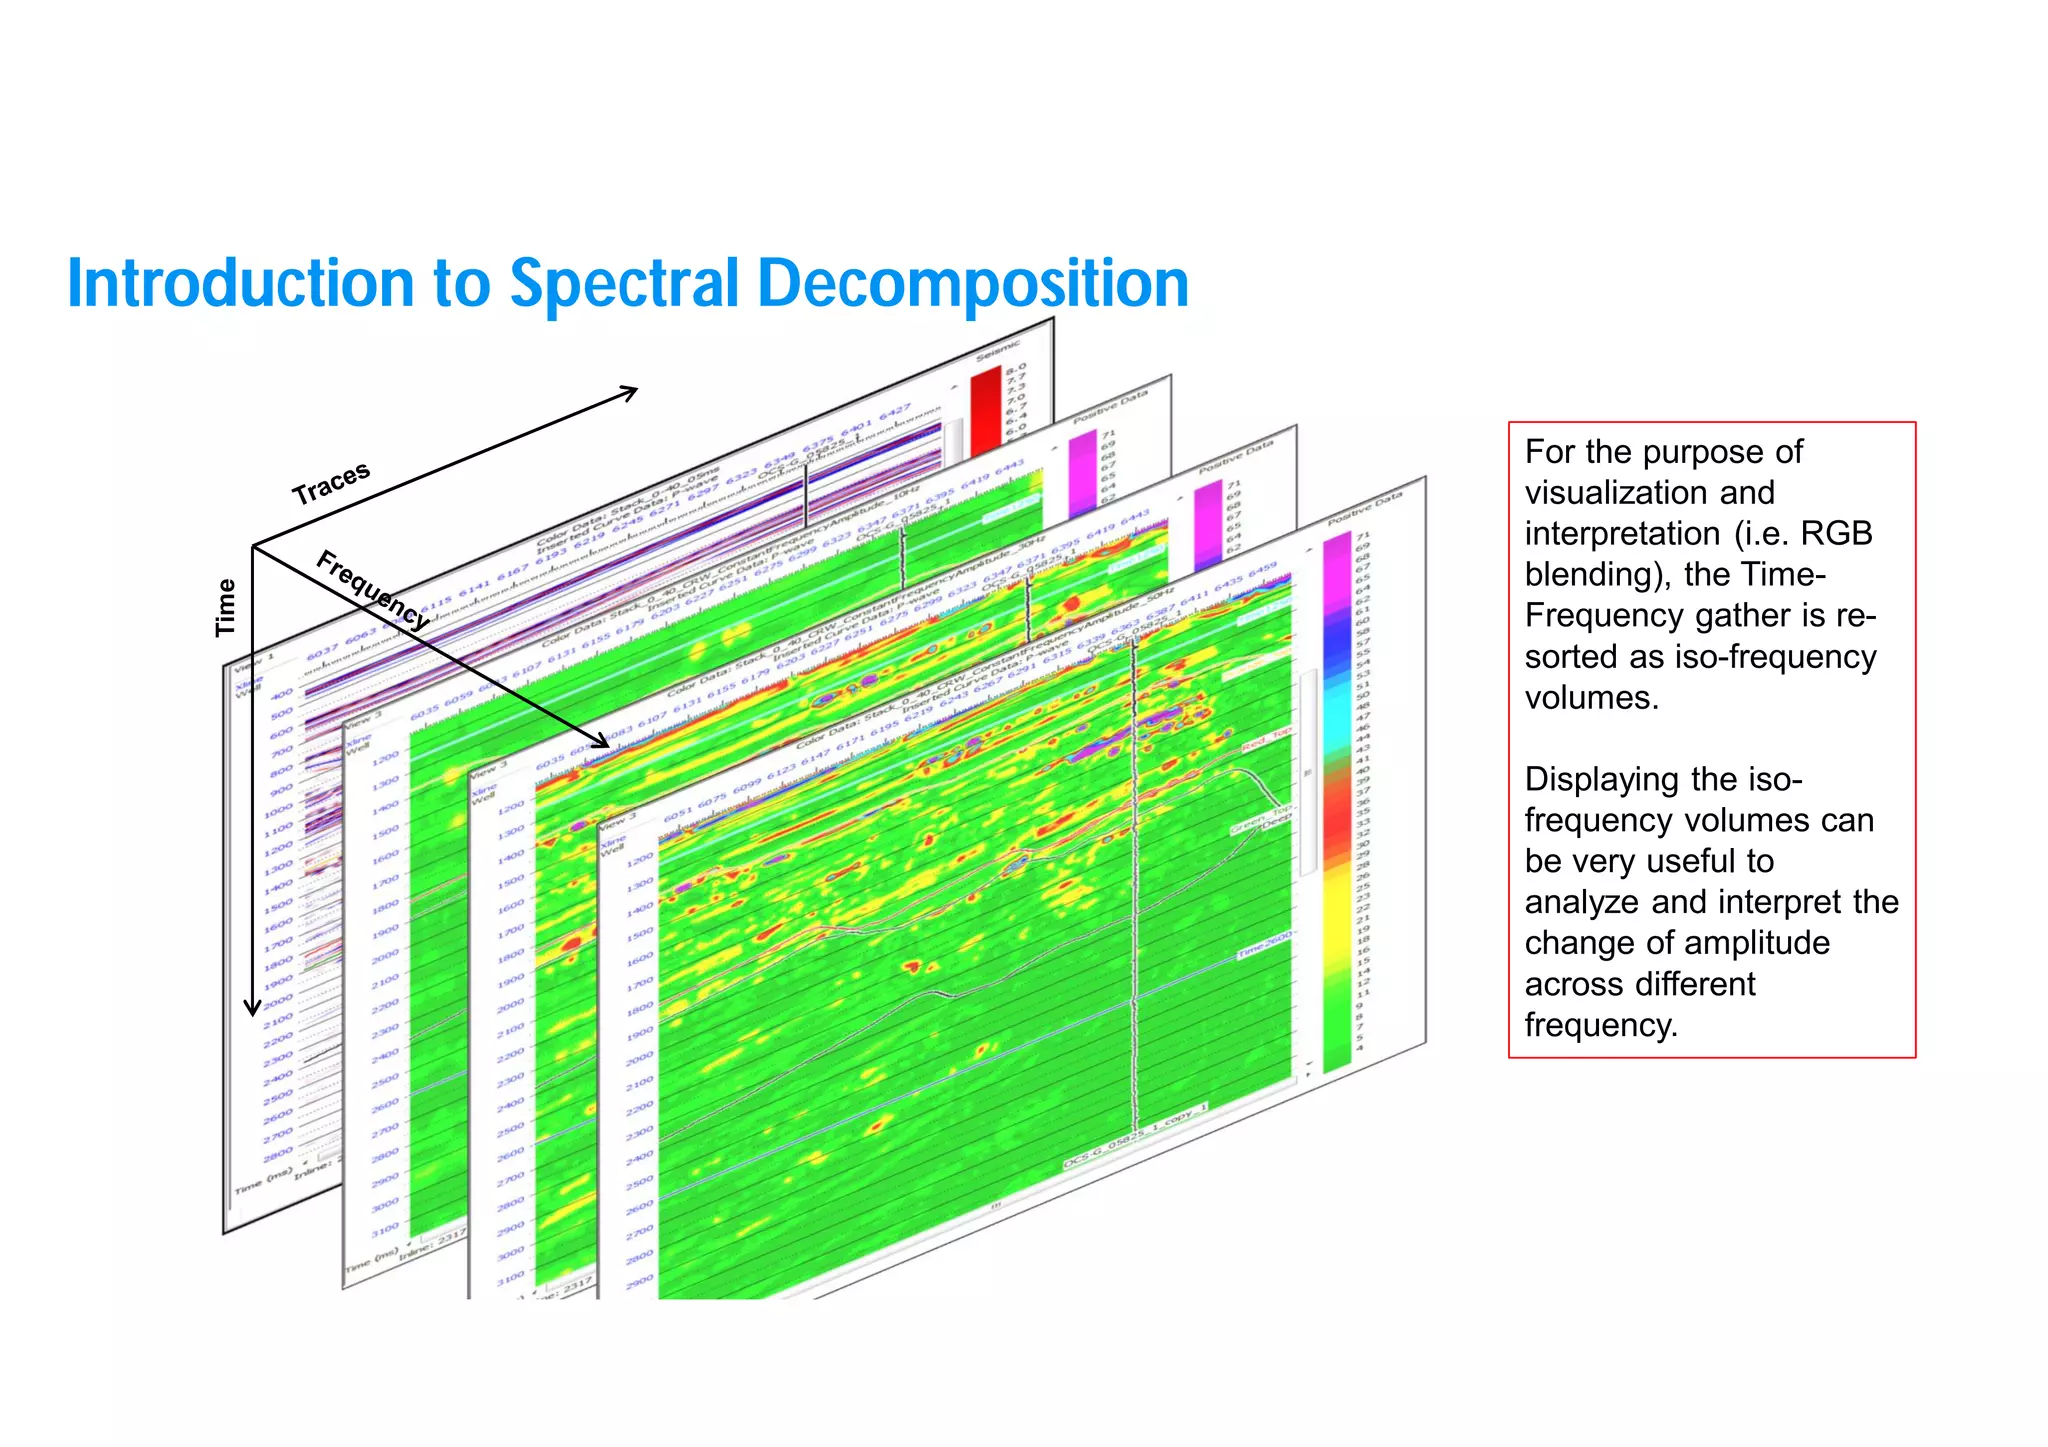
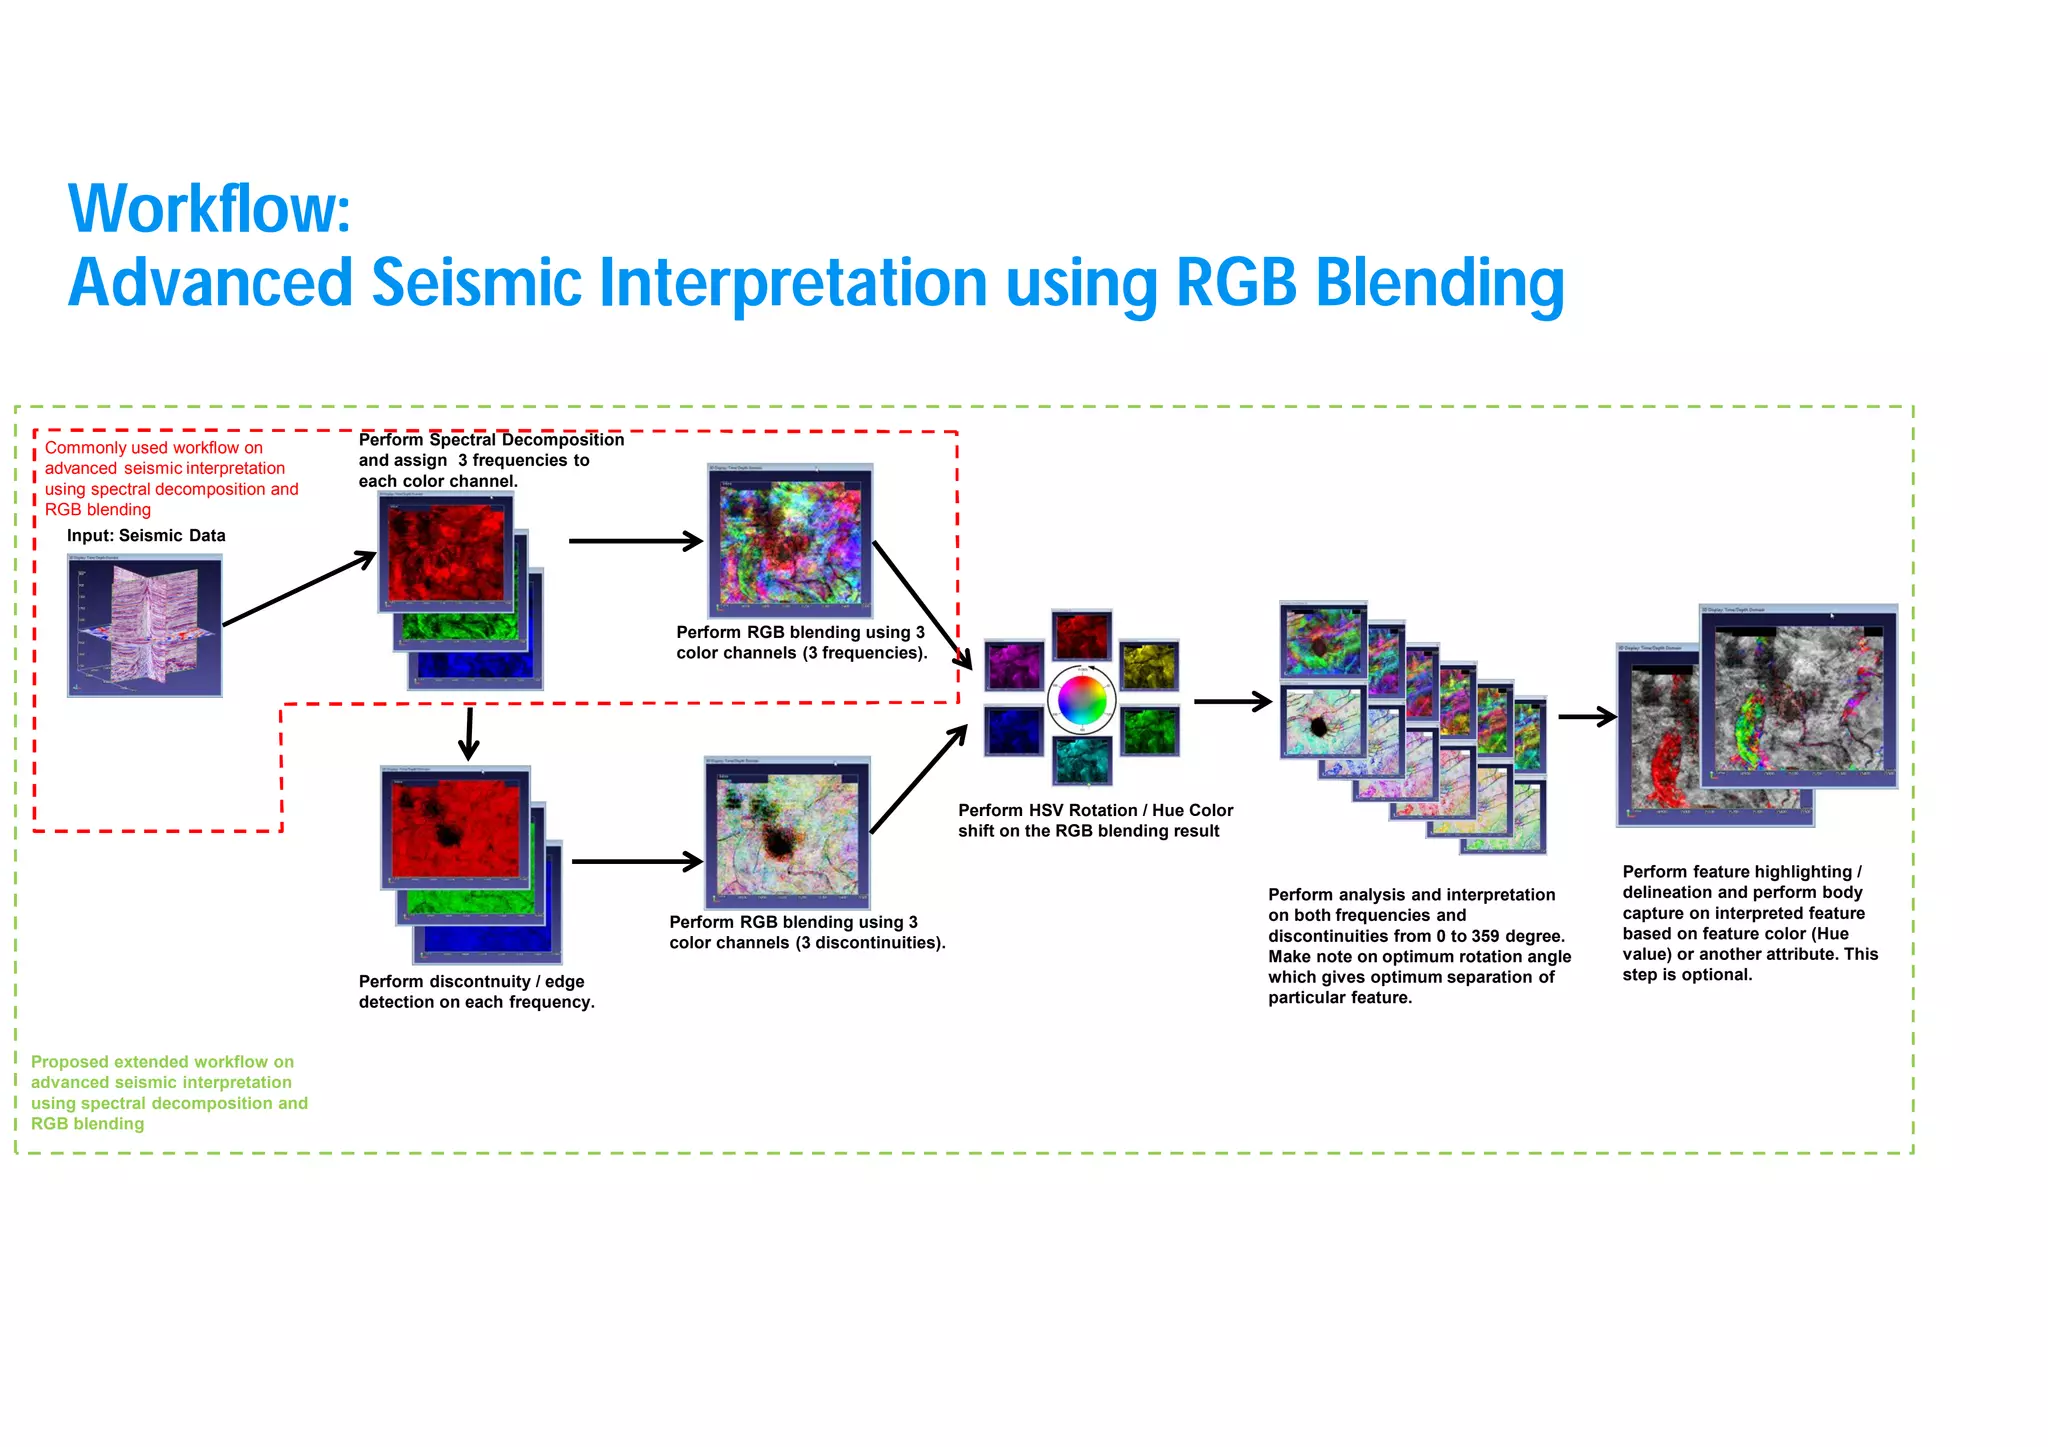
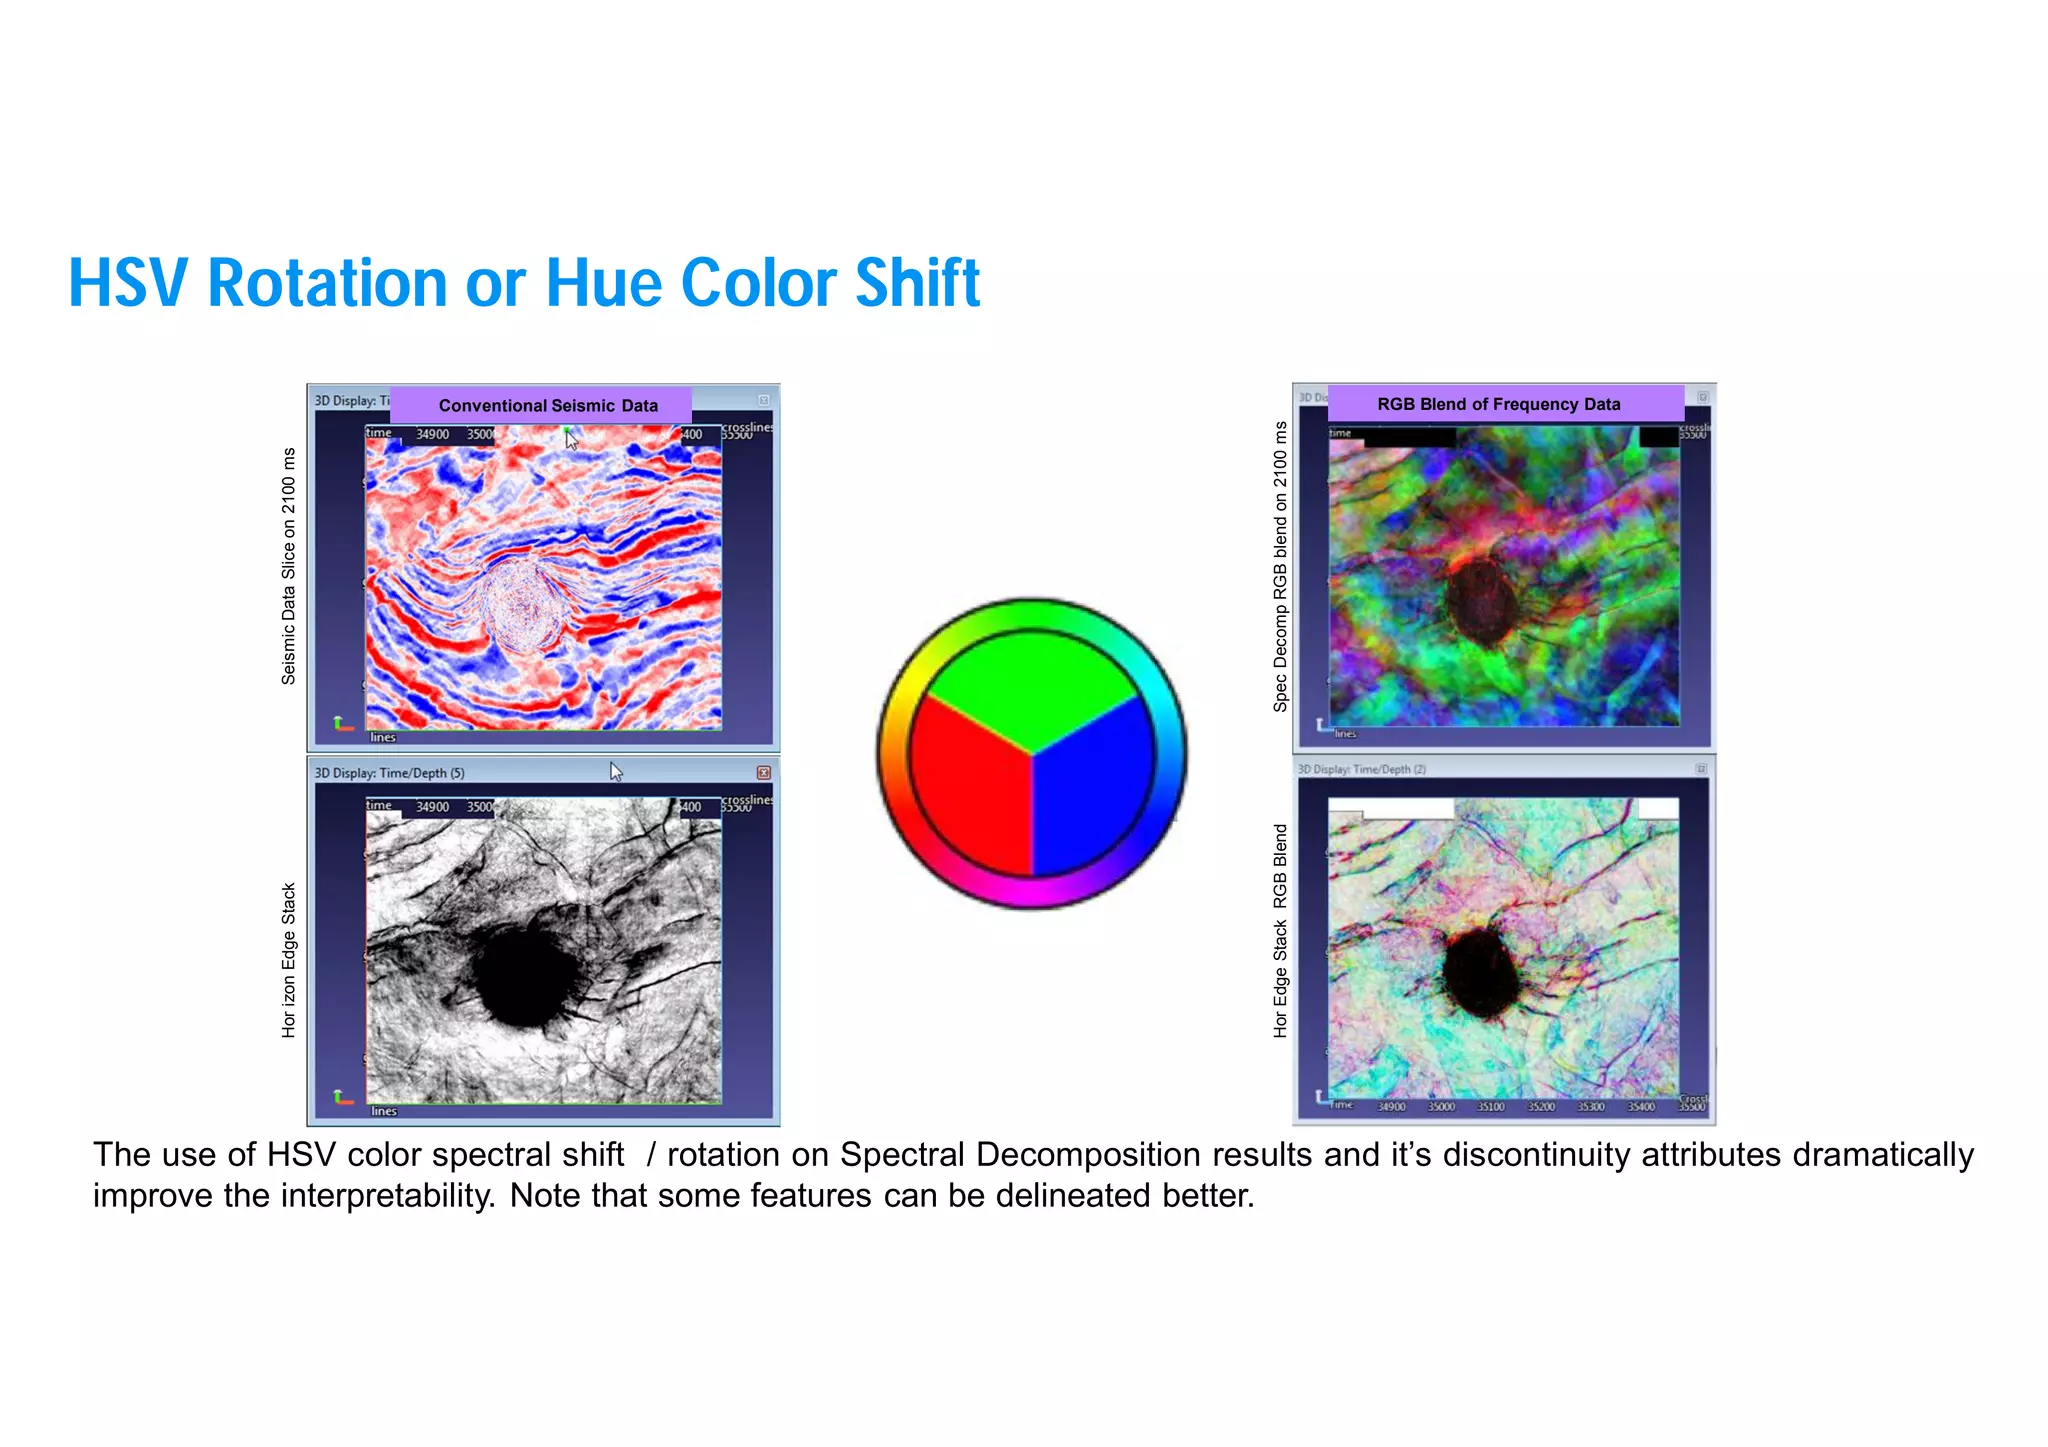
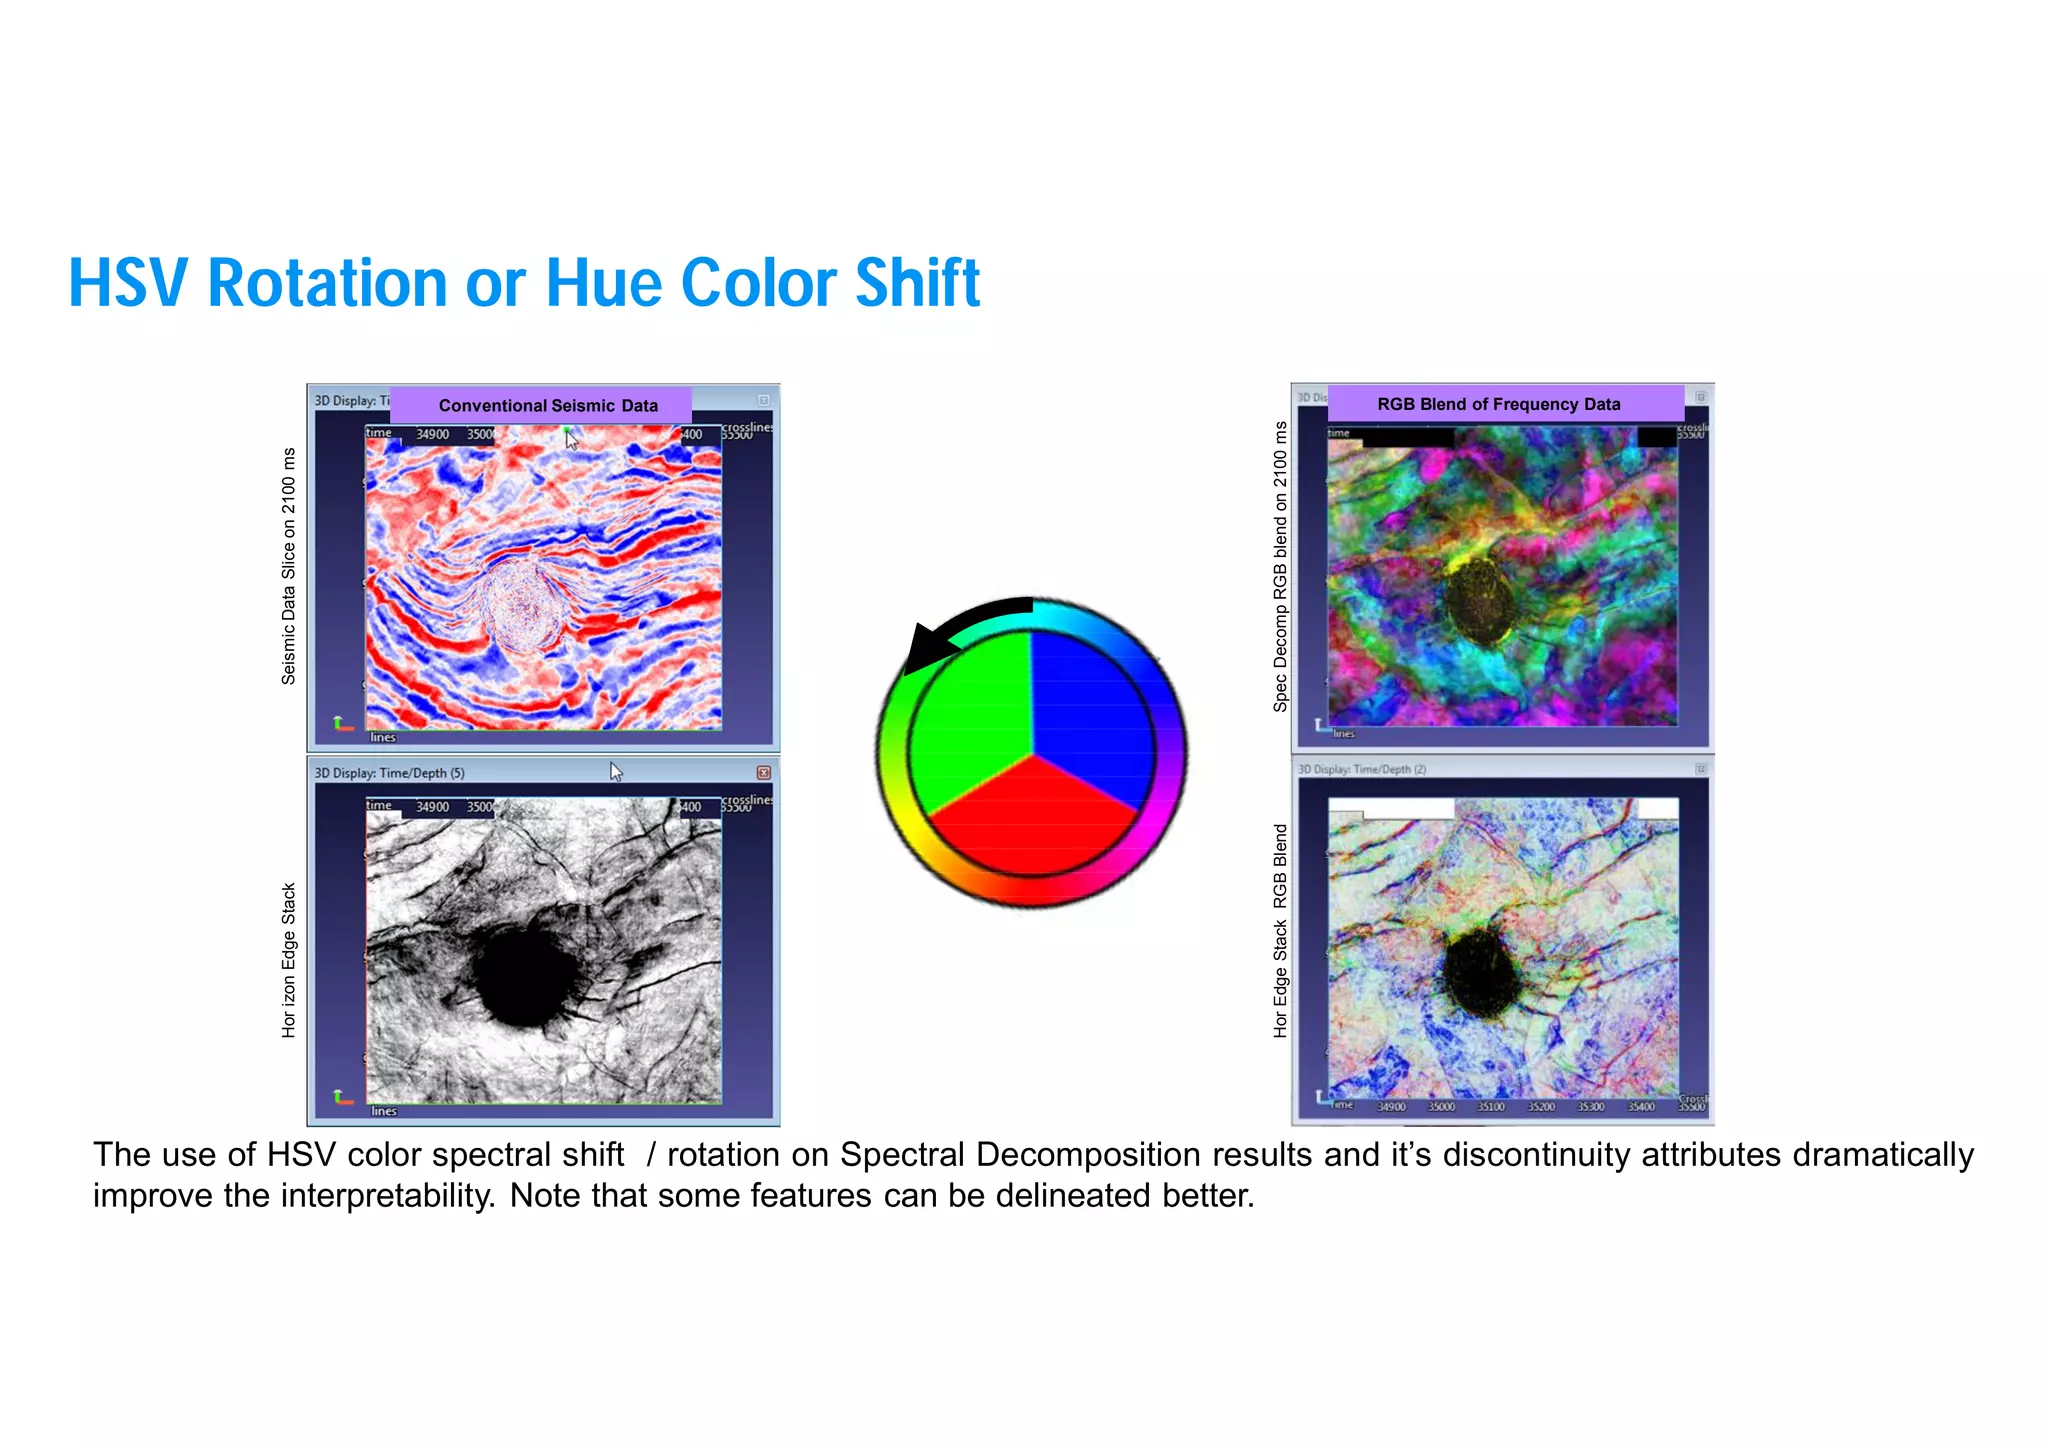
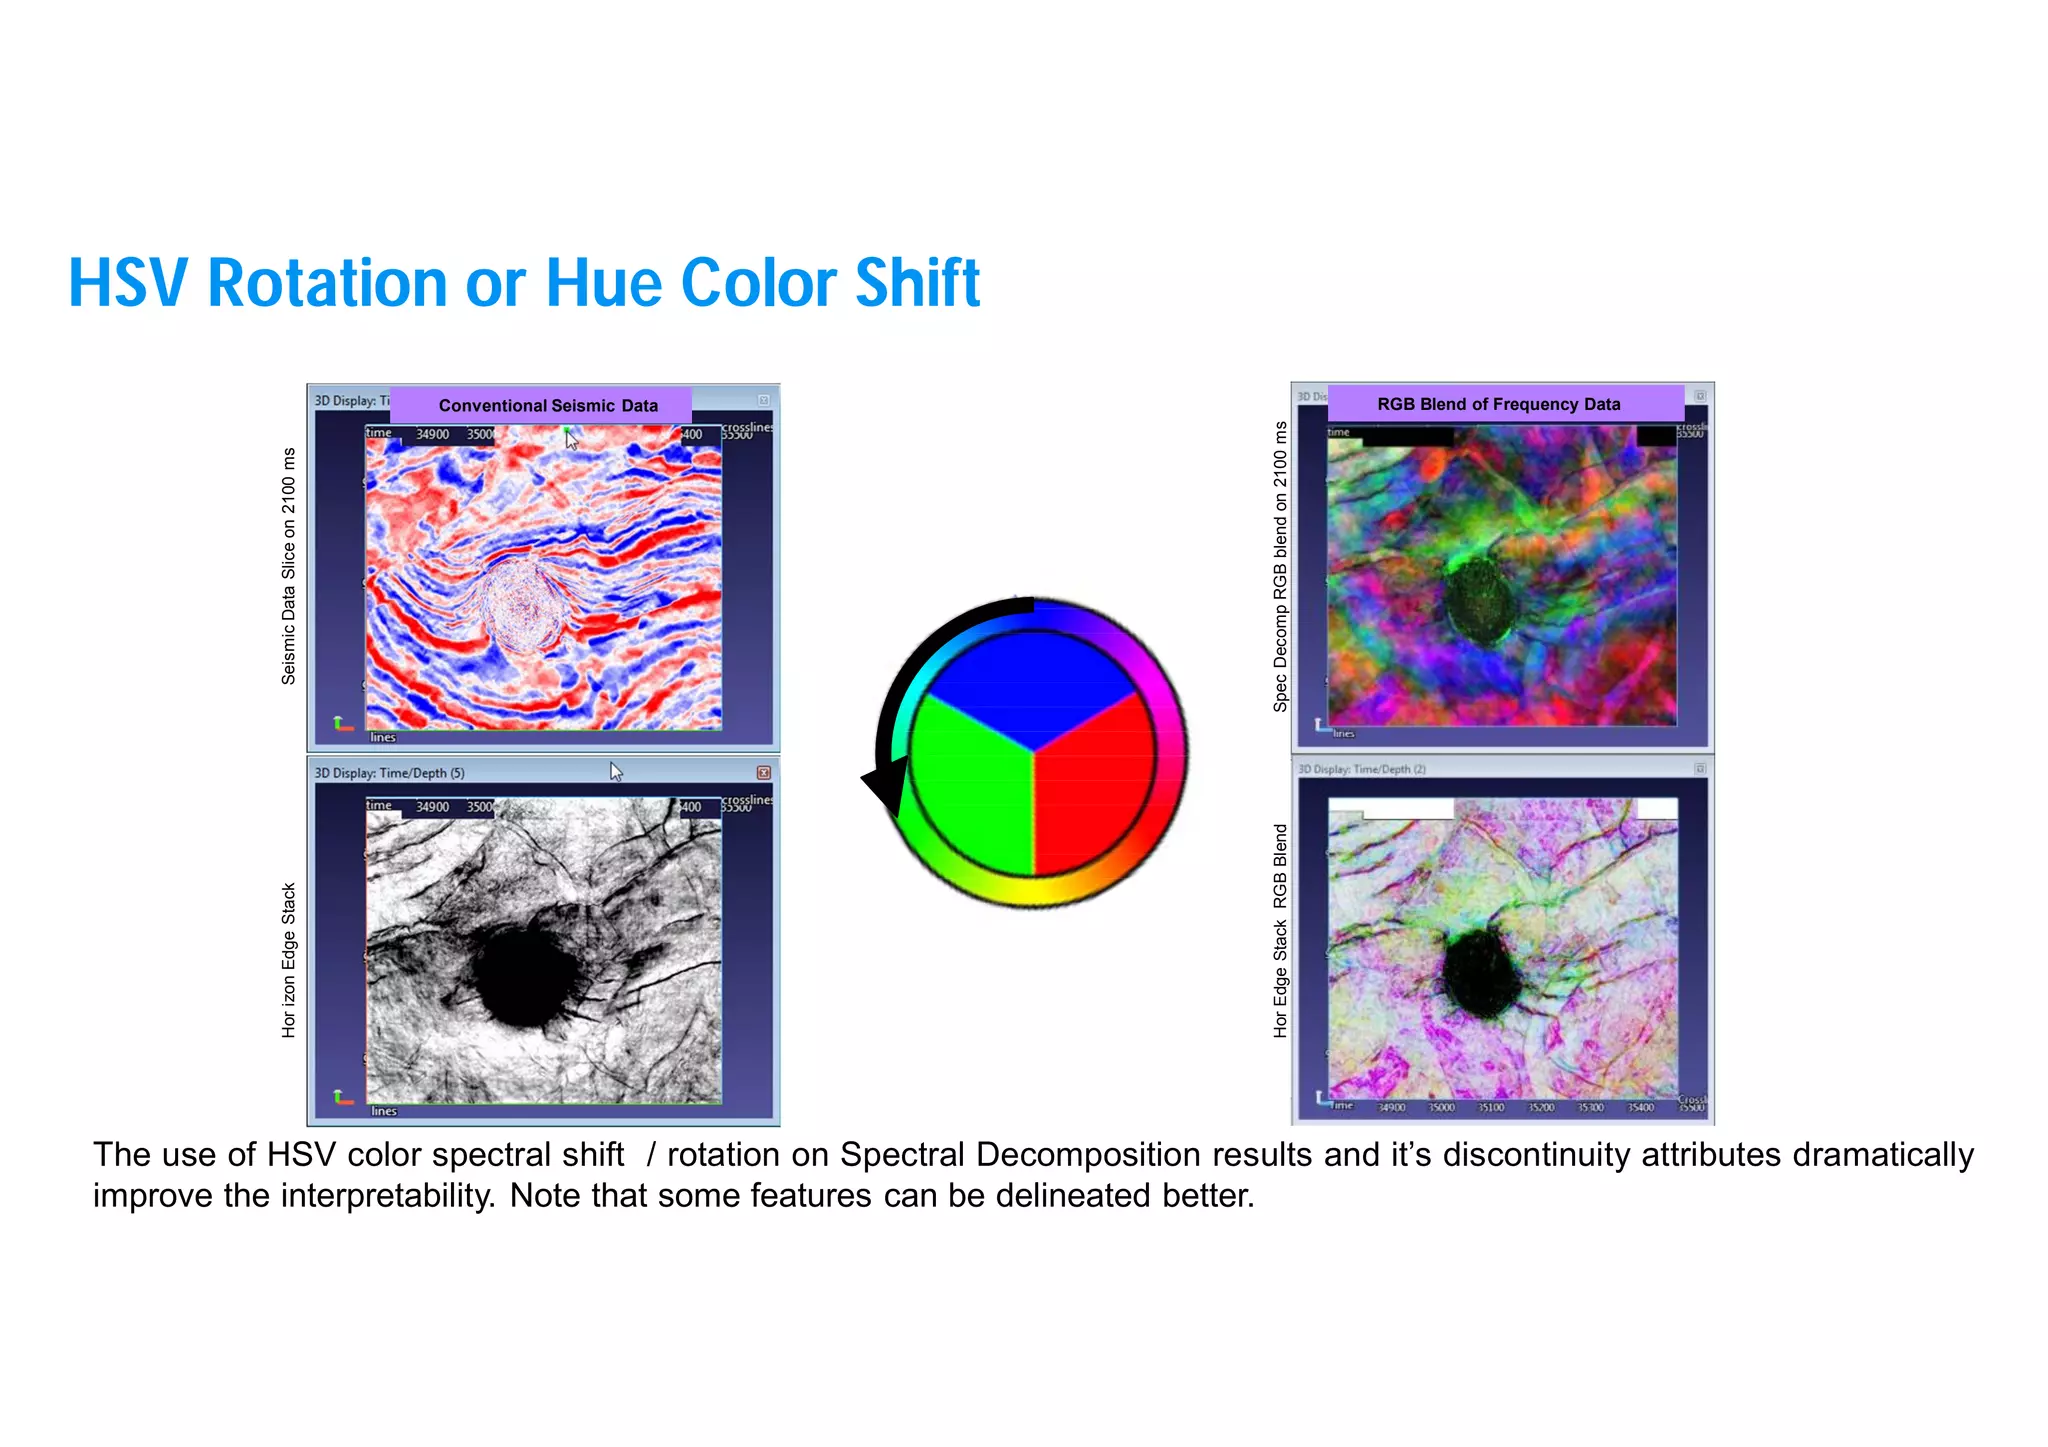
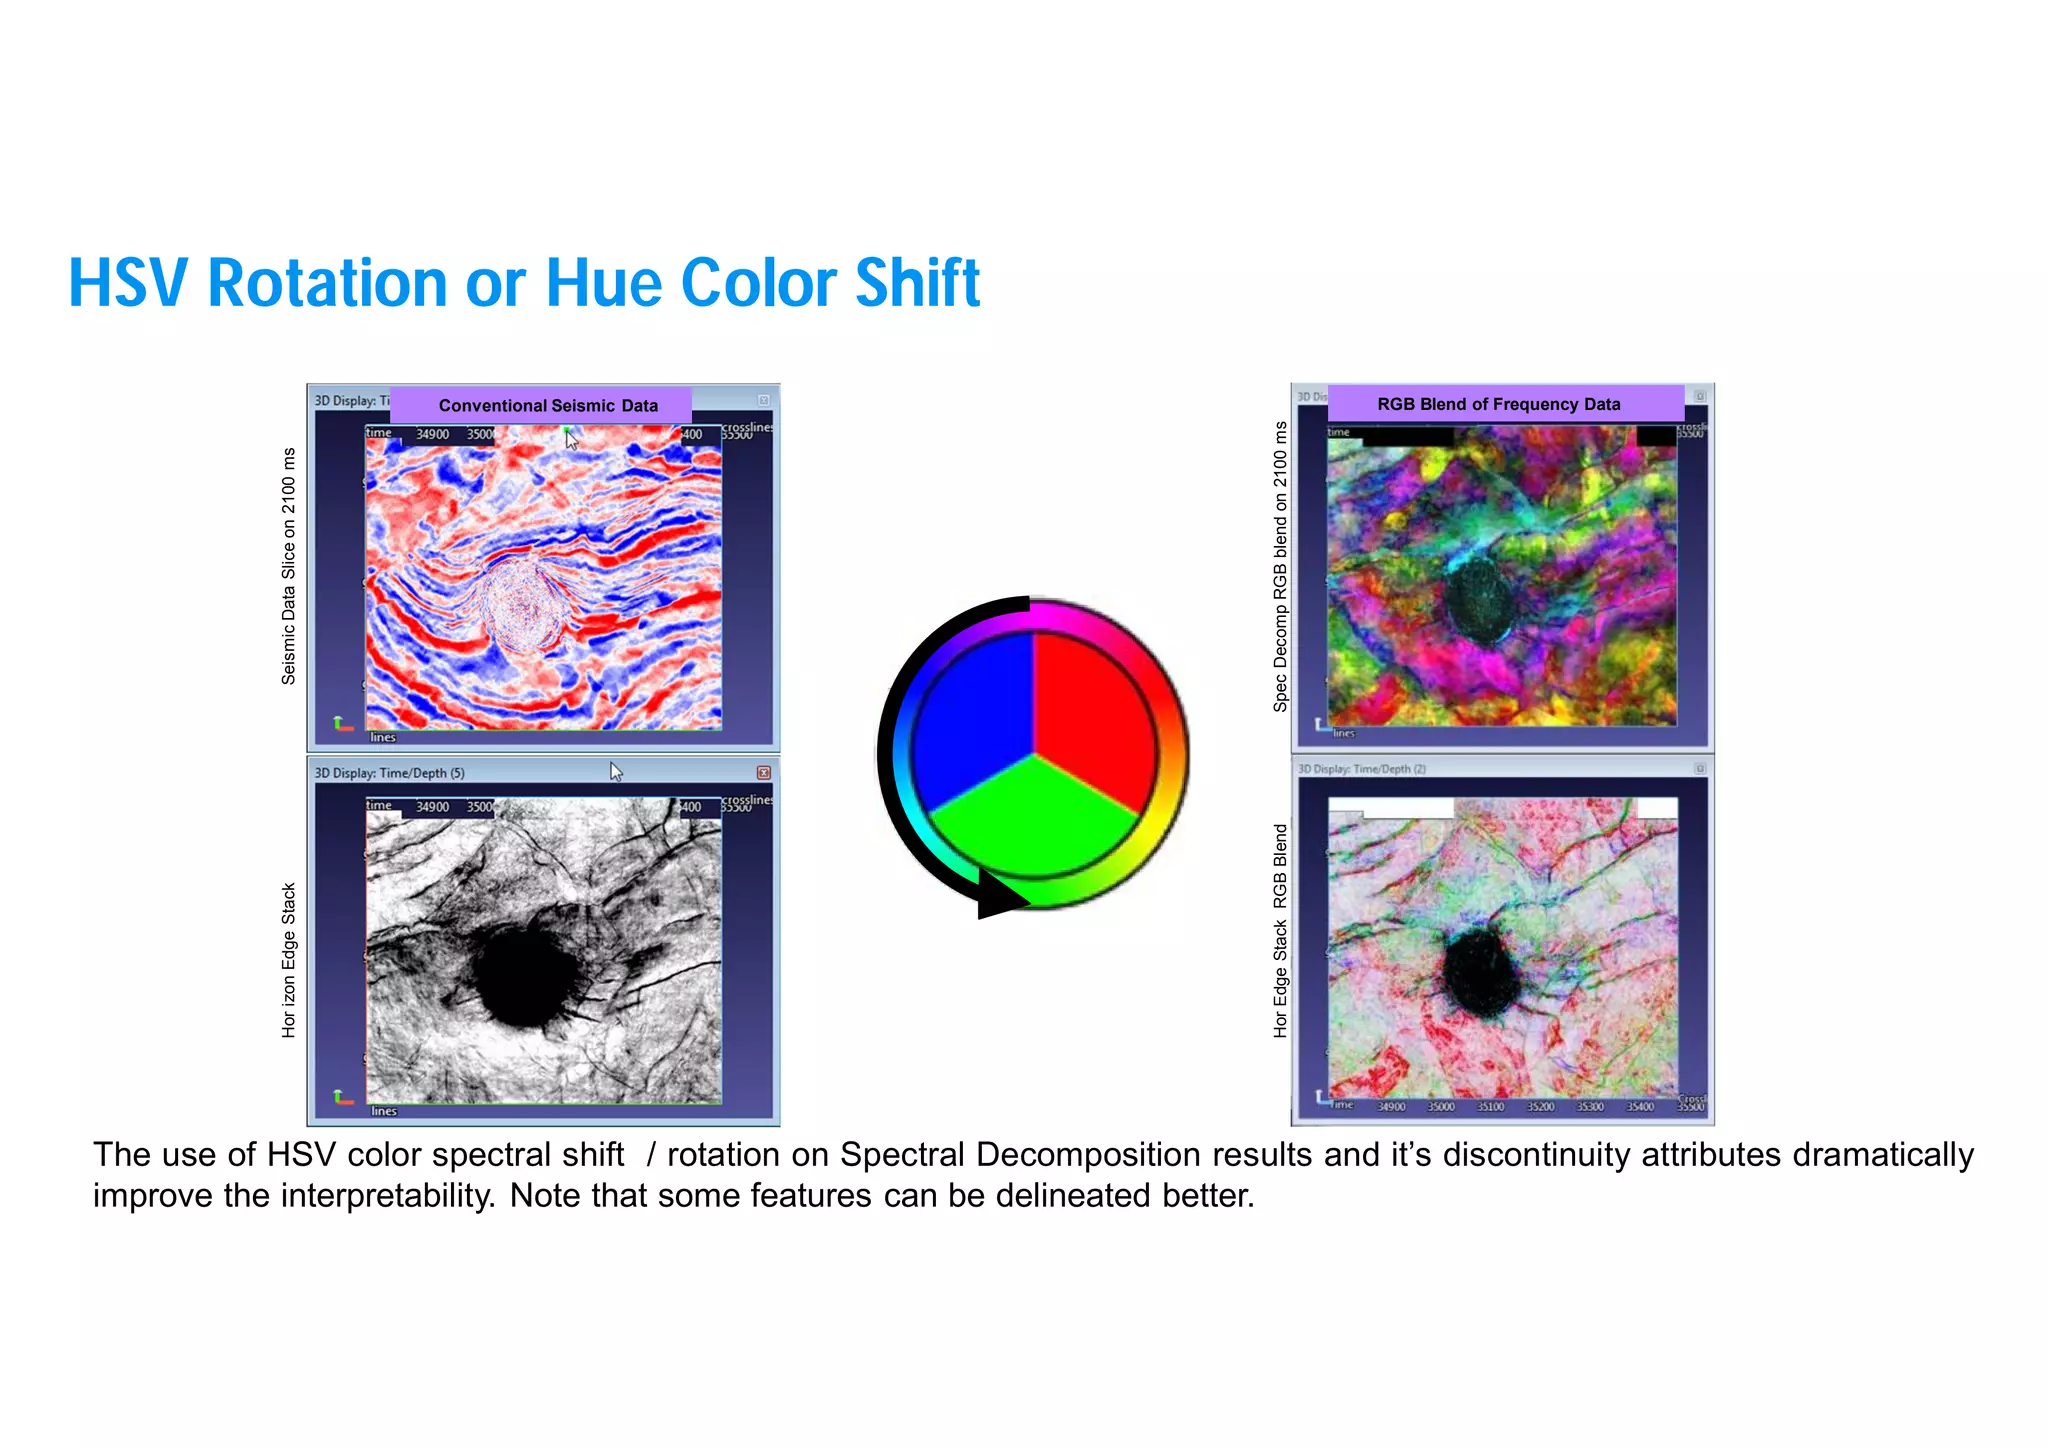
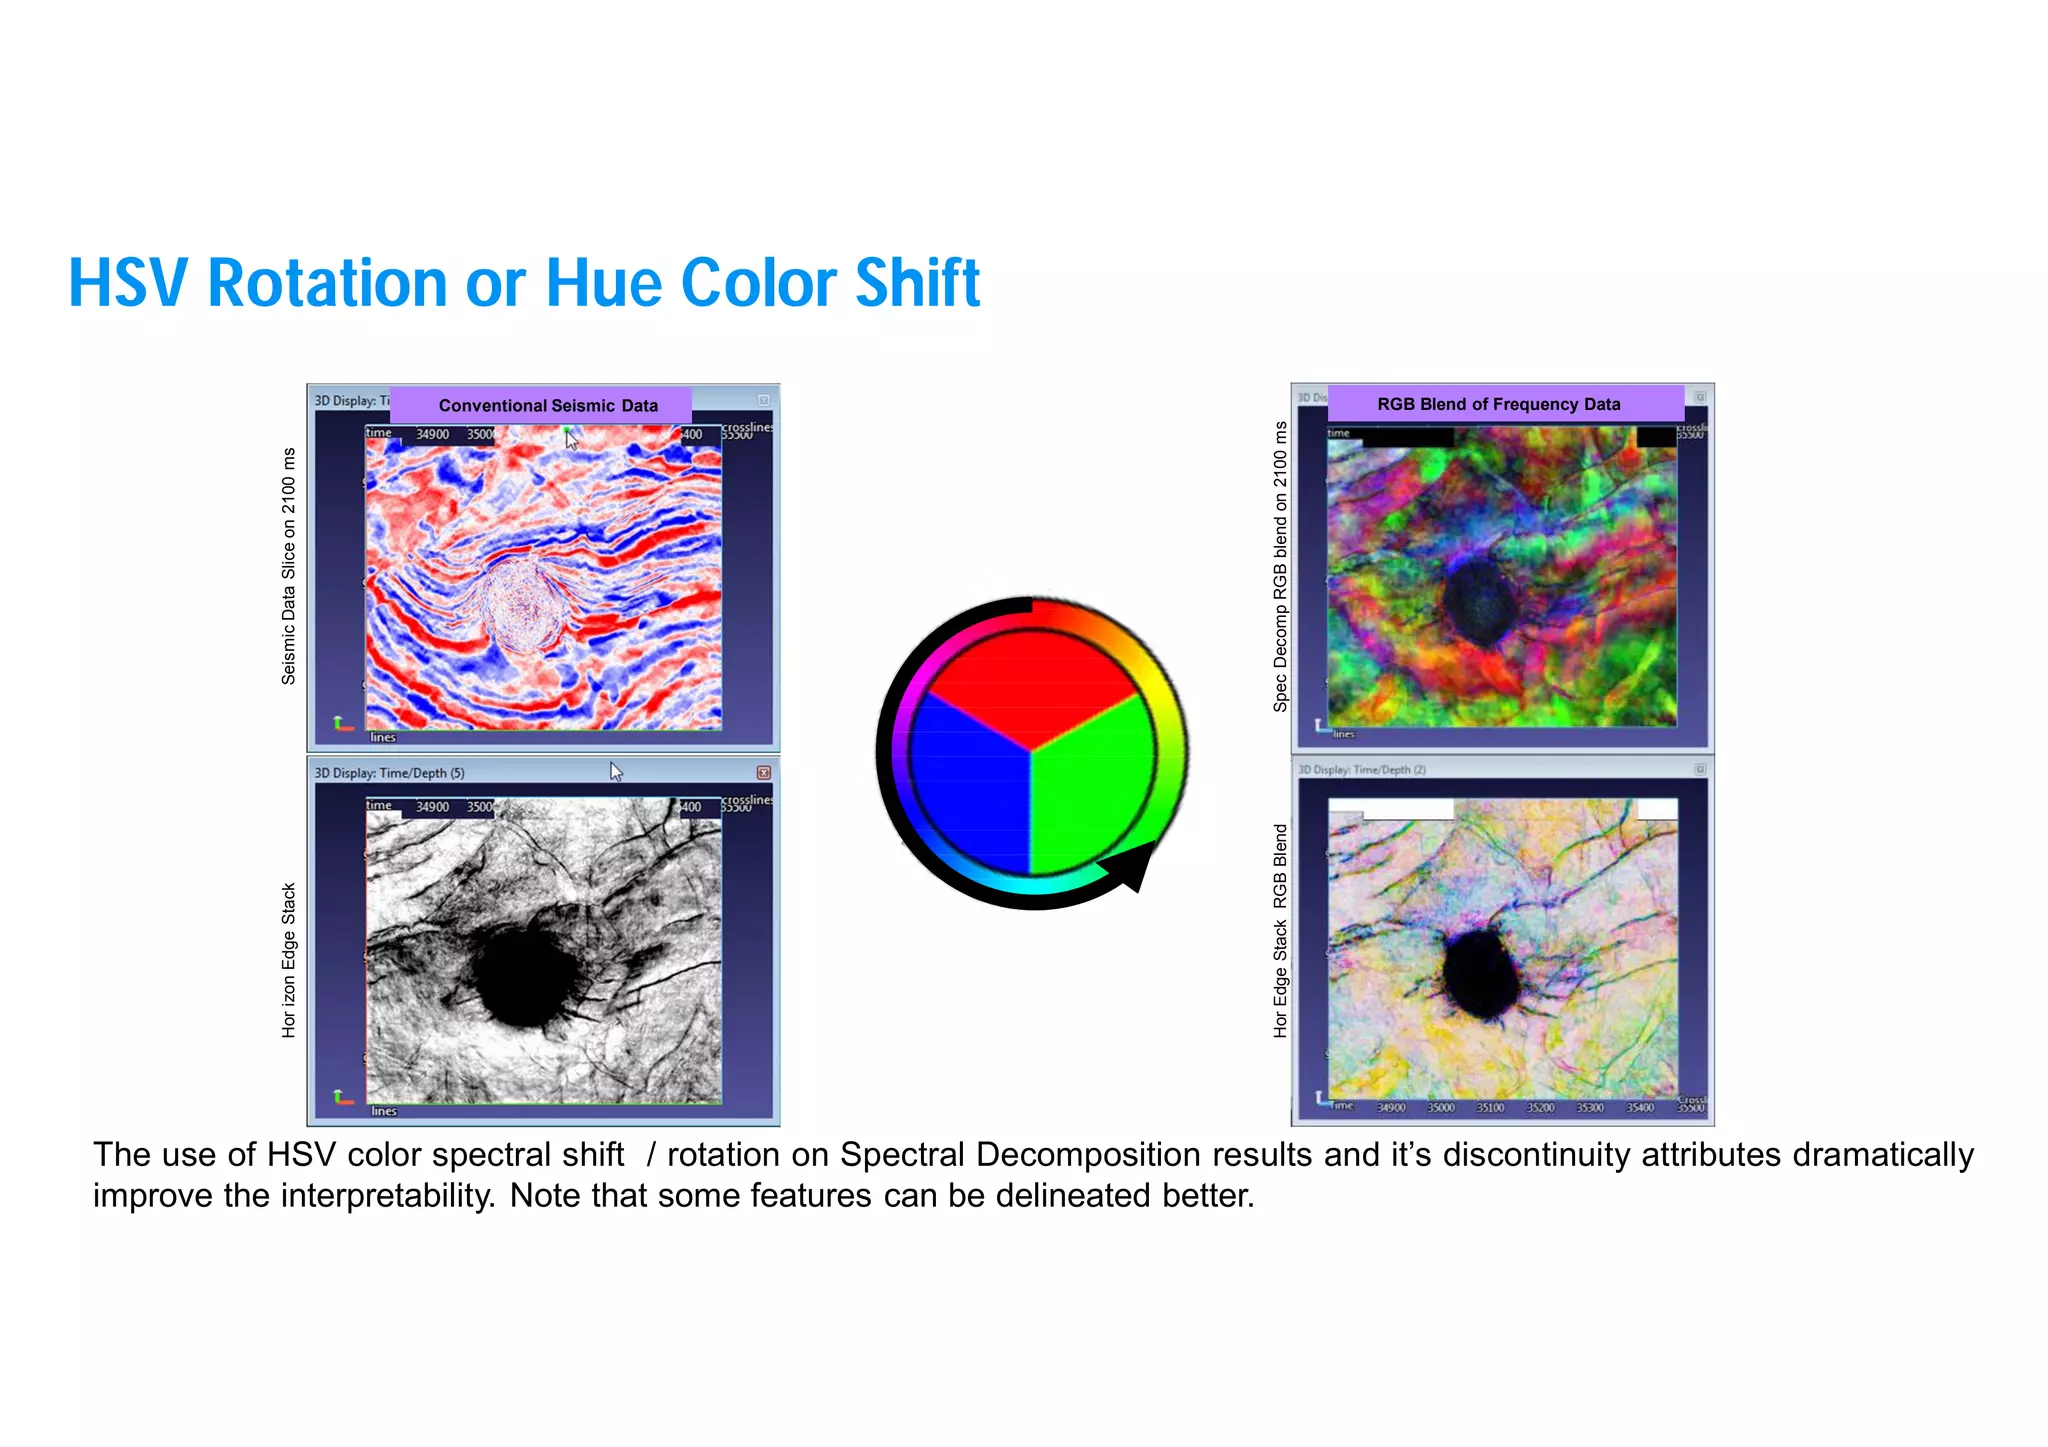
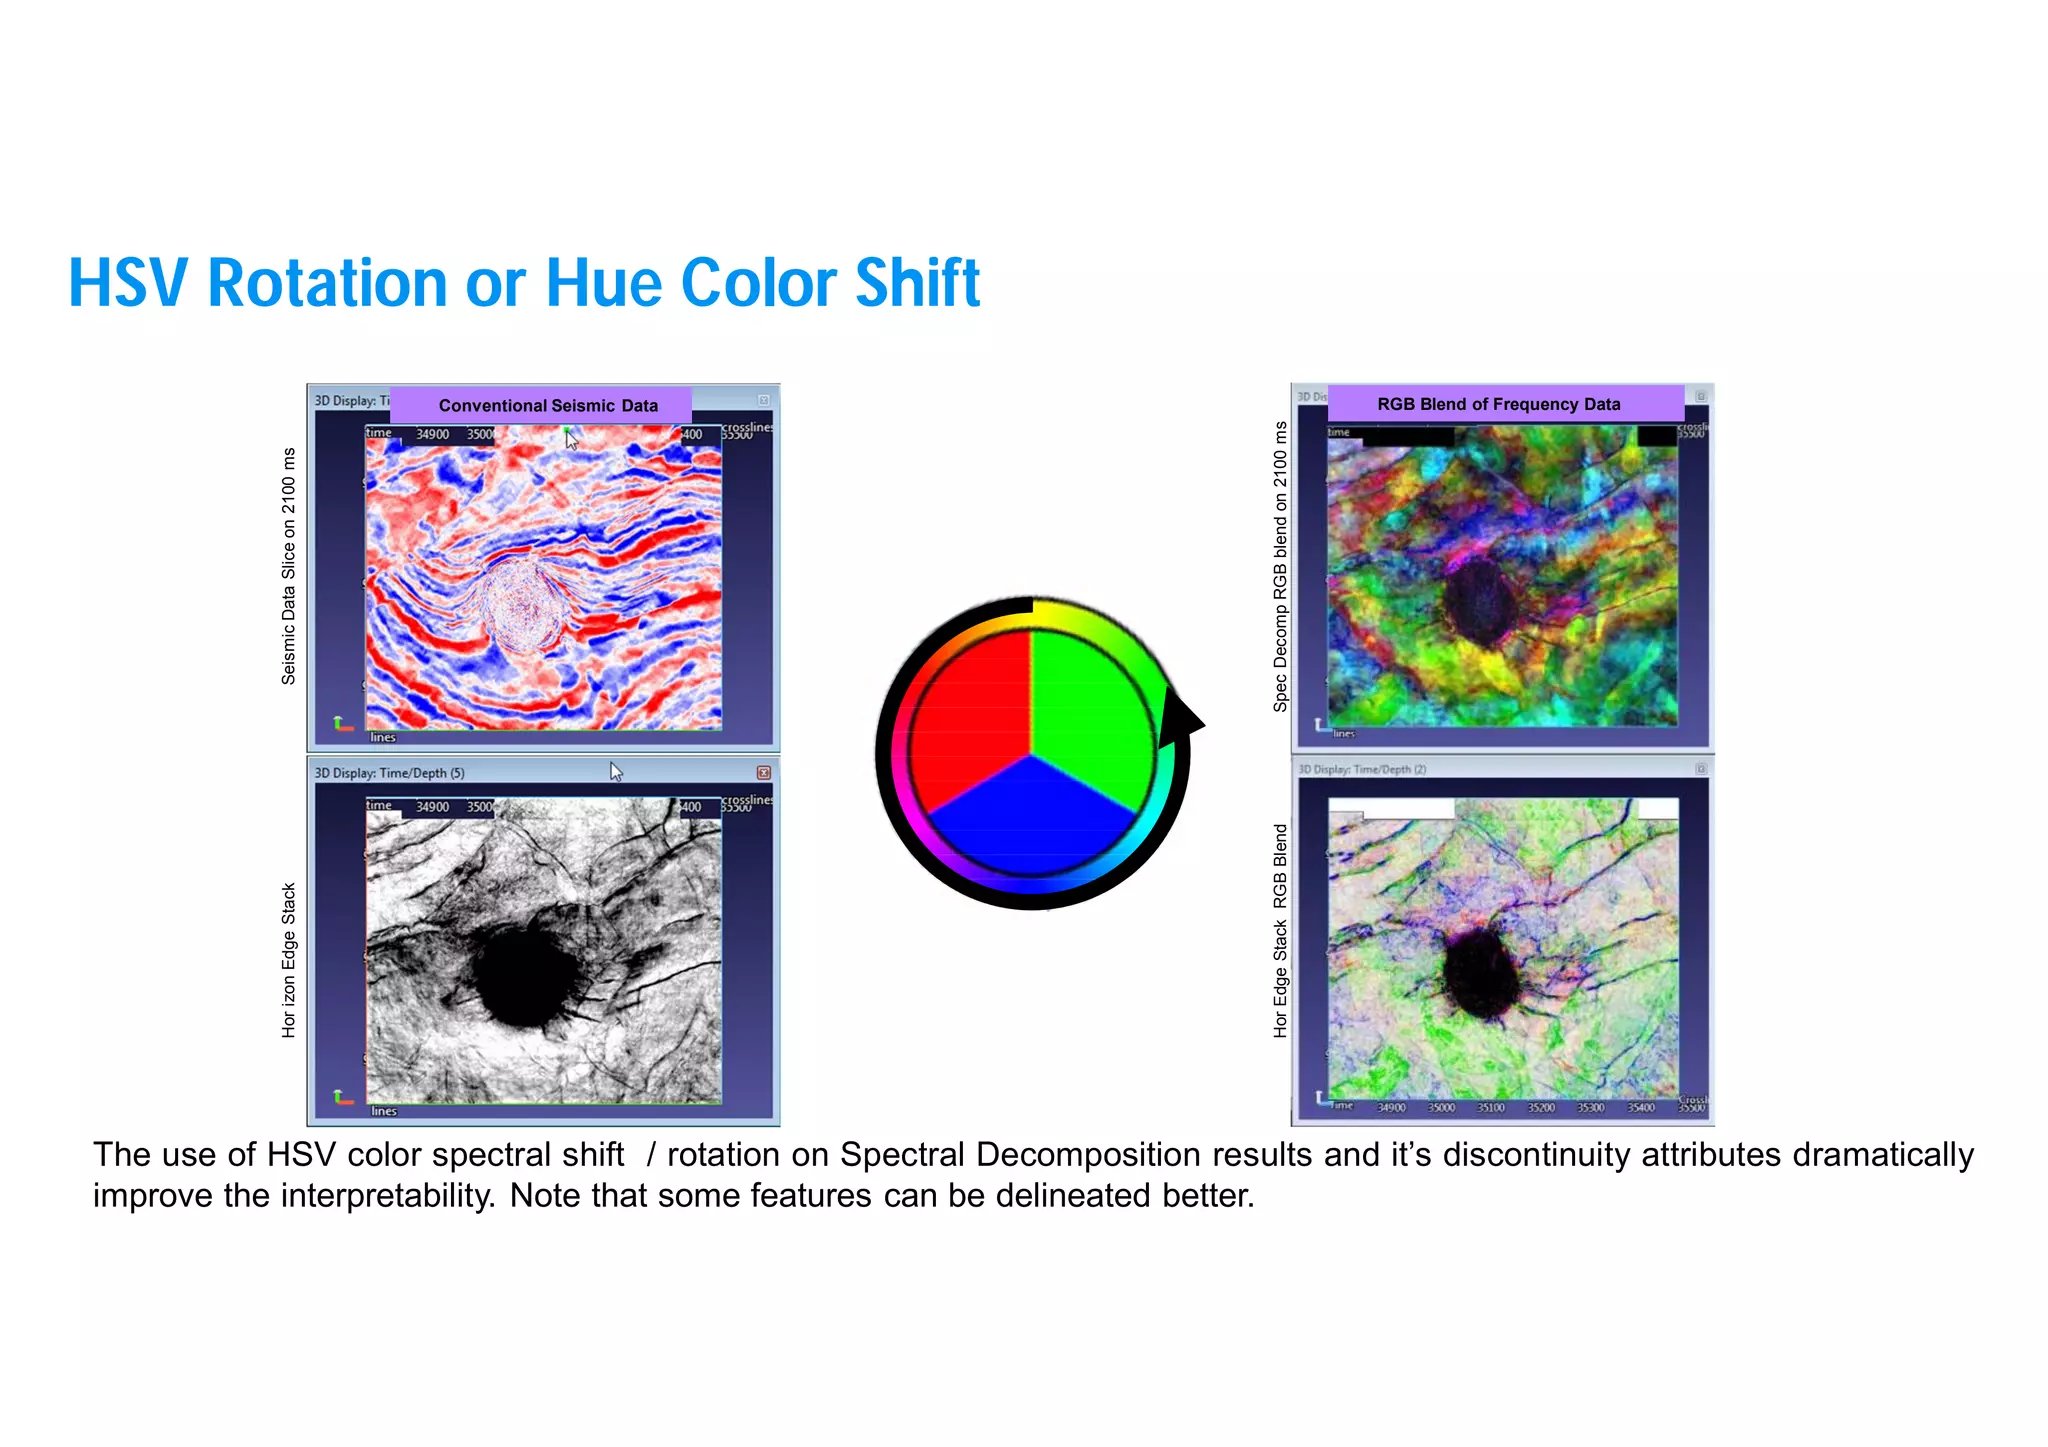
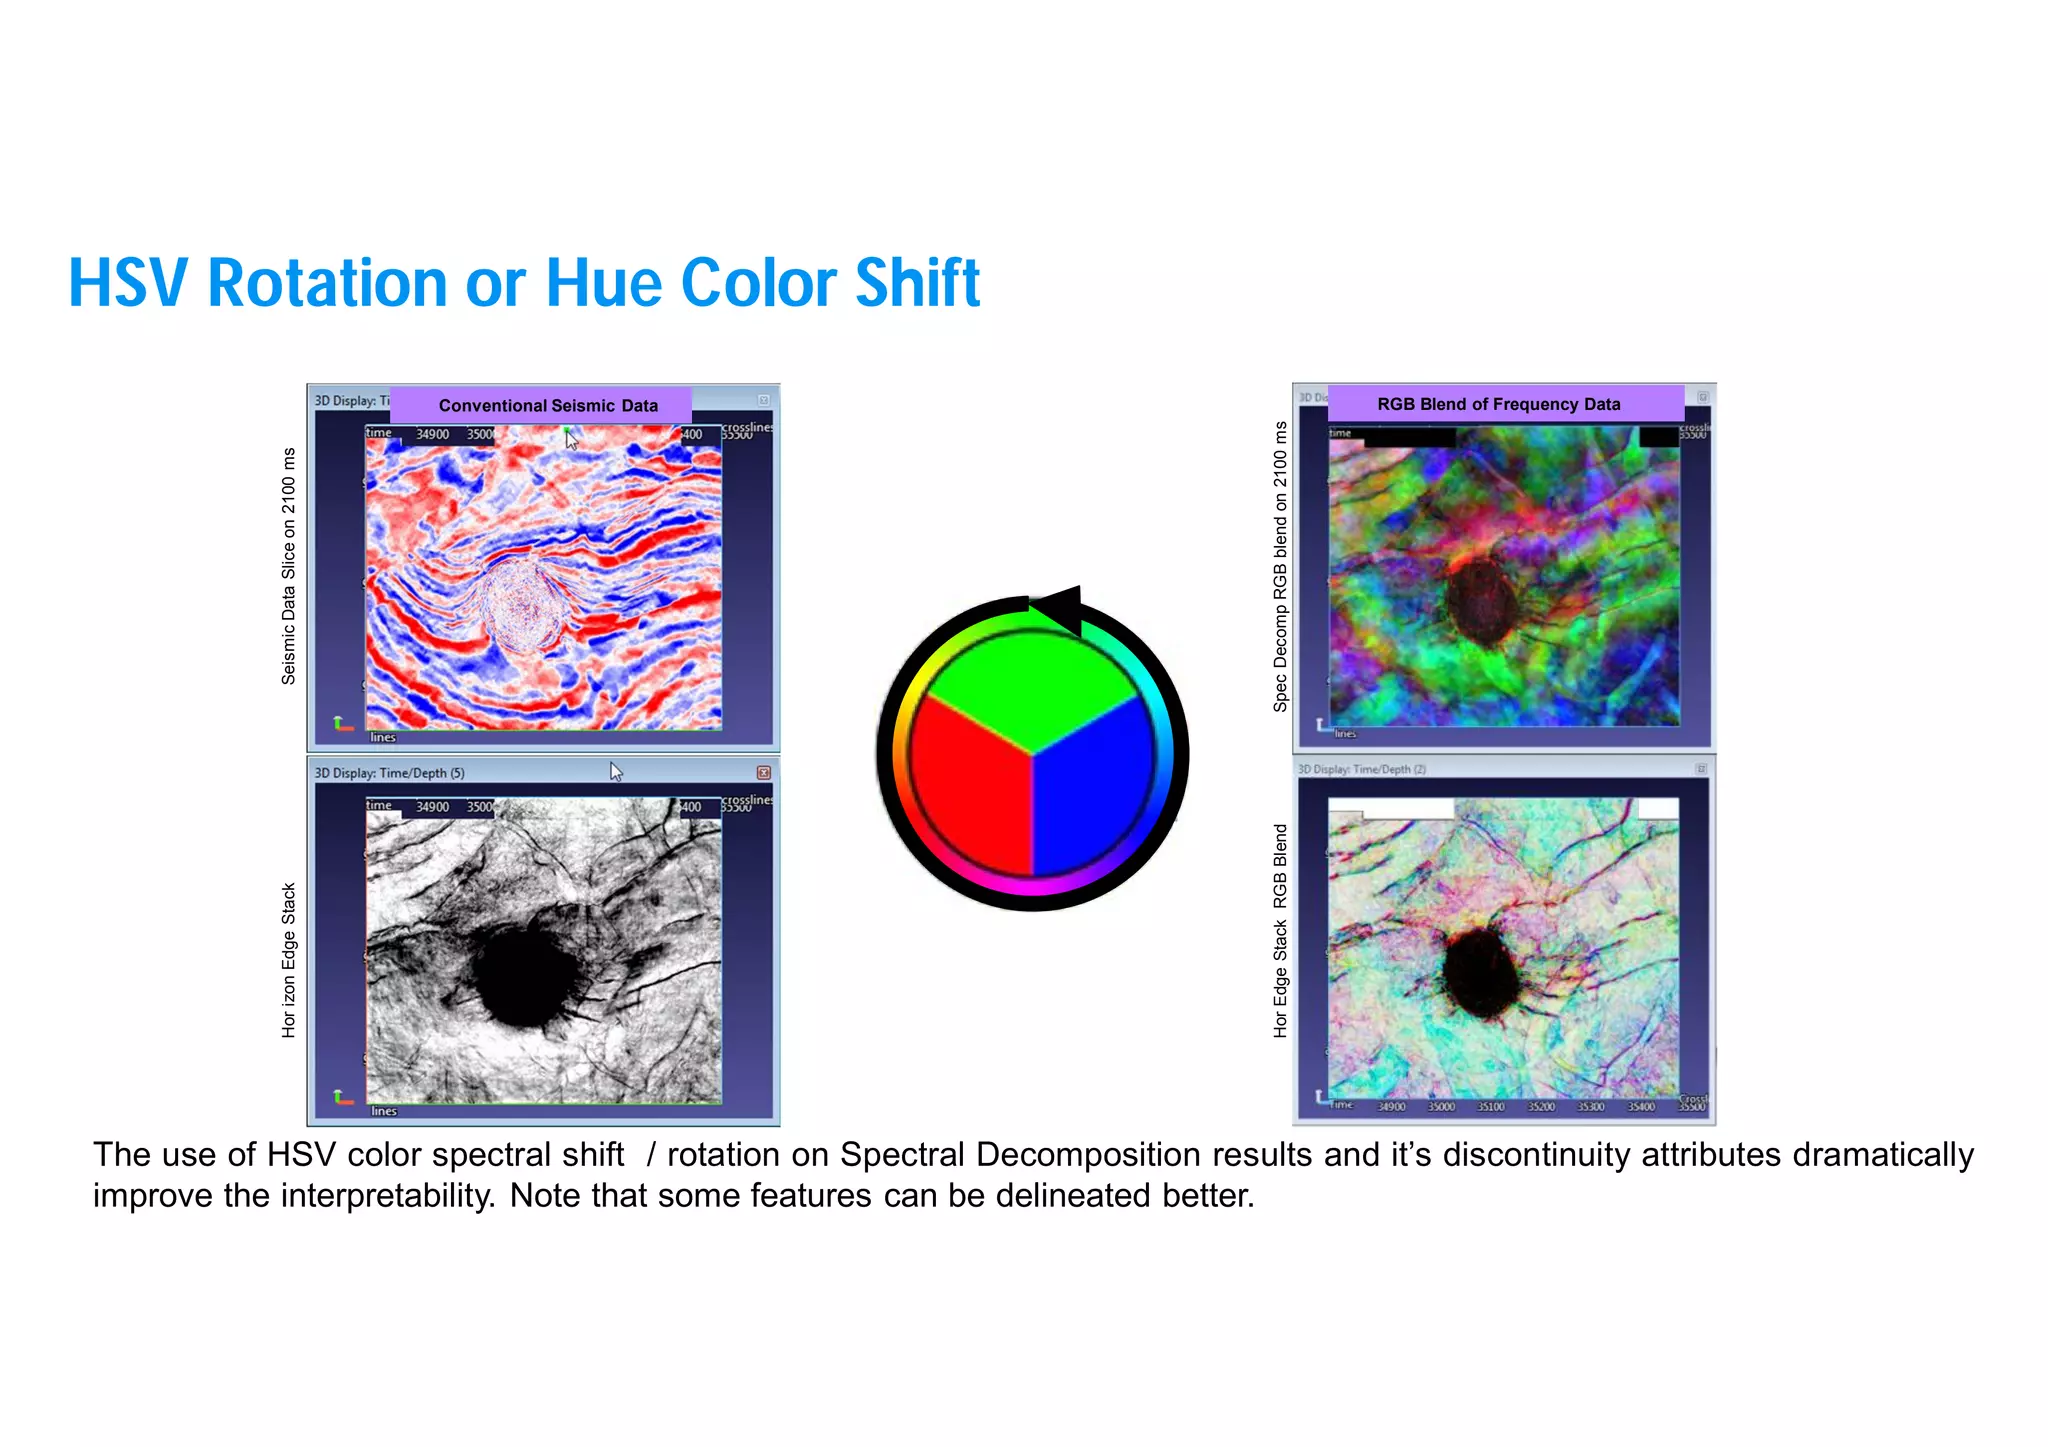
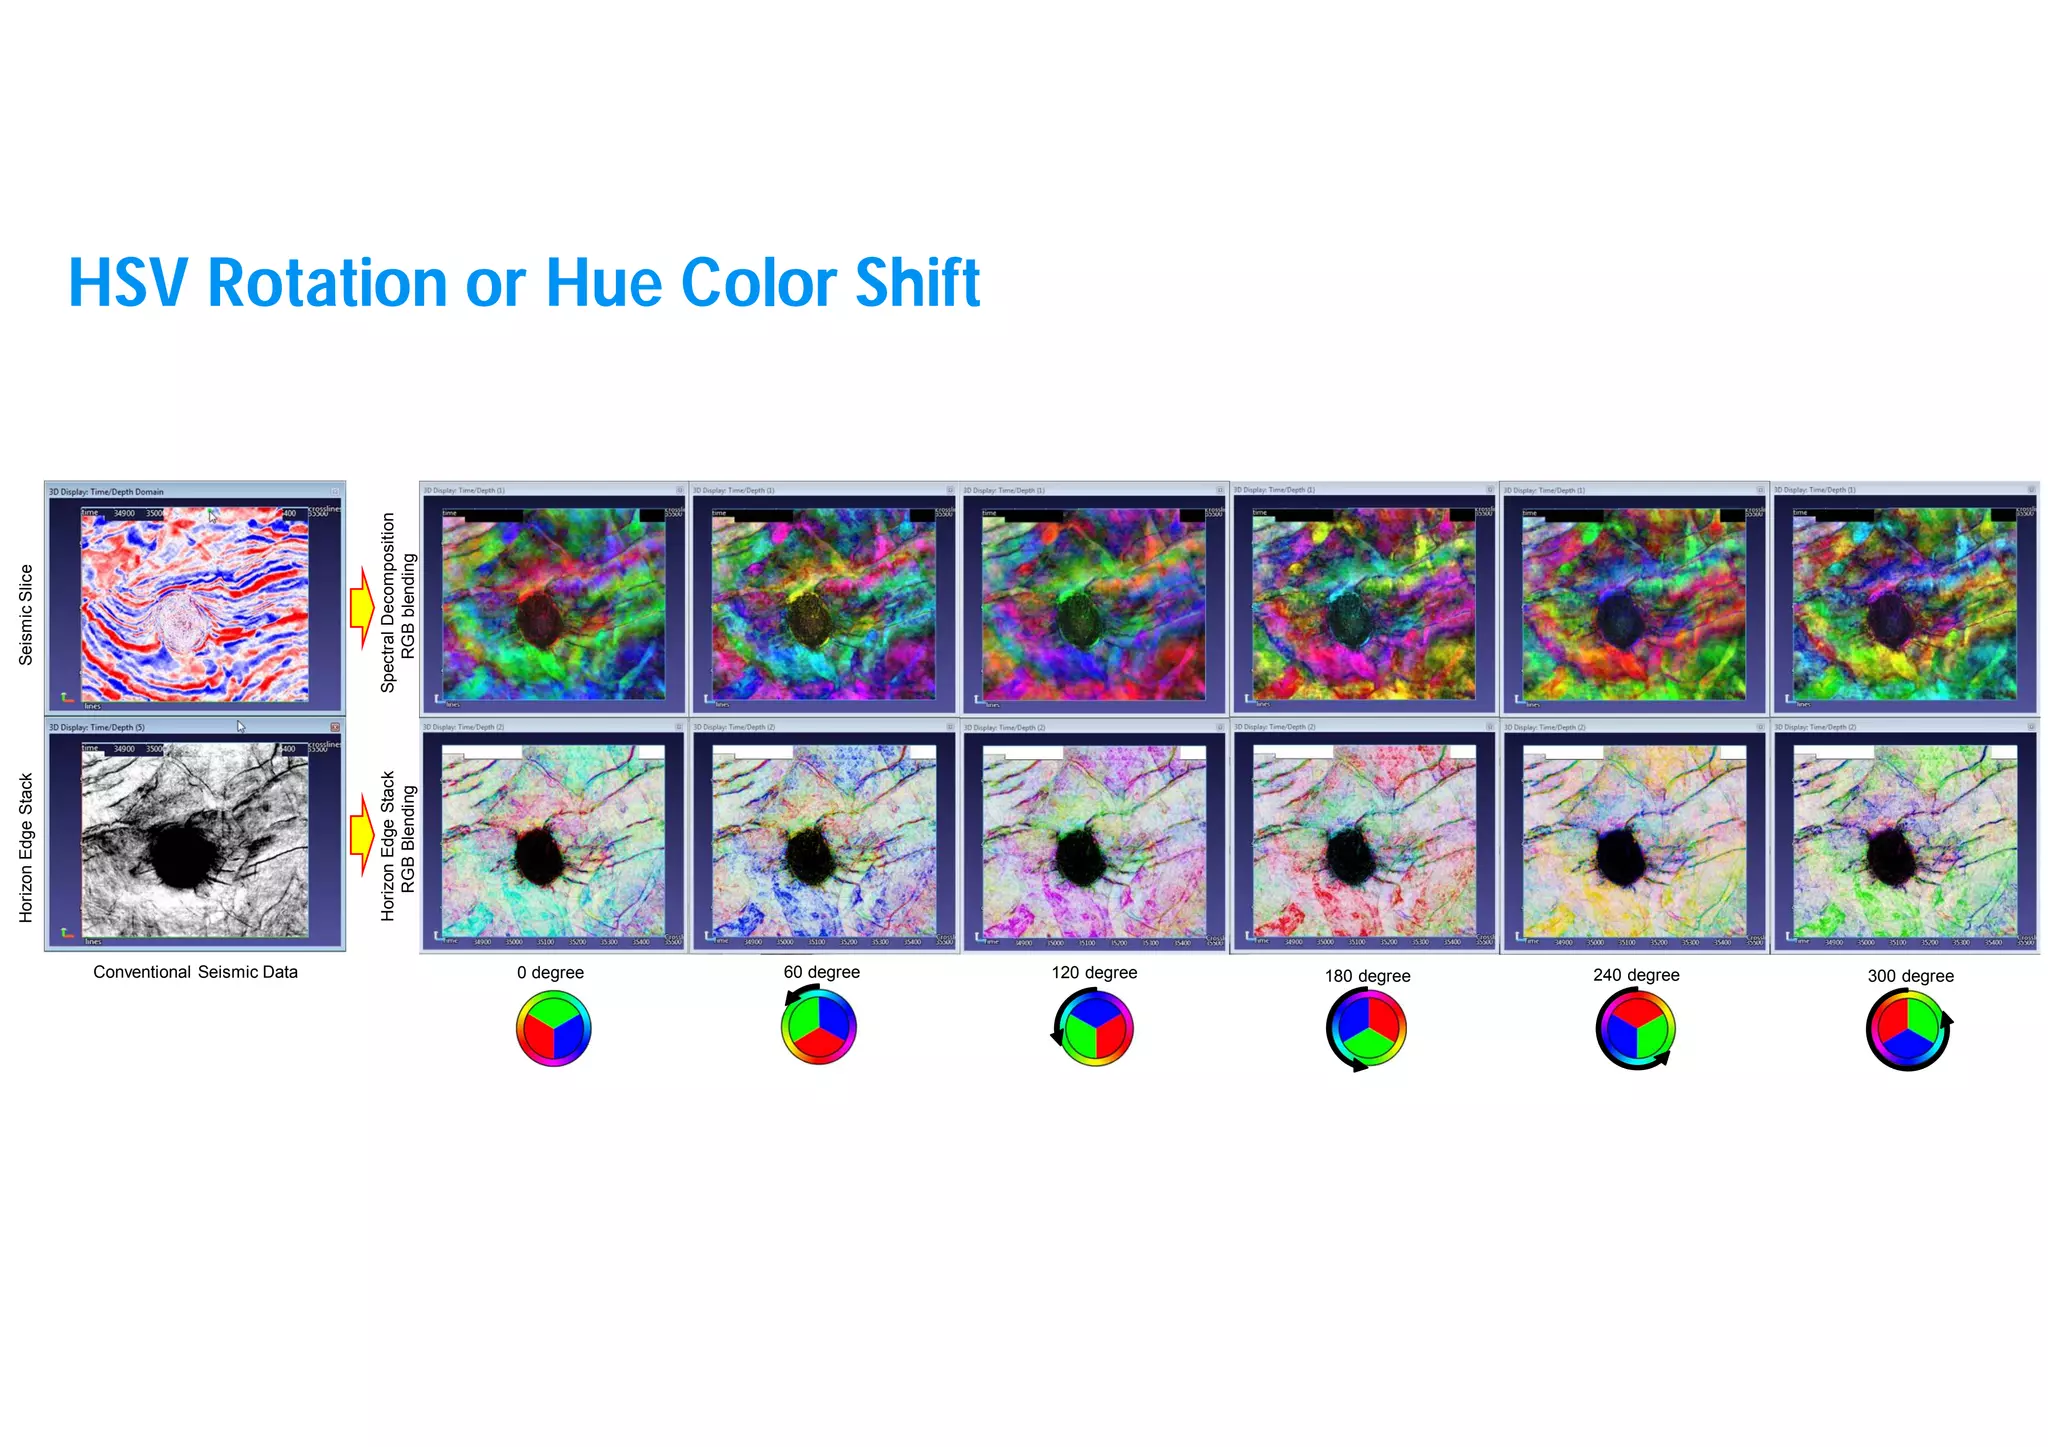
The document discusses the optimization of seismic attribute interpretation using spectral decomposition and RGB blending techniques to enhance the delineation of geological features. By applying HSV rotation and hue color shifts, the interpretation aligns better with human color sensitivity, facilitating the identification of features that might otherwise blend together. It emphasizes the significance of visualizing seismic data through appropriate color selections to improve interpretability and feature detection.
![12
1,2,...
N
with
notch
of
Frequency
1
-
N
thickness
Time
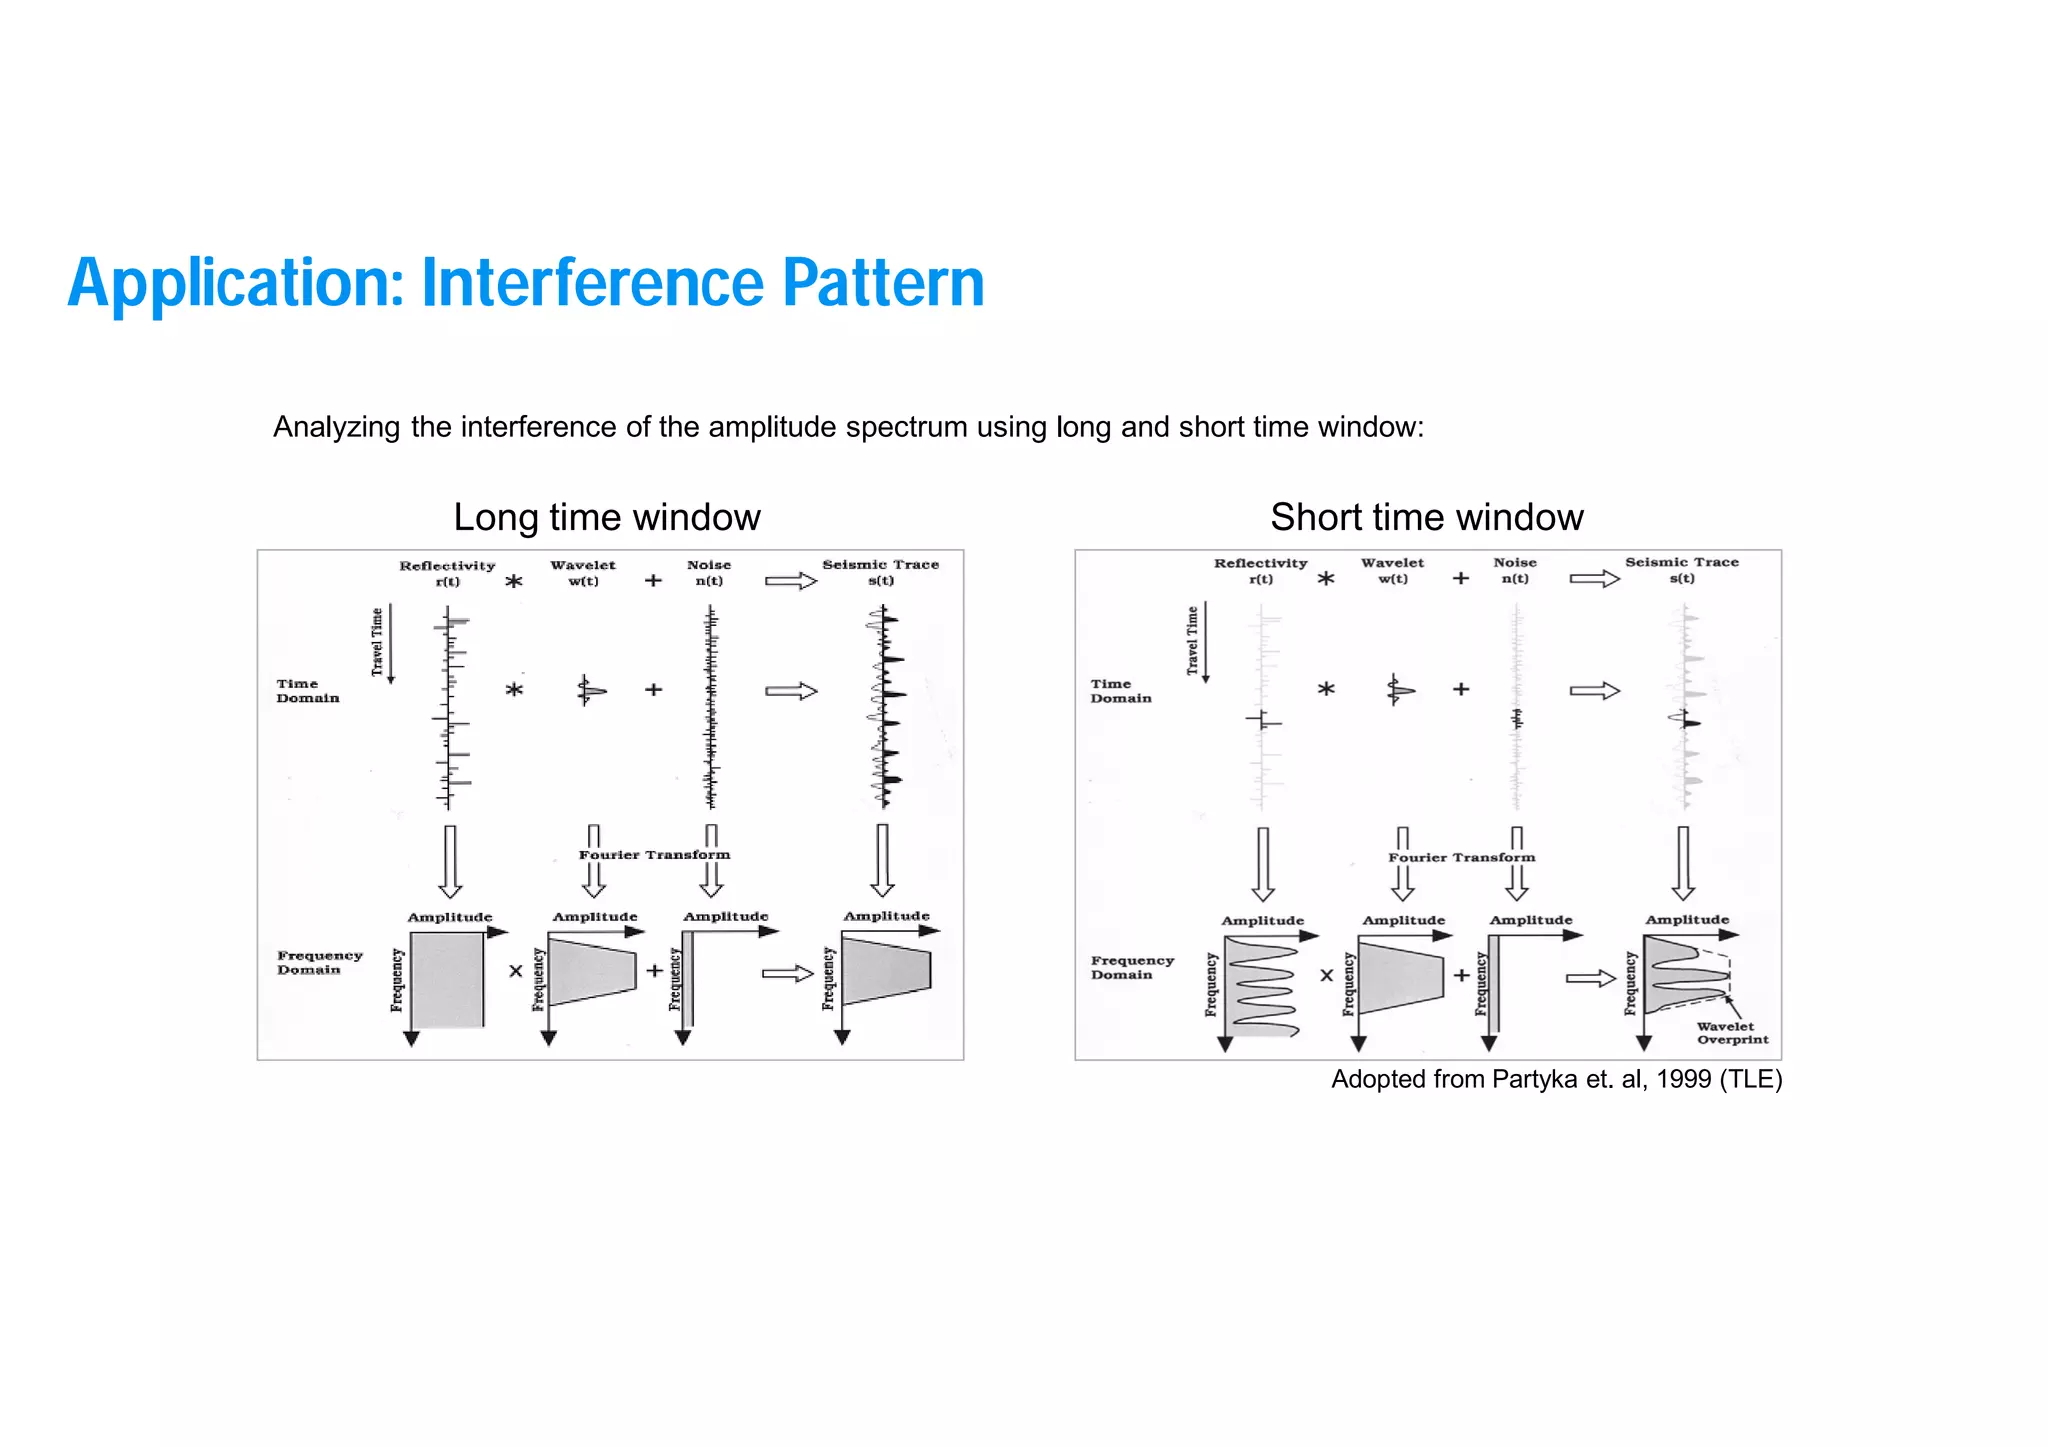
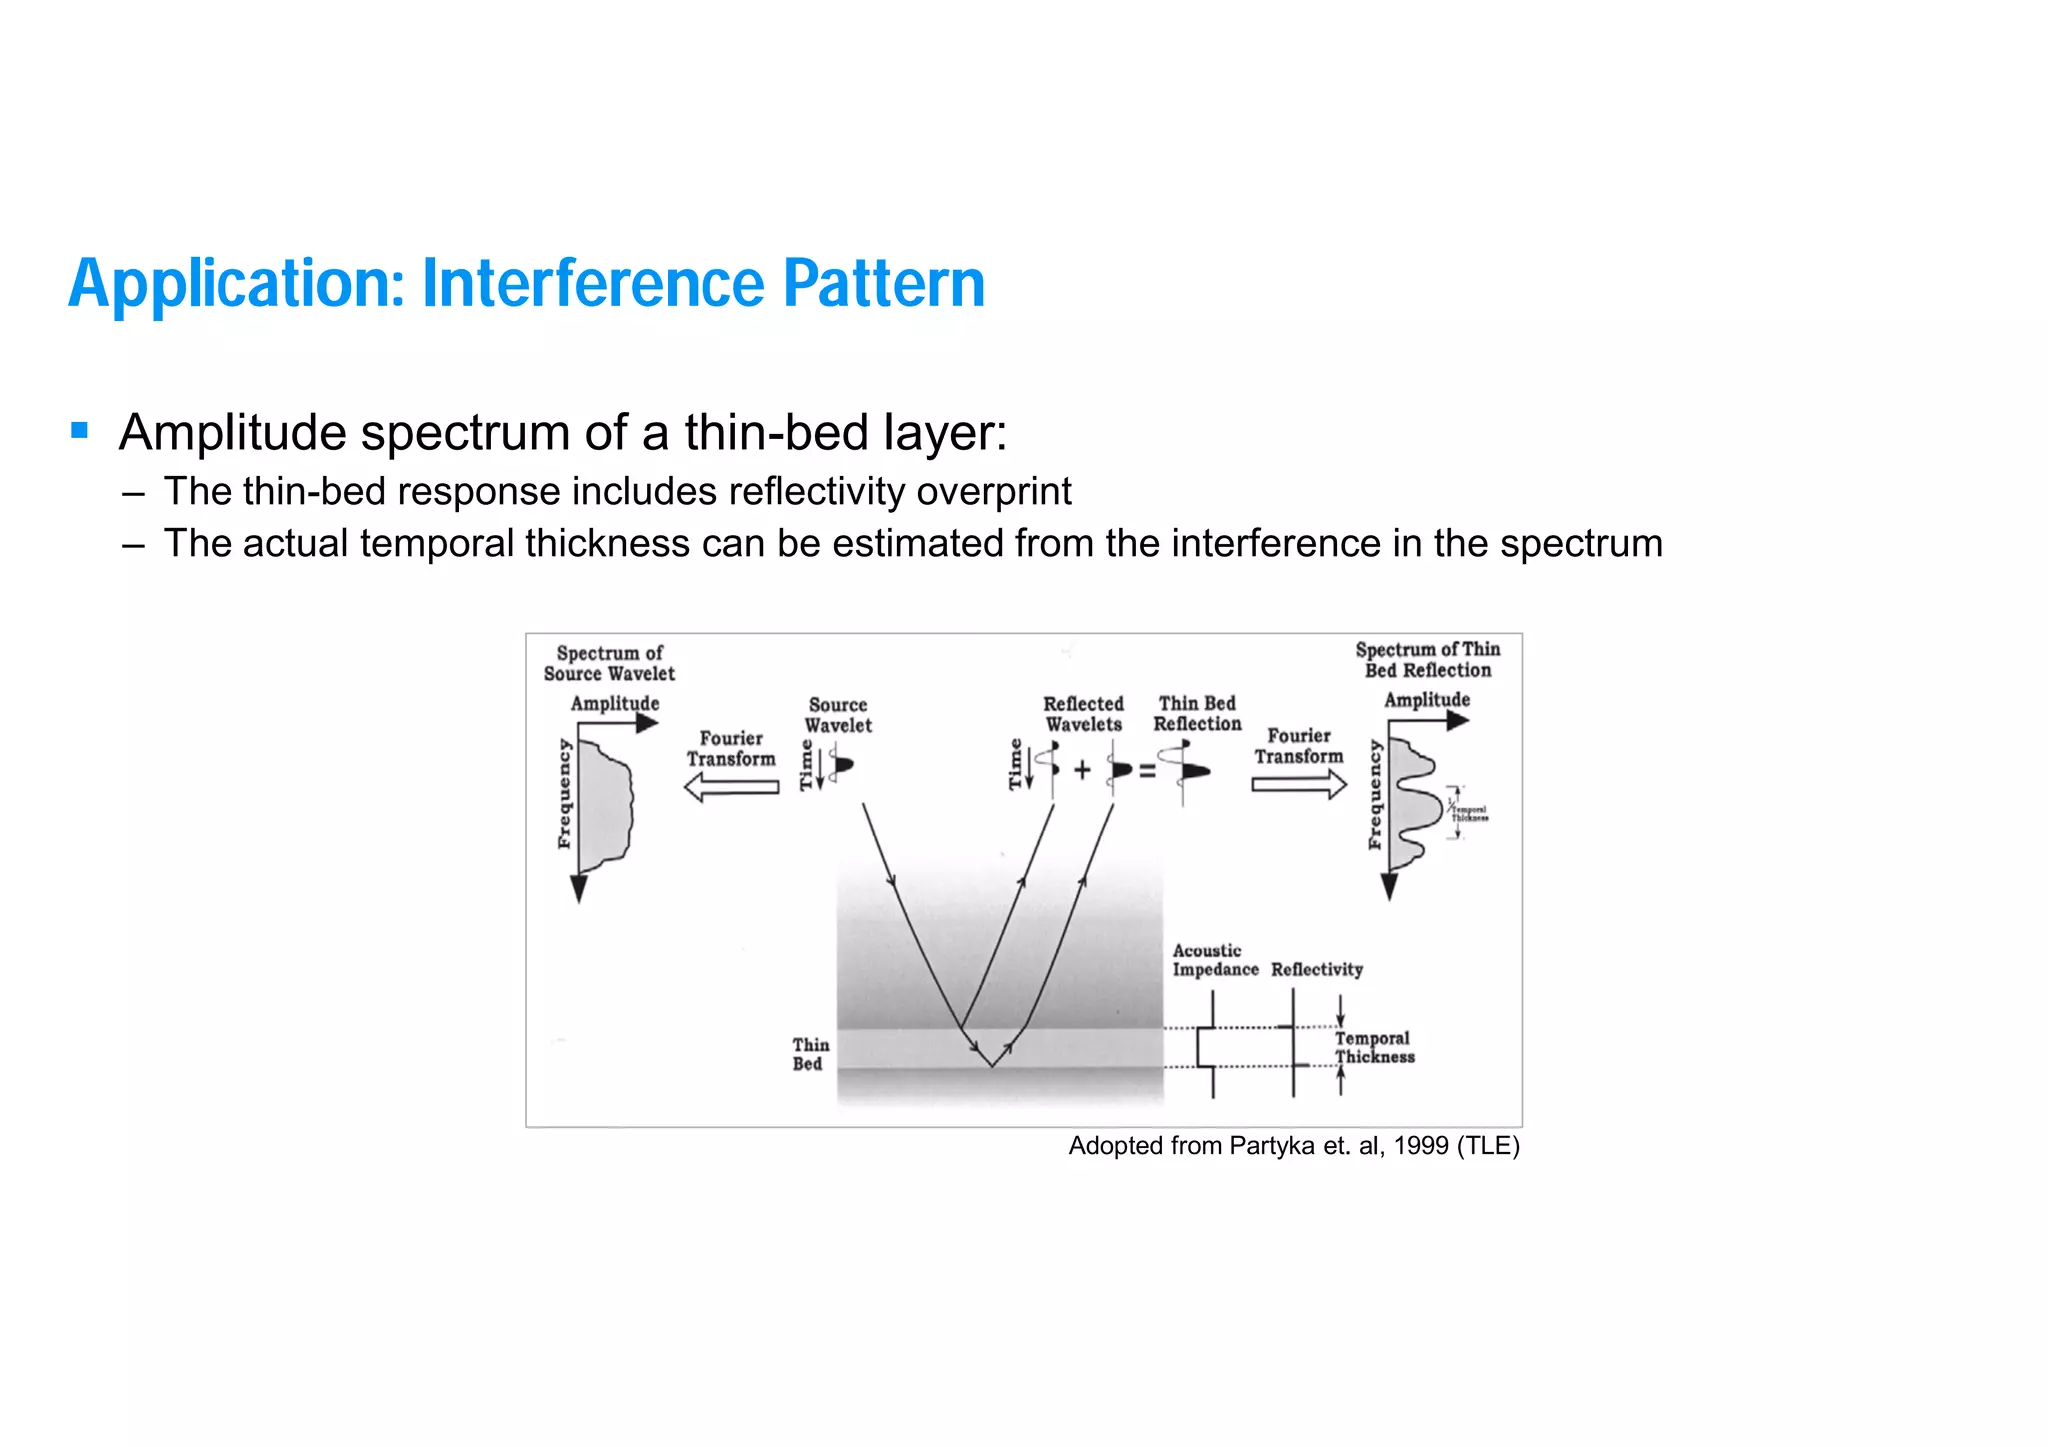
Periodical sequence of notches from a simple
thin-bed layer (wedge model). Note the
interference on the amplitude spectrum of the
wedge.
V-shaped amplitude notches occur where
frequency is equal to 1/time-thickness of the
layer
Adopted from Partyka et. al, 1999 (TLE)
Thickness increase 0 – 40 [ms]
Frequency
[Hz]
Application: Interference Pattern](https://image.slidesharecdn.com/optimizingseismicattributesinterpretationusinghsvrotationppt-230505094416-fb131b6c/75/Optimizing-Seismic-Attributes-Interpretation-using-HSV-Rotation_PPT-pdf-12-2048.jpg)


![Well Log Interpretation and Petrophysical Analisis in [Autosaved]](https://cdn.slidesharecdn.com/ss_thumbnails/a24a638f-02ab-4332-9396-89ba2cdd02b4-161128031018-thumbnail.jpg?width=640&height=640&fit=bounds)