TOC
• The IndividualReflection
• Reflection Amplitude
• Reflection Polarity
• Reflection Continuity
• Reflection Spacing or Frequency
• IntervalVelocity
• LithologicalChange and Reflections
• Seismic Stratigraphy
• Recognizing Lithology
• Basement
• Reflections through HC
3.
Seismic Interpretation
The Seismicsees with a biased Eye. It can only detect lithological boundaries if the
acoustic impedance changes across the boundary.
The Interpreter must have considerable geological skill, including knowledge of
sedimentology, stratigraphy, structural geology etc. to convert seismic image into
plausible geological reality.
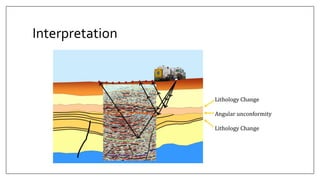
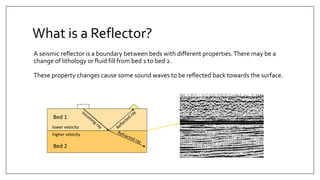
What is aReflector?
A seismic reflector is a boundary between beds with different properties.There may be a
change of lithology or fluid fill from bed 1 to bed 2.
These property changes cause some sound waves to be reflected back towards the surface.
Bed 1
Bed 2
lower velocity
higher velocity
energy
source
signal
receiver
7.
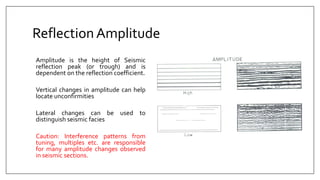
ReflectionAmplitude
Amplitude is theheight of Seismic
reflection peak (or trough) and is
dependent on the reflection coefficient.
Vertical changes in amplitude can help
locate unconfirmities
Lateral changes can be used to
distinguish seismic facies
Caution: Interference patterns from
tuning, multiples etc. are responsible
for many amplitude changes observed
in seismic sections.
8.
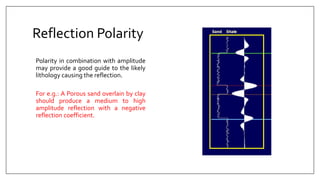
Reflection Polarity
Polarity incombination with amplitude
may provide a good guide to the likely
lithology causing the reflection.
For e.g.: A Porous sand overlain by clay
should produce a medium to high
amplitude reflection with a negative
reflection coefficient.
9.
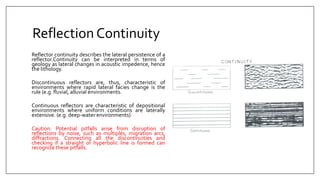
Reflection Continuity
Reflector continuitydescribes the lateral persistence of a
reflector.Continuity can be interpreted in terms of
geology as lateral changes in acoustic impedence, hence
the lithology.
Discontinuous reflectors are, thus, characteristic of
environments where rapid lateral facies change is the
rule (e.g. fluvial, alluvial environments.
Continuous reflectors are characteristic of depositional
environments where uniform conditions are laterally
extensive. (e.g. deep-water environments)
Caution: Potential pitfalls arise from disruption of
reflections by noise, such as multiples, migration arcs,
diffractions. Connecting all the discontinuities and
checking if a straight or hyperbolic line is formed can
recognize these pitfalls.
10.
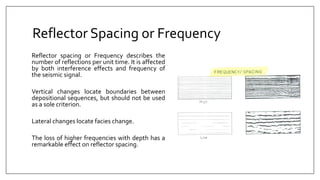
Reflector Spacing orFrequency
Reflector spacing or Frequency describes the
number of reflections per unit time. It is affected
by both interference effects and frequency of
the seismic signal.
Vertical changes locate boundaries between
depositional sequences, but should not be used
as a sole criterion.
Lateral changes locate facies change.
The loss of higher frequencies with depth has a
remarkable effect on reflector spacing.
11.
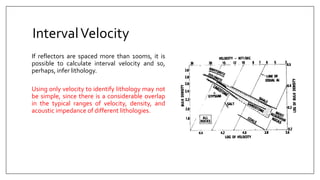
IntervalVelocity
If reflectors arespaced more than 100ms, it is
possible to calculate interval velocity and so,
perhaps, infer lithology.
Using only velocity to identify lithology may not
be simple, since there is a considerable overlap
in the typical ranges of velocity, density, and
acoustic impedance of different lithologies.
12.
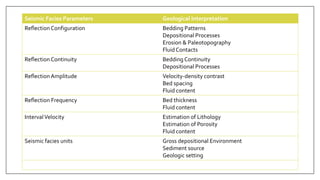
Seismic Facies ParametersGeological Interpretation
Reflection Configuration Bedding Patterns
Depositional Processes
Erosion & Paleotopography
Fluid Contacts
Reflection Continuity Bedding Continuity
Depositional Processes
ReflectionAmplitude Velocity-density contrast
Bed spacing
Fluid content
Reflection Frequency Bed thickness
Fluid content
IntervalVelocity Estimation of Lithology
Estimation of Porosity
Fluid content
Seismic facies units Gross depositional Environment
Sediment source
Geologic setting
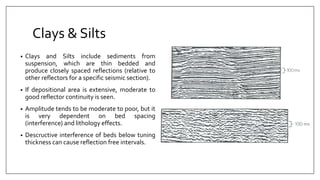
Clays & Silts
•Clays and Silts include sediments from
suspension, which are thin bedded and
produce closely spaced reflections (relative to
other reflectors for a specific seismic section).
• If depositional area is extensive, moderate to
good reflector continuity is seen.
• Amplitude tends to be moderate to poor, but it
is very dependent on bed spacing
(interference) and lithology effects.
• Descructive interference of beds below tuning
thickness can cause reflection free intervals.
15.
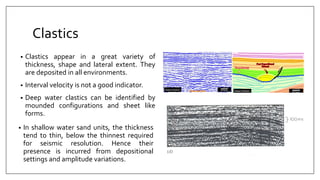
Clastics
• Clastics appearin a great variety of
thickness, shape and lateral extent. They
are deposited in all environments.
• Interval velocity is not a good indicator.
• Deep water clastics can be identified by
mounded configurations and sheet like
forms.
• In shallow water sand units, the thickness
tend to thin, below the thinnest required
for seismic resolution. Hence their
presence is incurred from depositional
settings and amplitude variations.
16.
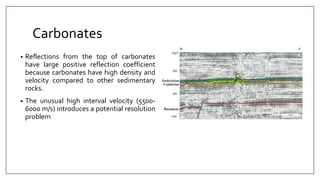
Carbonates
• Reflections fromthe top of carbonates
have large positive reflection coefficient
because carbonates have high density and
velocity compared to other sedimentary
rocks.
• The unusual high interval velocity (5500-
6000 m/s) introduces a potential resolution
problem
17.
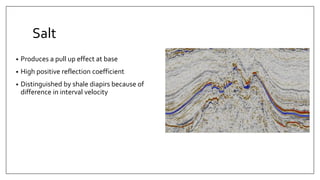
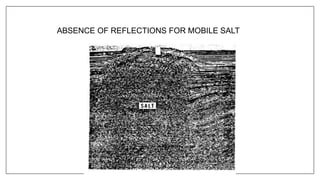
Salt
• Produces apull up effect at base
• High positive reflection coefficient
• Distinguished by shale diapirs because of
difference in interval velocity
Basement
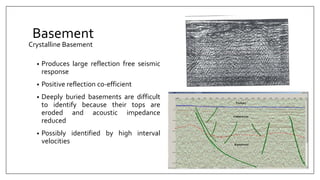
Crystalline Basement
• Produceslarge reflection free seismic
response
• Positive reflection co-efficient
• Deeply buried basements are difficult
to identify because their tops are
eroded and acoustic impedance
reduced
• Possibly identified by high interval
velocities
20.
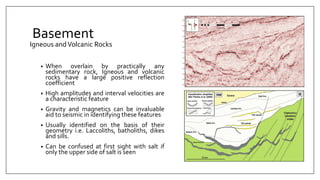
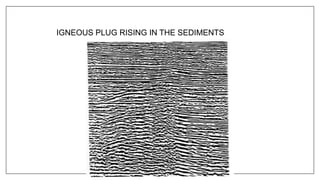
Basement
Igneous andVolcanic Rocks
•When overlain by practically any
sedimentary rock, Igneous and volcanic
rocks have a large positive reflection
coefficient
• High amplitudes and interval velocities are
a characteristic feature
• Gravity and magnetics can be invaluable
aid to seismic in identifying these features
• Usually identified on the basis of their
geometry i.e. Laccoliths, batholiths, dikes
and sills.
• Can be confused at first sight with salt if
only the upper side of salt is seen
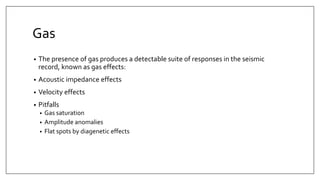
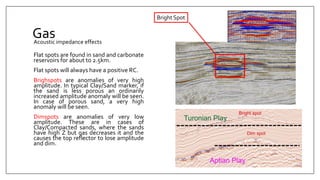
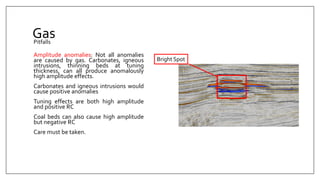
Gas
• The presenceof gas produces a detectable suite of responses in the seismic
record, known as gas effects:
• Acoustic impedance effects
• Velocity effects
• Pitfalls
• Gas saturation
• Amplitude anomalies
• Flat spots by diagenetic effects
30.
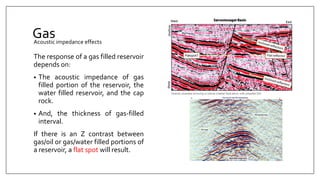
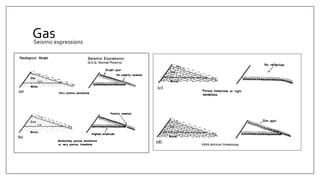
Gas
The response ofa gas filled reservoir
depends on:
• The acoustic impedance of gas
filled portion of the reservoir, the
water filled reservoir, and the cap
rock.
• And, the thickness of gas-filled
interval.
If there is an Z contrast between
gas/oil or gas/water filled portions of
a reservoir, a flat spot will result.
Acoustic impedance effects
31.
Gas
Flat spots arefound in sand and carbonate
reservoirs for about to 2.5km.
Flat spots will always have a positive RC.
Brighspots are anomalies of very high
amplitude. In typical Clay/Sand marker, if
the sand is less porous an ordinarily
increased amplitude anomaly will be seen.
In case of porous sand, a very high
anomaly will be seen.
Dimspots are anomalies of very low
amplitude. These are in cases of
Clay/Compacted sands, where the sands
have high Z but gas decreases it and the
causes the top reflector to lose amplitude
and dim.
Acoustic impedance effects
Bright Spot
32.
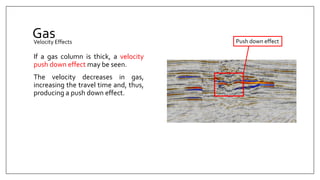
Gas
If a gascolumn is thick, a velocity
push down effect may be seen.
The velocity decreases in gas,
increasing the travel time and, thus,
producing a push down effect.
Velocity Effects Push down effect
33.
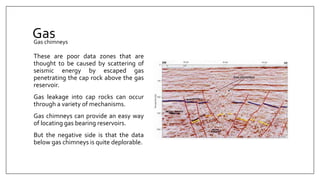
Gas
These are poordata zones that are
thought to be caused by scattering of
seismic energy by escaped gas
penetrating the cap rock above the gas
reservoir.
Gas leakage into cap rocks can occur
through a variety of mechanisms.
Gas chimneys can provide an easy way
of locating gas bearing reservoirs.
But the negative side is that the data
below gas chimneys is quite deplorable.
Gas chimneys
34.
Gas
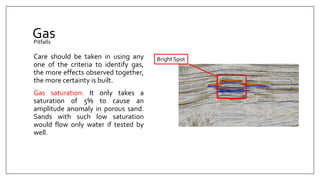
Care should betaken in using any
one of the criteria to identify gas,
the more effects observed together,
the more certainty is built.
Gas saturation: It only takes a
saturation of 5% to cause an
amplitude anomaly in porous sand.
Sands with such low saturation
would flow only water if tested by
well.
Pitfalls
Bright Spot
35.
Gas
Amplitude anomalies: Notall anomalies
are caused by gas. Carbonates, igneous
intrusions, thinning beds at tuning
thickness, can all produce anomalously
high amplitude effects.
Carbonates and igneous intrusions would
cause positive anomalies
Tuning effects are both high amplitude
and positive RC
Coal beds can also cause high amplitude
but negative RC
Care must be taken.
Pitfalls
Bright Spot
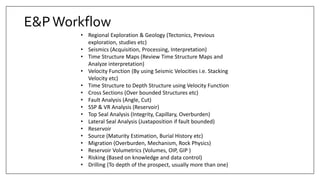
E&PWorkflow
• Regional Exploration& Geology (Tectonics, Previous
exploration, studies etc)
• Seismics (Acquisition, Processing, Interpretation)
• Time Structure Maps (Review Time Structure Maps and
Analyze interpretation)
• Velocity Function (By using Seismic Velocities i.e. Stacking
Velocity etc)
• Time Structure to Depth Structure using Velocity Function
• Cross Sections (Over bounded Structures etc)
• Fault Analysis (Angle, Cut)
• SSP & VR Analysis (Reservoir)
• Top Seal Analysis (Integrity, Capillary, Overburden)
• Lateral Seal Analysis (Juxtaposition if fault bounded)
• Reservoir
• Source (Maturity Estimation, Burial History etc)
• Migration (Overburden, Mechanism, Rock Physics)
• Reservoir Volumetrics (Volumes, OIP, GIP )
• Risking (Based on knowledge and data control)
• Drilling (To depth of the prospect, usually more than one)
38.
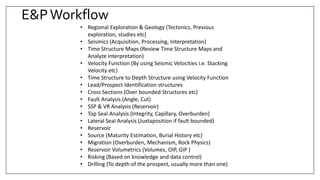
E&PWorkflow
• Regional Exploration& Geology (Tectonics, Previous
exploration, studies etc)
• Seismics (Acquisition, Processing, Interpretation)
• Time Structure Maps (Review Time Structure Maps and
Analyze interpretation)
• Velocity Function (By using Seismic Velocities i.e. Stacking
Velocity etc)
• Time Structure to Depth Structure using Velocity Function
• Lead/Prospect Identification structures
• Cross Sections (Over bounded Structures etc)
• Fault Analysis (Angle, Cut)
• SSP & VR Analysis (Reservoir)
• Top Seal Analysis (Integrity, Capillary, Overburden)
• Lateral Seal Analysis (Juxtaposition if fault bounded)
• Reservoir
• Source (Maturity Estimation, Burial History etc)
• Migration (Overburden, Mechanism, Rock Physics)
• Reservoir Volumetrics (Volumes, OIP, GIP )
• Risking (Based on knowledge and data control)
• Drilling (To depth of the prospect, usually more than one)
39.
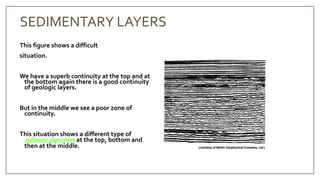
SEDIMENTARY LAYERS
This figureshows a difficult
situation.
We have a superb continuity at the top and at
the bottom again there is a good continuity
of geologic layers.
But in the middle we see a poor zone of
continuity.
This situation shows a different type of
sediment deposition at the top, bottom and
then at the middle.
40.
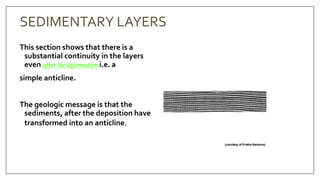
SEDIMENTARY LAYERS
This sectionshows that there is a
substantial continuity in the layers
even after the deformation i.e. a
simple anticline.
The geologic message is that the
sediments, after the deposition have
transformed into an anticline.
41.
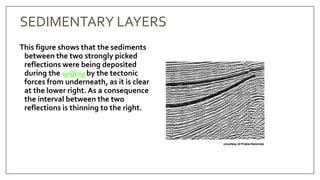
SEDIMENTARY LAYERS
This figureshows that the sediments
between the two strongly picked
reflections were being deposited
during the uplifting by the tectonic
forces from underneath, as it is clear
at the lower right. As a consequence
the interval between the two
reflections is thinning to the right.
42.
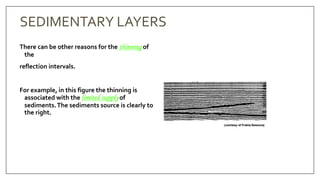
SEDIMENTARY LAYERS
There canbe other reasons for the thinning of
the
reflection intervals.
For example, in this figure the thinning is
associated with the limited supply of
sediments.The sediments source is clearly to
the right.
43.
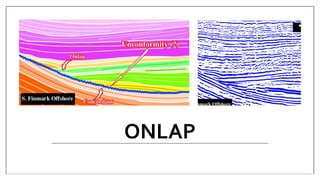
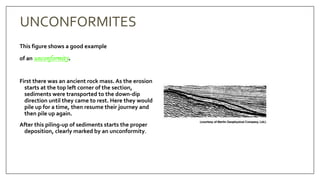
UNCONFORMITES
This figure showsa good example
of an unconformity.
First there was an ancient rock mass. As the erosion
starts at the top left corner of the section,
sediments were transported to the down-dip
direction until they came to rest. Here they would
pile up for a time, then resume their journey and
then pile up again.
After this piling-up of sediments starts the proper
deposition, clearly marked by an unconformity.
44.
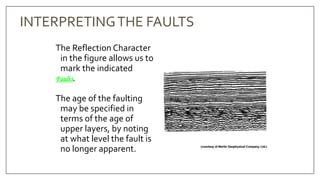
INTERPRETINGTHE FAULTS
The ReflectionCharacter
in the figure allows us to
mark the indicated
Faults.
The age of the faulting
may be specified in
terms of the age of
upper layers, by noting
at what level the fault is
no longer apparent.
45.
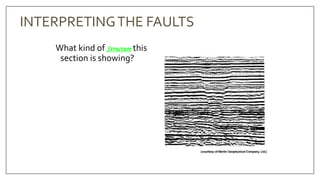
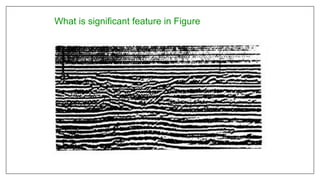
What kind ofStructure this
section is showing?
INTERPRETINGTHE FAULTS
46.
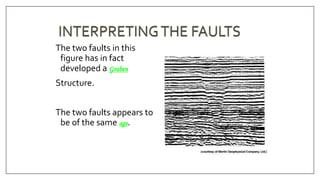
The two faultsin this
figure has in fact
developed a Graben
Structure.
The two faults appears to
be of the same age.
47.
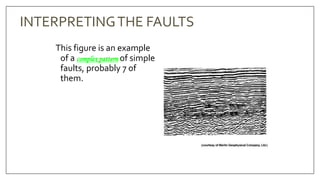
This figure isan example
of a complex pattern of simple
faults, probably 7 of
them.
INTERPRETINGTHE FAULTS
48.
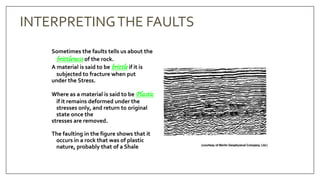
Sometimes the faultstells us about the
brittleness of the rock.
A material is said to be brittle if it is
subjected to fracture when put
under the Stress.
Where as a material is said to be Plastic
if it remains deformed under the
stresses only, and return to original
state once the
stresses are removed.
The faulting in the figure shows that it
occurs in a rock that was of plastic
nature, probably that of a Shale
INTERPRETINGTHE FAULTS
49.
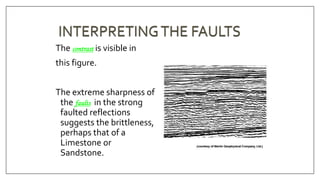
The contrast isvisible in
this figure.
The extreme sharpness of
the faults in the strong
faulted reflections
suggests the brittleness,
perhaps that of a
Limestone or
Sandstone.
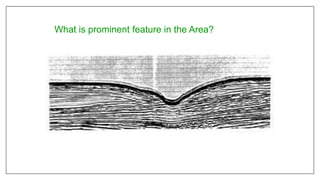
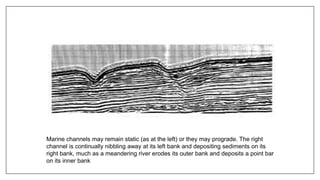
Marine channels mayremain static (as at the left) or they may prograde. The right
channel is continually nibbling away at its left bank and depositing sediments on its
right bank, much as a meandering river erodes its outer bank and deposits a point bar
on its inner bank
53.
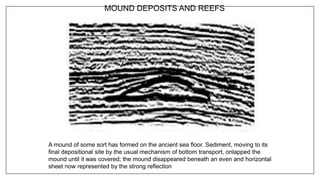
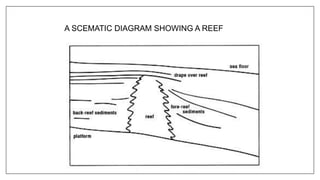
MOUND DEPOSITS ANDREEFS
A mound of some sort has formed on the ancient sea floor. Sediment, moving to its
final depositional site by the usual mechanism of bottom transport, onlapped the
mound until it was covered; the mound disappeared beneath an even and horizontal
sheet now represented by the strong reflection
54.
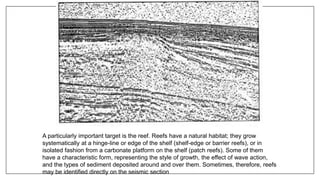
A particularly importanttarget is the reef. Reefs have a natural habitat; they grow
systematically at a hinge-line or edge of the shelf (shelf-edge or barrier reefs), or in
isolated fashion from a carbonate platform on the shelf (patch reefs). Some of them
have a characteristic form, representing the style of growth, the effect of wave action,
and the types of sediment deposited around and over them. Sometimes, therefore, reefs
may be identified directly on the seismic section
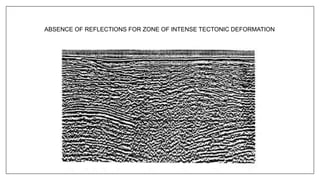
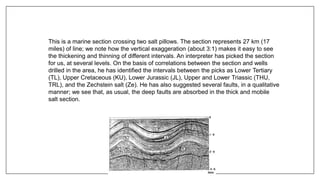
This is amarine section crossing two salt pillows. The section represents 27 km (17
miles) of line; we note how the vertical exaggeration (about 3:1) makes it easy to see
the thickening and thinning of different intervals. An interpreter has picked the section
for us, at several levels. On the basis of correlations between the section and wells
drilled in the area, he has identified the intervals between the picks as Lower Tertiary
(TL), Upper Cretaceous (KU), Lower Jurassic (JL), Upper and Lower Triassic (THU,
TRL), and the Zechstein salt (Ze). He has also suggested several faults, in a qualitative
manner; we see that, as usual, the deep faults are absorbed in the thick and mobile
salt section.