Downloaded 28 times
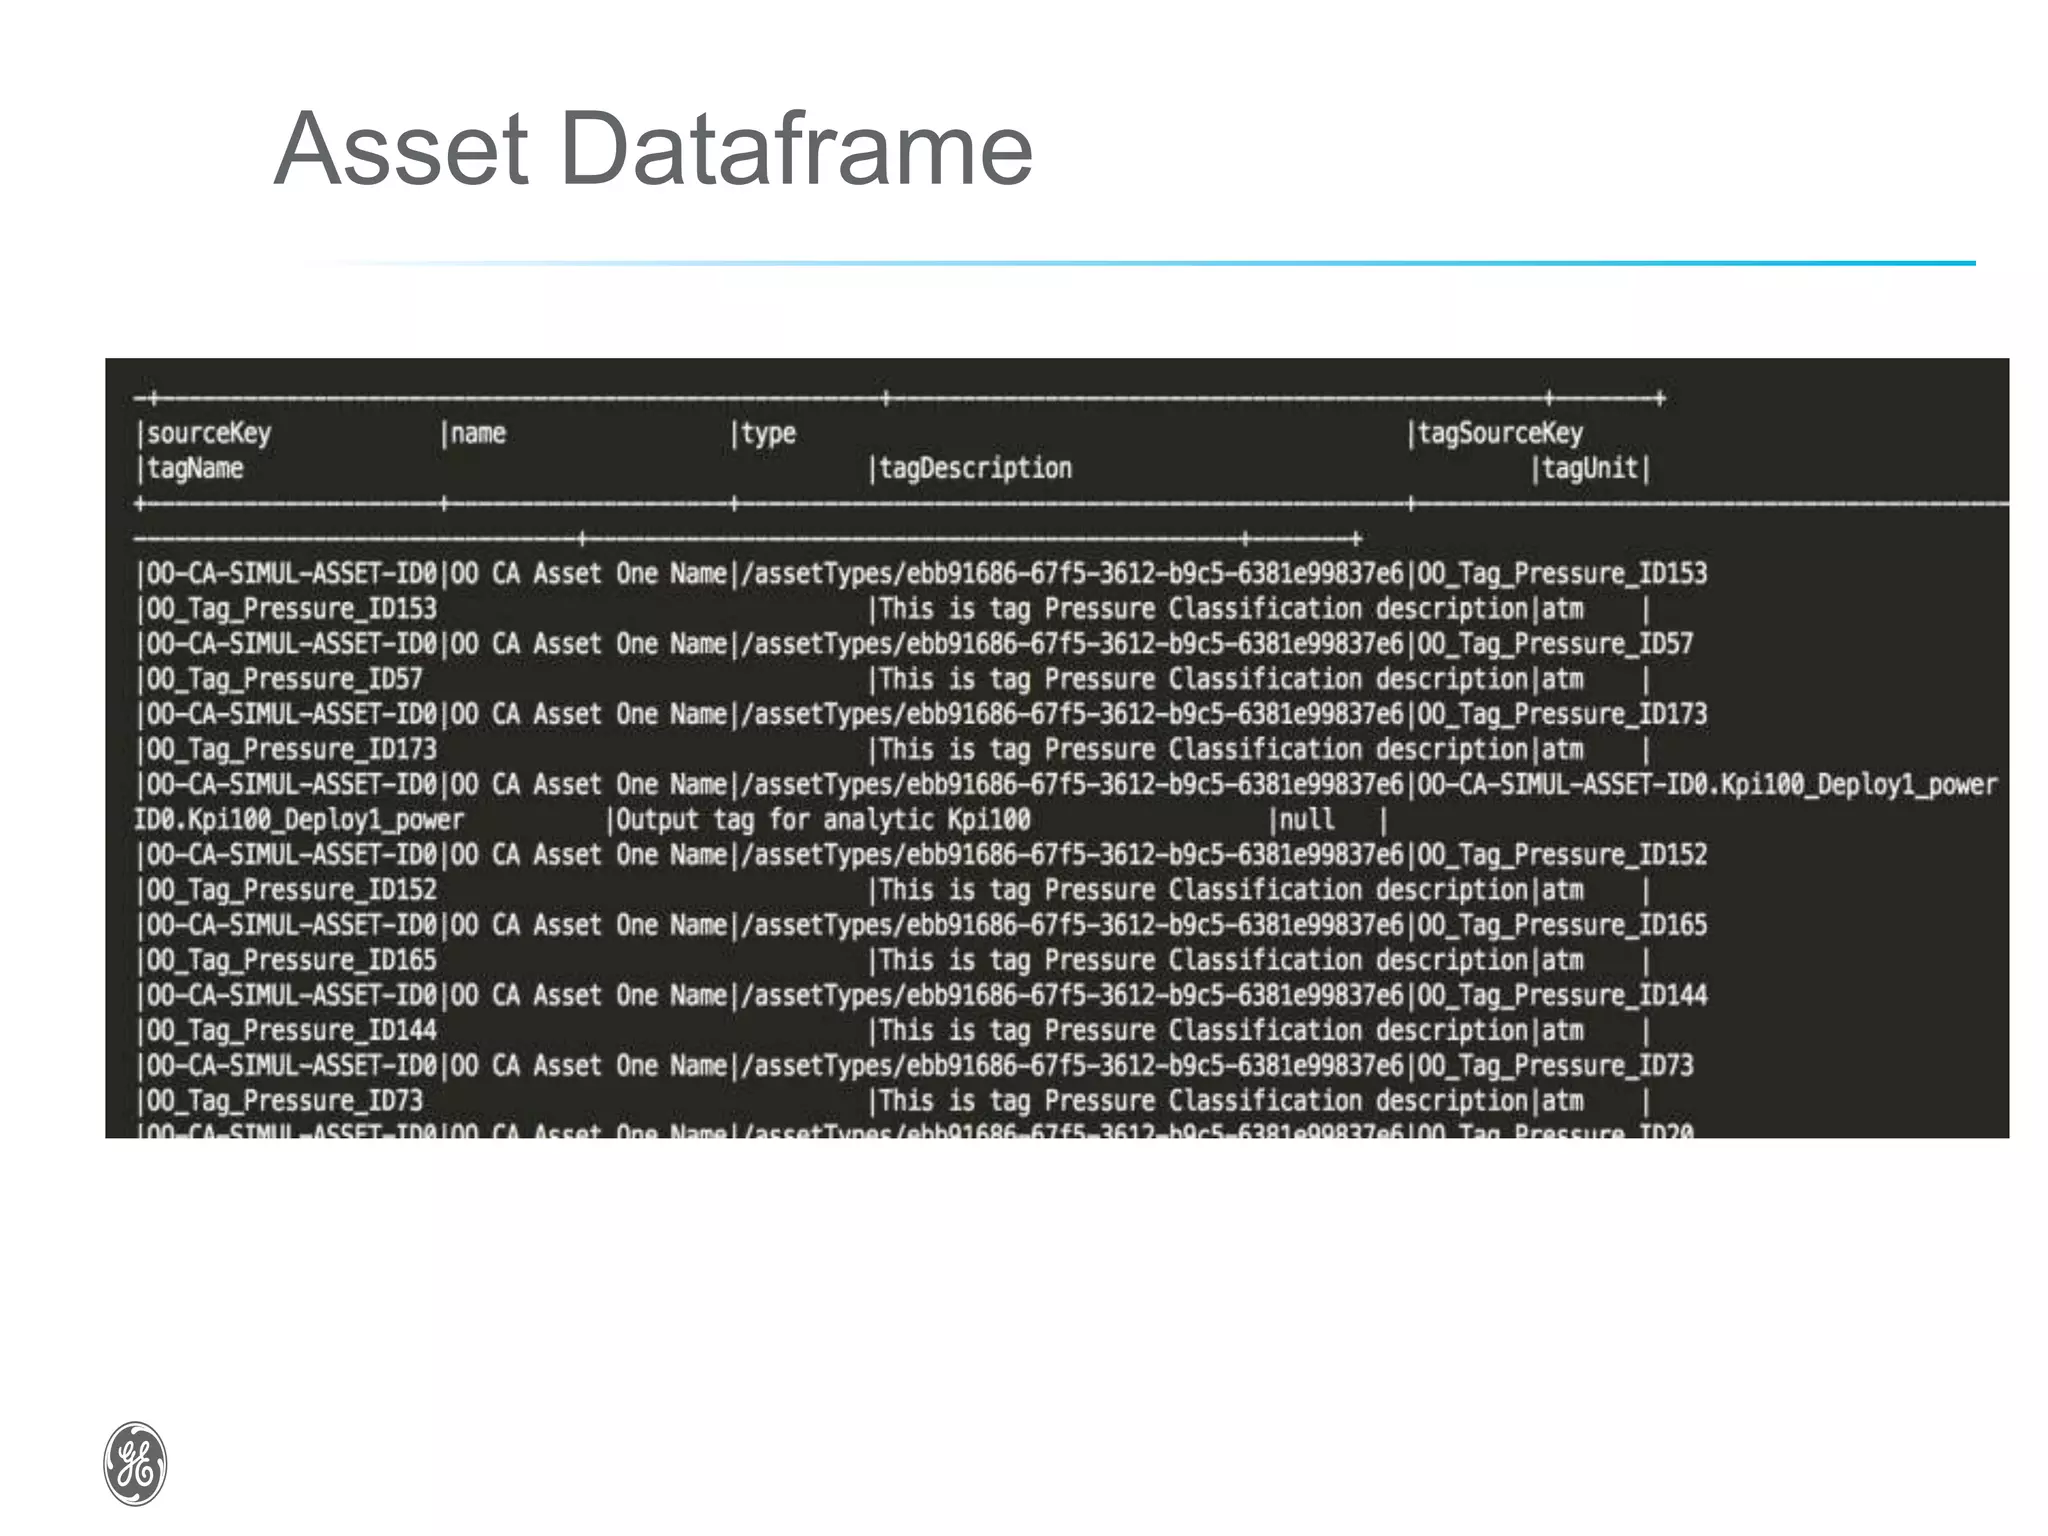
![Asset Dataframe - Schema
"tagClassifications": [
{
"id": "OO-
BL000472_Tag_Temperature_Cl
assification_ID",
"name": "OO-
BL000472_Tag_Temperature_Cl
assification_name",
"description": "This is tag
Temperature Classification
description",
"unitGroup": "temperature",
"properties": [
{
"id": "low",
"value": [
80
],
"type": "double"
},
{
"id": "high",
"value": [
120
],
"type": "double"
},
{
"id": "threshold",
"value": [
100](https://image.slidesharecdn.com/917reddipallioptimizingindustrialoperationsusingthebigdataecosystem-170626212622/75/Optimizing-industrial-operations-using-the-big-data-ecosystem-14-2048.jpg)
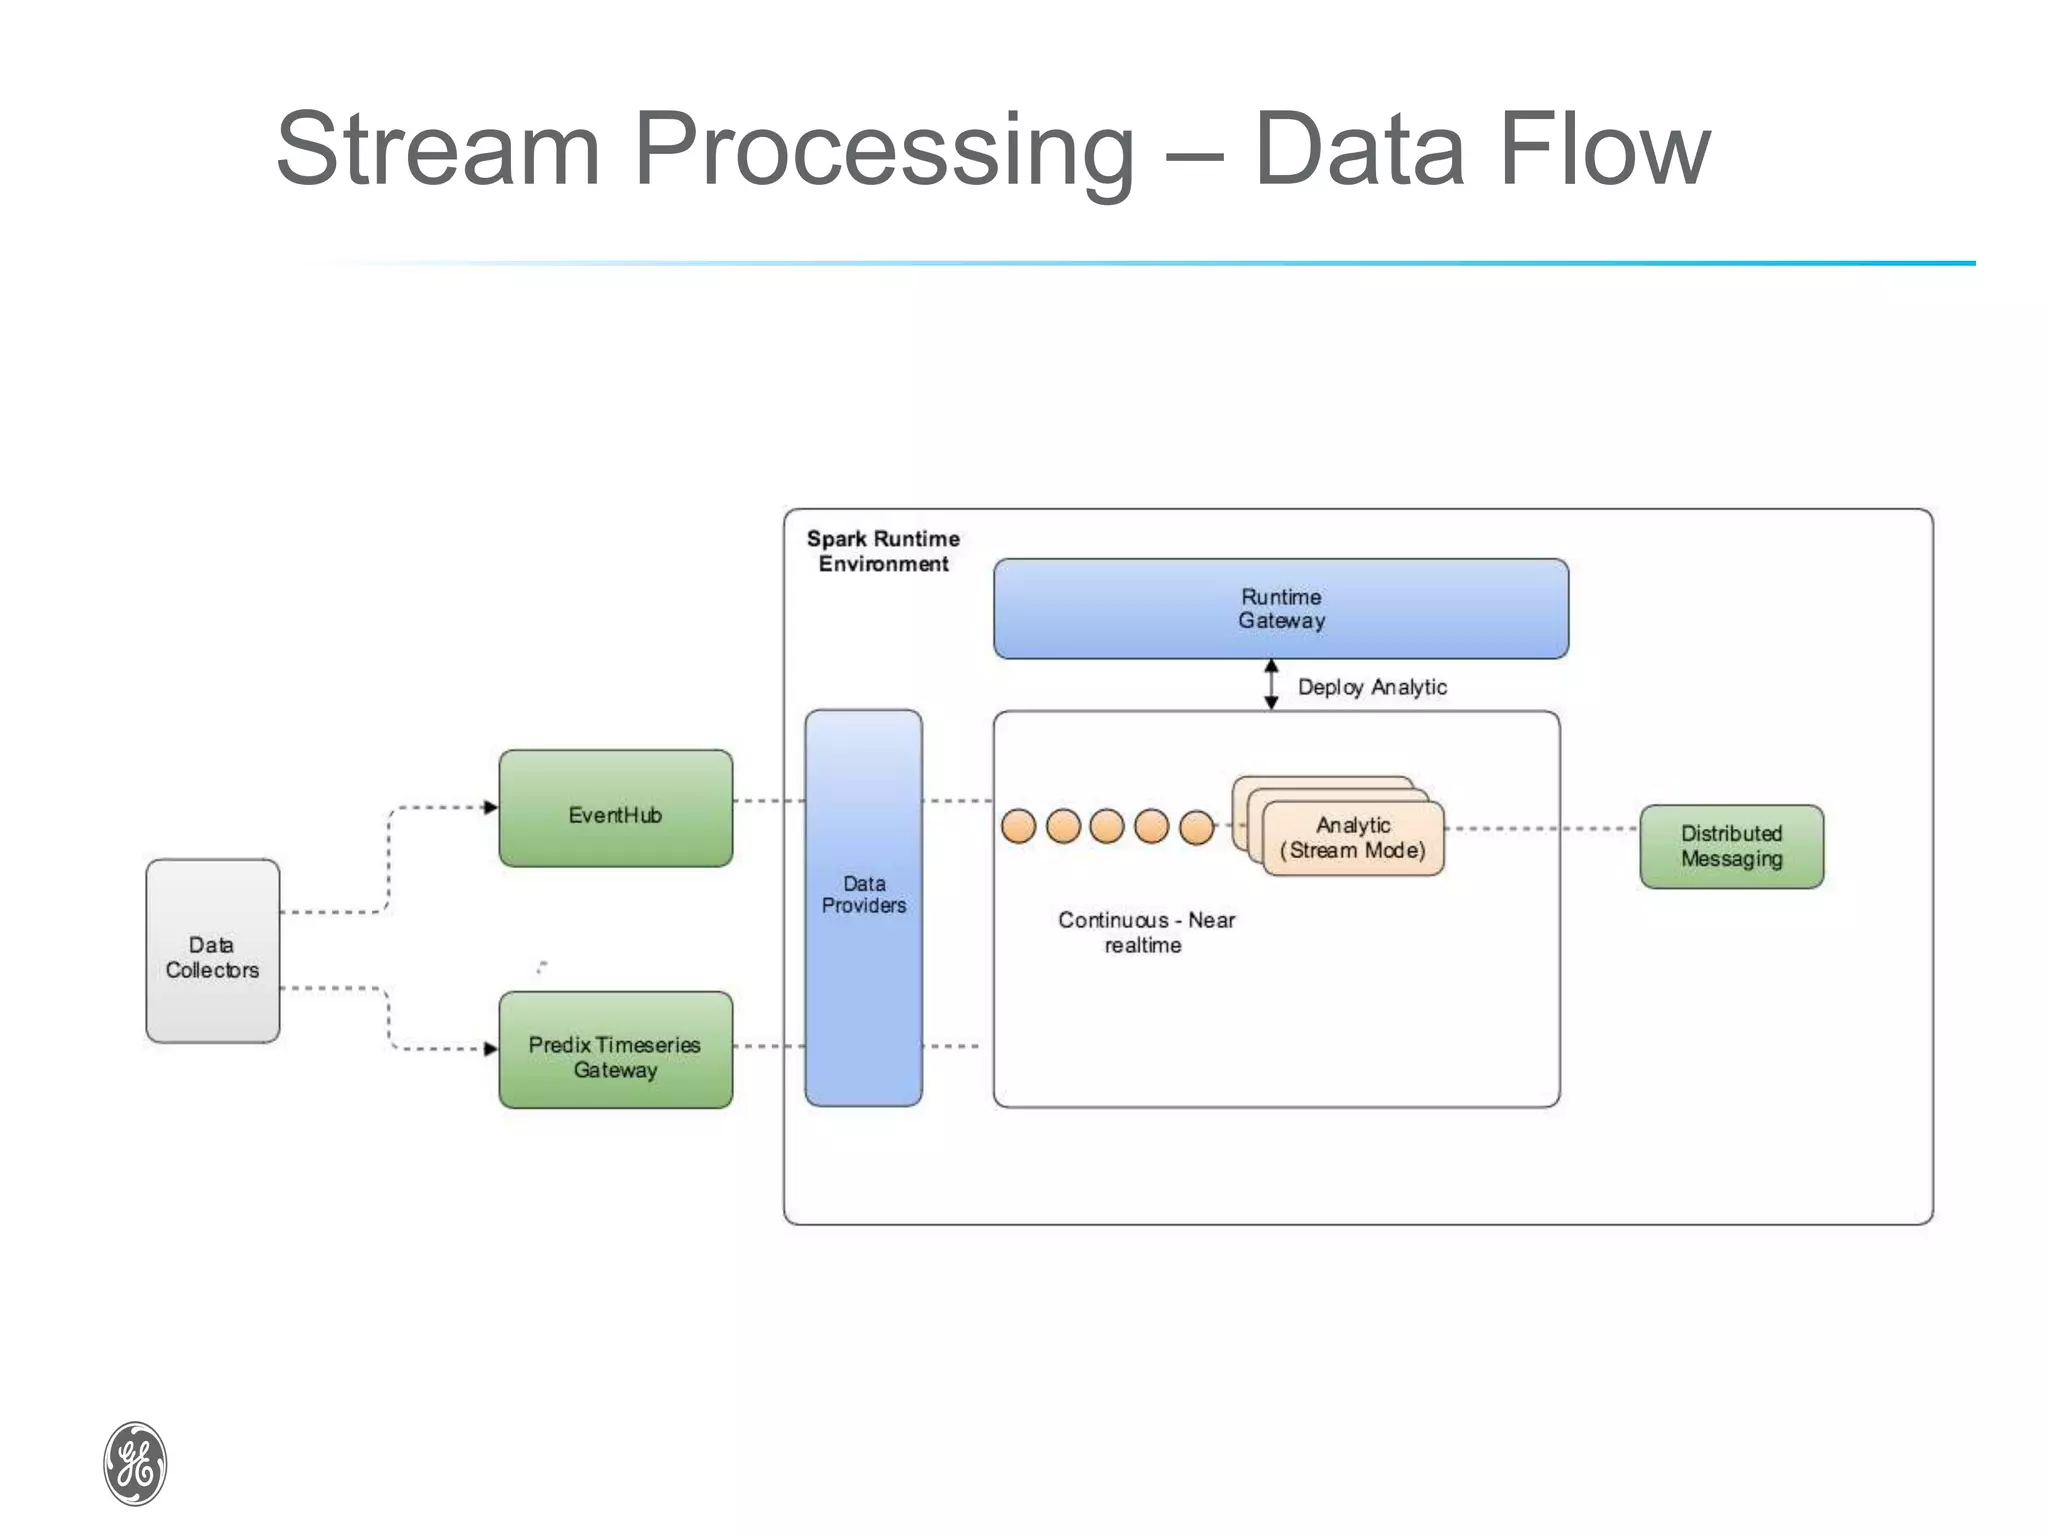
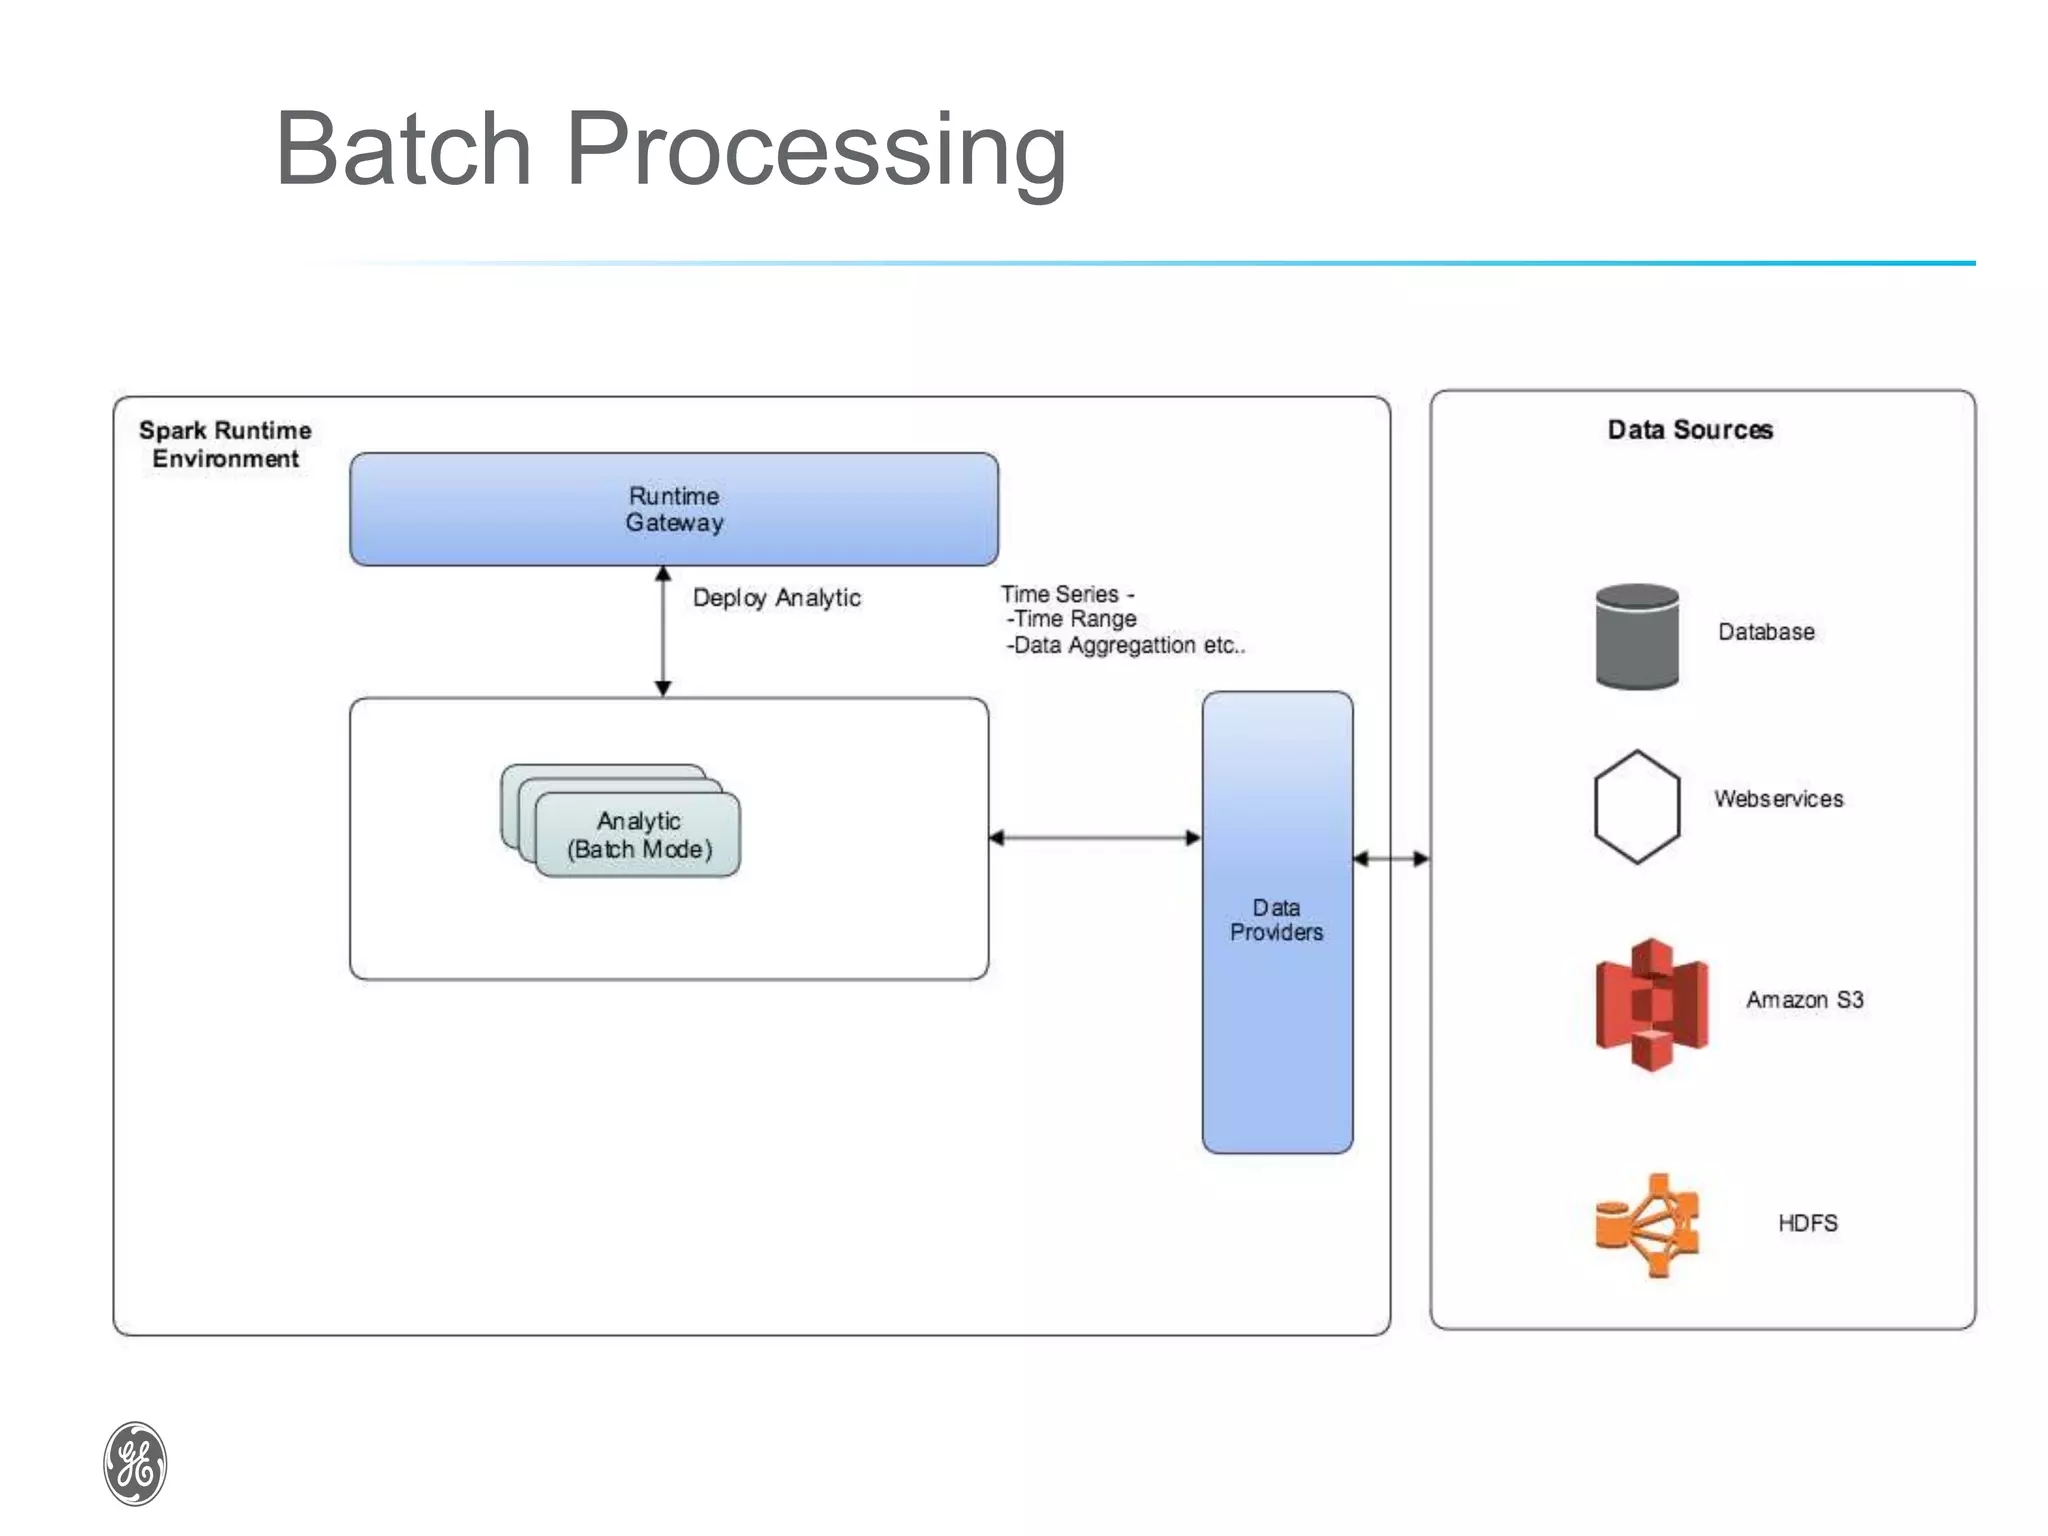


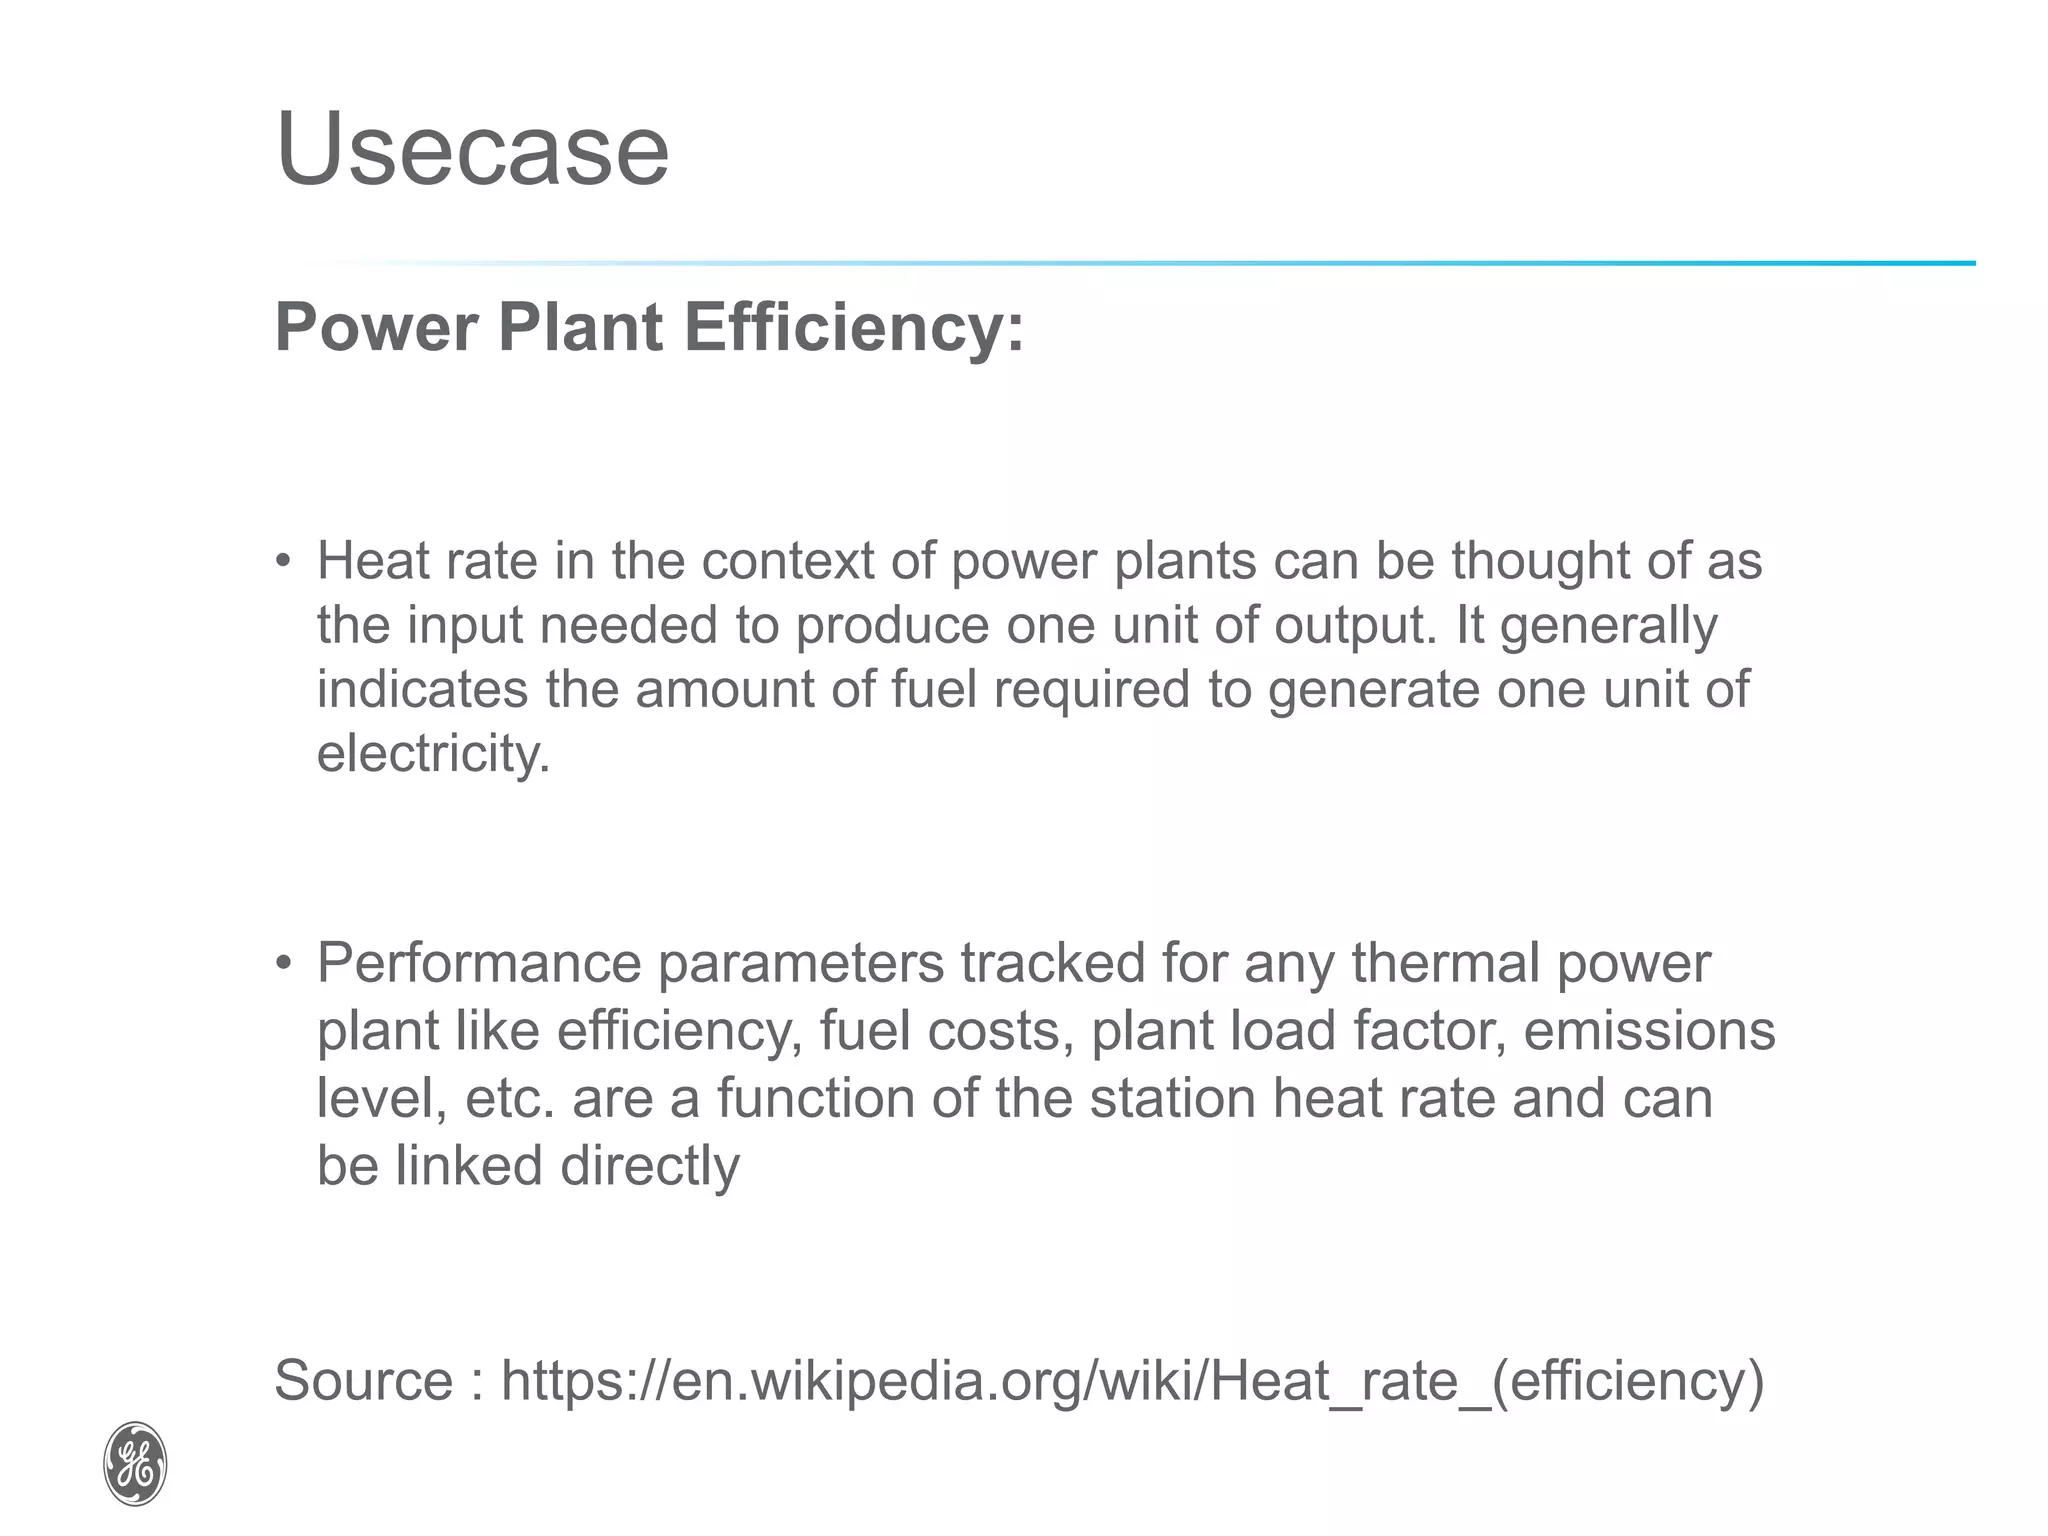
The document discusses optimizing industrial operations in real-time using big data, focusing on a use case for power plant efficiency and the monitoring of performance metrics. It highlights the integration of Apache Spark as an analytic runtime for both streaming and batch data analysis, addressing the challenges of high-volume data processing. The future steps include advancements in structured streaming and the development of machine learning pipelines.