The document discusses a network optimization project for a 3G rollout in the Philippines that has faced issues. Key points:
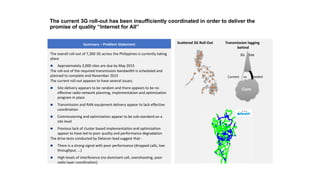
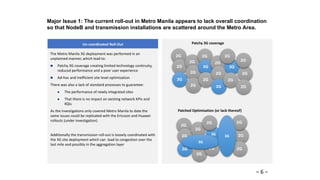
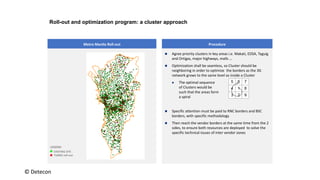
- The current 3G rollout has been uncoordinated, resulting in scattered site and transmission installations across Metro Manila without effective planning.
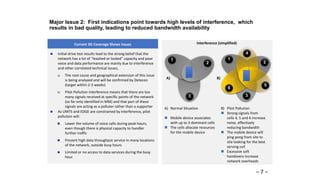
- Initial tests found high interference levels, poor voice and data performance, and unused network capacity, likely due to pilot pollution interference.
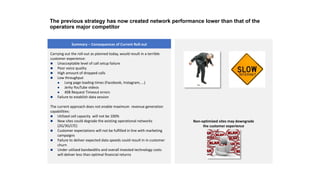
- If not addressed, the scattered rollout will result in unacceptable call failures, poor voice quality, dropped calls, and slow data speeds, damaging the customer experience and revenue generation.
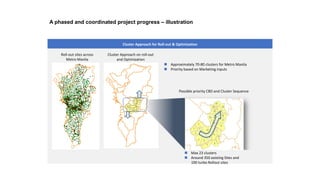
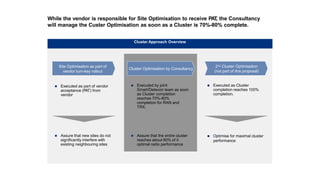
- The proposed solution is to take a coordinated, cluster-based approach to further 3G rollout and optimization across Metro Manila to remedy issues and


![Close coordination between 3G roll-out, optimization and transmission guarantees the
best possible customer experience
RNC
Cluster Area
3G in scope of Cluster
3G out of scope of Cluster
but under investigation
Transmission scope beyond cluster
Roll-out coordination per cluster
Co-ordinated NodeB
and transmission
rollout
3G is expected to be
faster than Tx
Optimization of radio
can start with Tx still
on-going
Final Optimization
needs full band-
width to complete
3G Sites
Transmission
Optimization
0 40 80 [%3G]
0 25 50 80 [%Tx]
Cluster
Transmission roll-out will closely follow the 3G site Cluster roll-
out
FOC rings span areas greater than the individual Cluster
Bandwidth from the sites is only part of the end-to-end
bandwidth requirement to be taken into account
Transmission planning has to plan/decide:
Technology to use: FOC, µWave, copper
End-to-end needs: which rings are affected, where will
additional bandwidth be needed
Best use of available resources
Additionally, certain on-going activities affect Transmission:
VDSL (with >20Mbps/copper pair) as a technology
µW links can be used for rapid deployment. This could lead
a delay in reaching a full FOC network.
Current vendors planned for a phase-out (can) get an
extension (ECI, Aviat) due to rapid delivery and/or
deployment
Transmission
© Detecon](https://image.slidesharecdn.com/optimisationprojectoverview-180506140404/85/Optimisation-project-overview-11-320.jpg)


![60936529 55241452-kpi-3 g-3[1]](https://cdn.slidesharecdn.com/ss_thumbnails/60936529-55241452-kpi-3g-31-150515142158-lva1-app6891-thumbnail.jpg?width=640&height=640&fit=bounds)